1992 United States presidential election in North Carolina
The 1992 United States presidential election in North Carolina took place on November 3, 1992, and was part of the 1992 United States presidential election. Voters chose 14 representatives, or electors to the Electoral College, who voted for president and vice president.
| |||||||||||||||||||||||||||||||||
| |||||||||||||||||||||||||||||||||
 County Results
| |||||||||||||||||||||||||||||||||
| |||||||||||||||||||||||||||||||||
.jpg.webp)


| Elections in North Carolina |
|---|
 |
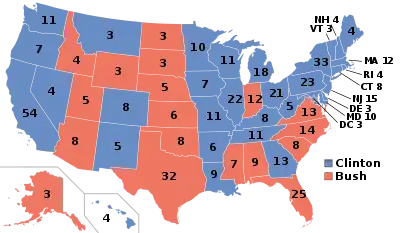
North Carolina was very narrowly won by incumbent Republican President George H. W. Bush of Texas over his Democratic challenger, Governor Bill Clinton of Arkansas. Bush took 43.44% of the vote to Clinton’s 42.65%, a margin of 0.79%. North Carolina was the second-closest state in this election behind neighboring Georgia.[1] This was also the first time since 1956 when North Carolina did not support the winning candidate. It has since gone on to back losing Republicans Bob Dole in 1996, Mitt Romney in 2012, and Donald Trump in 2020.
Billionaire businessman Ross Perot, running as an Independent, finished in third, with 13.70% of the vote, a relatively strong showing for a third party candidate, and his second highest showing in the Southeast, behind only Florida.
Despite being from the South, Bill Clinton became the first Democrat to win the White House without carrying the state of North Carolina since 1844. As of the 2020 presidential election, the 1992 election constitutes the last occasion the following counties have supported a Democratic presidential nominee: Alleghany, Brunswick, Greene, Pamlico, Pender, Rockingham, Sampson and Yancey.[2]
Results
| 1992 United States presidential election in North Carolina[3] | |||||
|---|---|---|---|---|---|
| Party | Candidate | Votes | Percentage | Electoral votes | |
| Republican | George H. W. Bush (incumbent) | 1,134,661 | 43.44% | 14 | |
| Democratic | Bill Clinton | 1,114,042 | 42.65% | 0 | |
| Independent | Ross Perot | 357,864 | 13.70% | 0 | |
| Libertarian | Andre Marrou | 5,171 | 0.20% | 0 | |
| New Alliance Party | Lenora Fulani (write-in) | 59 | 0.00% | 0 | |
| Natural Law | Dr. John Hagelin (write-in) | 41 | 0.00% | 0 | |
| Socialist Workers Party | James Warren (write-in) | 12 | 0.00% | 0 | |
| Totals | 2,611,850 | 100.0% | 14 | ||
| Voter turnout | 54.52% | — | |||
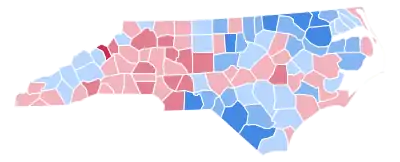
Results by county
| County | George Herbert Walker Bush[4] Republican |
William Jefferson Clinton[4] Democratic |
Henry Ross Perot[4] Independent |
Various candidates[4] Other parties |
Margin | |||||
|---|---|---|---|---|---|---|---|---|---|---|
| % | # | % | # | % | # | % | # | % | # | |
| Mitchell | 62.79% | 4,405 | 24.62% | 1,727 | 12.50% | 877 | 0.09% | 6 | 38.18% | 2,678 |
| Avery | 57.39% | 3,895 | 25.86% | 1,755 | 16.55% | 1,123 | 0.21% | 14 | 31.53% | 2,140 |
| Yadkin | 56.34% | 7,311 | 30.15% | 3,913 | 13.29% | 1,725 | 0.22% | 28 | 26.18% | 3,398 |
| Gaston | 56.51% | 34,714 | 31.12% | 19,121 | 12.19% | 7,490 | 0.18% | 110 | 25.38% | 15,593 |
| Davie | 54.86% | 6,796 | 29.67% | 3,675 | 15.36% | 1,903 | 0.10% | 13 | 25.20% | 3,121 |
| Randolph | 53.20% | 20,697 | 28.98% | 11,274 | 17.66% | 6,870 | 0.16% | 61 | 24.22% | 9,423 |
| Wilkes | 52.57% | 12,547 | 33.48% | 7,991 | 13.86% | 3,307 | 0.10% | 23 | 19.09% | 4,556 |
| Henderson | 51.43% | 17,010 | 32.50% | 10,747 | 15.90% | 5,260 | 0.17% | 55 | 18.94% | 6,263 |
| Cabarrus | 51.75% | 21,281 | 32.86% | 13,513 | 15.20% | 6,251 | 0.19% | 78 | 18.89% | 7,768 |
| Catawba | 51.54% | 25,466 | 33.06% | 16,334 | 15.23% | 7,523 | 0.17% | 86 | 18.48% | 9,132 |
| Union | 51.71% | 16,542 | 33.72% | 10,789 | 14.38% | 4,601 | 0.19% | 60 | 17.98% | 5,753 |
| Davidson | 50.01% | 24,869 | 33.11% | 16,462 | 16.74% | 8,324 | 0.14% | 70 | 16.91% | 8,407 |
| Rowan | 49.84% | 21,297 | 33.48% | 14,308 | 16.51% | 7,053 | 0.17% | 74 | 16.36% | 6,989 |
| Iredell | 49.80% | 19,411 | 34.03% | 13,263 | 15.92% | 6,204 | 0.26% | 102 | 15.77% | 6,148 |
| Onslow | 48.70% | 11,842 | 33.08% | 8,045 | 18.04% | 4,387 | 0.18% | 44 | 15.61% | 3,797 |
| Stanly | 50.91% | 11,030 | 35.70% | 7,735 | 13.18% | 2,855 | 0.20% | 44 | 15.21% | 3,295 |
| Wayne | 52.29% | 14,397 | 37.44% | 10,307 | 10.16% | 2,798 | 0.11% | 30 | 14.86% | 4,090 |
| Alexander | 49.64% | 6,764 | 35.59% | 4,849 | 14.69% | 2,002 | 0.08% | 11 | 14.05% | 1,915 |
| Caldwell | 49.04% | 12,543 | 35.32% | 9,033 | 15.50% | 3,965 | 0.14% | 35 | 13.72% | 3,510 |
| Johnston | 48.67% | 15,418 | 35.62% | 11,284 | 15.59% | 4,939 | 0.12% | 38 | 13.05% | 4,134 |
| Lincoln | 49.29% | 11,018 | 36.46% | 8,150 | 14.06% | 3,142 | 0.20% | 45 | 12.83% | 2,868 |
| Nash | 48.34% | 14,446 | 36.17% | 10,809 | 15.20% | 4,544 | 0.29% | 87 | 12.17% | 3,637 |
| Alamance | 48.33% | 20,637 | 36.35% | 15,521 | 15.09% | 6,444 | 0.23% | 99 | 11.98% | 5,116 |
| Carteret | 47.36% | 10,334 | 36.79% | 8,028 | 15.59% | 3,401 | 0.26% | 56 | 10.57% | 2,306 |
| Moore | 46.81% | 12,448 | 36.29% | 9,649 | 16.73% | 4,448 | 0.17% | 46 | 10.53% | 2,799 |
| Graham | 49.51% | 1,919 | 40.02% | 1,551 | 10.40% | 403 | 0.08% | 3 | 9.49% | 368 |
| Rutherford | 47.95% | 9,748 | 38.64% | 7,855 | 13.26% | 2,695 | 0.15% | 31 | 9.31% | 1,893 |
| Stokes | 47.90% | 7,979 | 38.80% | 6,463 | 13.11% | 2,183 | 0.19% | 32 | 9.10% | 1,516 |
| New Hanover | 46.67% | 24,338 | 38.91% | 20,291 | 14.19% | 7,401 | 0.24% | 124 | 7.76% | 4,047 |
| Clay | 47.73% | 1,890 | 40.40% | 1,600 | 11.74% | 465 | 0.13% | 5 | 7.32% | 290 |
| Polk | 45.77% | 3,448 | 39.02% | 2,939 | 15.05% | 1,134 | 0.16% | 12 | 6.76% | 509 |
| Transylvania | 45.55% | 5,984 | 38.97% | 5,120 | 15.27% | 2,006 | 0.21% | 27 | 6.58% | 864 |
| Surry | 46.33% | 10,866 | 40.05% | 9,392 | 13.49% | 3,164 | 0.13% | 31 | 6.28% | 1,474 |
| Craven | 45.77% | 11,575 | 39.54% | 9,998 | 14.55% | 3,679 | 0.14% | 35 | 6.24% | 1,577 |
| Harnett | 46.58% | 9,751 | 40.48% | 8,473 | 12.82% | 2,684 | 0.11% | 24 | 6.11% | 1,278 |
| McDowell | 45.81% | 6,090 | 39.93% | 5,309 | 14.15% | 1,881 | 0.11% | 15 | 5.87% | 781 |
| Beaufort | 45.91% | 7,337 | 40.33% | 6,445 | 13.60% | 2,174 | 0.15% | 24 | 5.58% | 892 |
| Lee | 45.42% | 6,658 | 39.92% | 5,852 | 14.50% | 2,125 | 0.16% | 24 | 5.50% | 806 |
| Ashe | 46.97% | 5,200 | 41.77% | 4,624 | 11.02% | 1,220 | 0.23% | 26 | 5.20% | 576 |
| Currituck | 41.31% | 2,188 | 36.53% | 1,935 | 21.96% | 1,163 | 0.21% | 11 | 4.78% | 253 |
| Dare | 40.73% | 4,357 | 36.70% | 3,925 | 22.33% | 2,388 | 0.24% | 26 | 4.04% | 432 |
| Cherokee | 45.91% | 4,021 | 42.09% | 3,686 | 11.87% | 1,040 | 0.13% | 11 | 3.83% | 335 |
| Forsyth | 45.40% | 52,787 | 42.15% | 49,006 | 12.27% | 14,262 | 0.19% | 219 | 3.25% | 3,781 |
| Burke | 44.48% | 13,397 | 41.71% | 12,565 | 13.69% | 4,124 | 0.12% | 36 | 2.76% | 832 |
| Cleveland | 44.72% | 13,650 | 42.71% | 13,037 | 12.40% | 3,784 | 0.17% | 51 | 2.01% | 613 |
| Macon | 42.53% | 4,797 | 41.00% | 4,624 | 16.22% | 1,829 | 0.26% | 29 | 1.53% | 173 |
| Person | 43.60% | 4,460 | 42.26% | 4,323 | 13.99% | 1,431 | 0.16% | 16 | 1.34% | 137 |
| Mecklenburg | 43.57% | 99,496 | 42.50% | 97,065 | 13.70% | 31,283 | 0.23% | 531 | 1.06% | 2,431 |
| Lenoir | 45.02% | 8,932 | 44.32% | 8,793 | 10.62% | 2,107 | 0.05% | 10 | 0.70% | 139 |
| Wilson | 44.36% | 10,176 | 44.06% | 10,105 | 11.47% | 2,630 | 0.11% | 26 | 0.31% | 71 |
| Wake | 41.84% | 86,798 | 42.89% | 88,979 | 15.01% | 31,140 | 0.27% | 550 | -1.05% | -2,181 |
| Watauga | 41.09% | 7,899 | 42.98% | 8,262 | 15.64% | 3,007 | 0.30% | 57 | -1.89% | -363 |
| Buncombe | 40.92% | 30,892 | 43.65% | 32,955 | 15.21% | 11,481 | 0.22% | 164 | -2.73% | -2,063 |
| Yancey | 43.38% | 3,994 | 46.54% | 4,285 | 9.96% | 917 | 0.13% | 12 | -3.16% | -291 |
| Pitt | 41.63% | 16,609 | 45.02% | 17,959 | 13.19% | 5,262 | 0.16% | 65 | -3.38% | -1,350 |
| Sampson | 43.12% | 8,007 | 46.84% | 8,698 | 9.97% | 1,852 | 0.06% | 11 | -3.72% | -691 |
| Rockingham | 40.54% | 12,678 | 44.39% | 13,880 | 14.94% | 4,671 | 0.13% | 40 | -3.84% | -1,202 |
| Guilford | 41.08% | 60,140 | 45.30% | 66,319 | 13.39% | 19,601 | 0.23% | 339 | -4.22% | -6,179 |
| Camden | 38.84% | 1,039 | 43.10% | 1,153 | 17.91% | 479 | 0.15% | 4 | -4.26% | -114 |
| Cumberland | 42.10% | 27,139 | 46.98% | 30,291 | 10.54% | 6,792 | 0.38% | 248 | -4.89% | -3,152 |
| Pamlico | 38.77% | 1,929 | 44.80% | 2,229 | 16.26% | 809 | 0.16% | 8 | -6.03% | -300 |
| Pender | 39.07% | 4,857 | 46.86% | 5,825 | 13.88% | 1,725 | 0.19% | 23 | -7.79% | -968 |
| Brunswick | 38.40% | 8,833 | 46.86% | 10,777 | 14.56% | 3,349 | 0.18% | 41 | -8.45% | -1,944 |
| Alleghany | 39.18% | 1,853 | 48.01% | 2,271 | 12.68% | 600 | 0.13% | 6 | -8.84% | -418 |
| Montgomery | 38.67% | 3,543 | 48.27% | 4,422 | 12.94% | 1,185 | 0.12% | 11 | -9.60% | -879 |
| Perquimans | 36.85% | 1,429 | 46.88% | 1,818 | 16.09% | 624 | 0.18% | 7 | -10.03% | -389 |
| Greene | 38.03% | 2,180 | 48.29% | 2,768 | 13.61% | 780 | 0.07% | 4 | -10.26% | -588 |
| Chowan | 36.86% | 1,661 | 47.40% | 2,136 | 15.53% | 700 | 0.20% | 9 | -10.54% | -475 |
| Madison | 39.07% | 3,121 | 49.82% | 3,980 | 10.73% | 857 | 0.39% | 31 | -10.75% | -859 |
| Duplin | 38.45% | 5,286 | 49.58% | 6,816 | 11.90% | 1,636 | 0.07% | 9 | -11.13% | -1,530 |
| Swain | 37.36% | 1,640 | 49.59% | 2,177 | 12.94% | 568 | 0.11% | 5 | -12.23% | -537 |
| Jackson | 36.99% | 4,275 | 49.78% | 5,753 | 13.12% | 1,516 | 0.12% | 14 | -12.79% | -1,478 |
| Pasquotank | 35.69% | 3,419 | 49.15% | 4,709 | 14.97% | 1,434 | 0.20% | 19 | -13.46% | -1,290 |
| Granville | 37.42% | 4,538 | 50.94% | 6,178 | 10.89% | 1,321 | 0.75% | 91 | -13.52% | -1,640 |
| Jones | 37.39% | 1,438 | 51.01% | 1,962 | 11.54% | 444 | 0.05% | 2 | -13.62% | -524 |
| Martin | 36.90% | 2,958 | 50.76% | 4,069 | 12.24% | 981 | 0.10% | 8 | -13.86% | -1,111 |
| Franklin | 35.20% | 4,669 | 49.13% | 6,517 | 15.54% | 2,062 | 0.14% | 18 | -13.93% | -1,848 |
| Vance | 37.09% | 4,747 | 51.55% | 6,598 | 11.28% | 1,444 | 0.09% | 11 | -14.46% | -1,851 |
| Haywood | 34.71% | 7,292 | 49.43% | 10,385 | 15.72% | 3,303 | 0.14% | 29 | -14.72% | -3,093 |
| Chatham | 35.36% | 6,568 | 51.25% | 9,520 | 13.05% | 2,425 | 0.34% | 64 | -15.89% | -2,952 |
| Hyde | 32.34% | 740 | 52.71% | 1,206 | 14.86% | 340 | 0.09% | 2 | -20.37% | -466 |
| Washington | 33.89% | 1,780 | 55.24% | 2,902 | 10.72% | 563 | 0.15% | 8 | -21.36% | -1,122 |
| Tyrrell | 33.03% | 553 | 55.44% | 928 | 11.29% | 189 | 0.24% | 4 | -22.40% | -375 |
| Caswell | 33.40% | 2,793 | 56.50% | 4,725 | 9.89% | 827 | 0.22% | 18 | -23.10% | -1,932 |
| Scotland | 31.84% | 2,980 | 55.29% | 5,175 | 12.78% | 1,196 | 0.10% | 9 | -23.45% | -2,195 |
| Halifax | 32.40% | 5,769 | 55.94% | 9,960 | 11.50% | 2,047 | 0.16% | 28 | -23.54% | -4,191 |
| Durham | 33.36% | 27,581 | 57.24% | 47,331 | 9.08% | 7,504 | 0.32% | 268 | -23.89% | -19,750 |
| Bladen | 31.58% | 3,214 | 56.01% | 5,700 | 12.26% | 1,248 | 0.15% | 15 | -24.43% | -2,486 |
| Edgecombe | 31.92% | 6,275 | 56.84% | 11,174 | 11.06% | 2,175 | 0.17% | 33 | -24.92% | -4,899 |
| Gates | 30.20% | 1,158 | 57.54% | 2,206 | 12.15% | 466 | 0.10% | 4 | -27.33% | -1,048 |
| Richmond | 28.01% | 4,356 | 58.91% | 9,163 | 12.96% | 2,015 | 0.12% | 19 | -30.91% | -4,807 |
| Hertford | 28.78% | 2,208 | 60.08% | 4,609 | 11.03% | 846 | 0.12% | 9 | -31.30% | -2,401 |
| Columbus | 28.88% | 5,462 | 60.63% | 11,469 | 10.38% | 1,963 | 0.12% | 22 | -31.76% | -6,007 |
| Hoke | 27.00% | 1,711 | 58.86% | 3,730 | 14.00% | 887 | 0.14% | 9 | -31.86% | -2,019 |
| Orange | 27.50% | 13,009 | 60.45% | 28,595 | 11.70% | 5,535 | 0.34% | 161 | -32.95% | -15,586 |
| Anson | 27.33% | 2,334 | 61.71% | 5,269 | 10.79% | 921 | 0.18% | 15 | -34.37% | -2,935 |
| Robeson | 25.52% | 7,777 | 63.59% | 19,378 | 10.75% | 3,277 | 0.14% | 42 | -38.07% | -11,601 |
| Bertie | 26.04% | 1,756 | 64.99% | 4,382 | 8.90% | 600 | 0.07% | 5 | -38.94% | -2,626 |
| Warren | 24.80% | 1,767 | 65.35% | 4,656 | 9.73% | 693 | 0.13% | 9 | -40.55% | -2,889 |
| Northampton | 23.16% | 1,845 | 65.21% | 5,195 | 11.50% | 916 | 0.14% | 11 | -42.05% | -3,350 |
References
- Dave Leip’s U.S. Election Atlas; 1992 Presidential Election Statistics
- Sullivan, Robert David; ‘How the Red and Blue Map Evolved Over the Past Century’; America Magazine in The National Catholic Review; June 29, 2016
- Dave Leip’s U.S. Election Atlas; 1992 Presidential General Election Data Graphs - North Carolina by County
- Our Campaigns; NC US President Race, November 03, 1992