Brockway Area School District
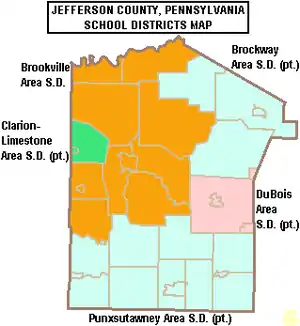
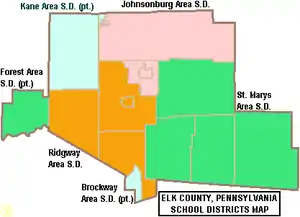
The Brockway Area School District in a small, rural public school district located in north west Pennsylvania, USA. The District encompasses approximately 147 square miles (380 km2) spanning portions of two counties. In Elk County it covers a small portion of Horton Township. In Jefferson County it covers the Borough of Brockway and Polk Township, Snyder Township and Washington Township. The district operates one elementary school and Brockway Area Junior/Senior High School. The District is with the Riverview Intermediate Unit 6 region. The Intermediate Unit provides support services and therapy to special education students. It also provides training to school personnel.
| Brockway Area School District | |
|---|---|
 | |
| Address | |
40 North Street Brockway , Elk County, Jefferson County , 15824 United States | |
| Information | |
| Type | Public |
| Superintendent | Mr. Dan Hawkins[1] |
| Faculty | 81 teachers (2010), 80 (2011)[2] |
| Grades | K-12 |
| Age | 5 years to 21 years for Special education |
| Number of pupils | 1,055 (2010)[3] 1033 students (2011) |
| • Kindergarten | 59 |
| • Grade 1 | 76 |
| • Grade 2 | 80 |
| • Grade 3 | 71 |
| • Grade 4 | 64 |
| • Grade 5 | 87 |
| • Grade 6 | 102 |
| • Grade 7 | 84 |
| • Grade 8 | 99 |
| • Grade 9 | 74 |
| • Grade 10 | 82 |
| • Grade 11 | 80 |
| • Grade 12 | 75 |
| Mascot | Rovers |
| Budget | $13,057,506 (2012–13)[4] |
| per pupile spending | $11,529 (2008) |
| Per pupil spending | $12,432.91 (2010) |
| Website | www |
According to District officials, in the 2009–10 school year, the Brockway Area School District provided basic educational services to 1,054 pupils through the employment of 86 teachers, 49 full-time and part-time support personnel, and 11 administrators. Brockway Area School District again received more than $9 million in state funding for school year 2009–10. In 2007–08, Brockway Area School District had 1,150 pupils enrolled. It employed 89 teachers, 50 full-time and part-time support personnel, and 9 administrators. Brockway Area School District received more than $9 million in state funding in school year 2007–08.
Demographics
According to 2000 federal census data, Brockway Area School District served a resident population of 8,455. The resident population declined to 7,537 people in 2010. In 2009, the district residents’ per capita income was $17,828, while the median family income was $40,732.[5] In the Commonwealth, the median family income was $49,501[6] and the United States median family income was $49,445, in 2010.[7]
Schools
- Brockway Area Elementary School
- Brockway Area Junior/Senior High School
Governance
Brockway Area School District is governed by a locally elected, 9 member board (serve four-year terms), the Pennsylvania State Board of Education, the Pennsylvania Department of Education and the Pennsylvania General Assembly.[8] The federal government controls programs it funds like Title I funding for low-income children in the Elementary and Secondary Education Act and the No Child Left Behind Act, which mandates the district focus resources on student success in acquiring on grade level reading and math skills.
The Commonwealth Foundation for Public Policy Alternatives Sunshine Review gave the school board and district administration a "F" for transparency based on a review of "What information can people find on their school district's website". It examined the school district's website for information regarding; taxes, the current budget, meetings, school board members names and terms, contracts, audits, public records information and more.[9]
Academic achievement
Brockway Area School District was ranked 349th out of 498 Pennsylvania school districts in 2012, by the Pittsburgh Business Times.[10] The ranking was based on student academic achievement as demonstrated on the last three years of the PSSAs for: reading, writing math and science.[11] The PSSAs are given to all children in grades 3rd through 8th and the 11th grade in high school. Adapted examinations are given to children in the special education programs.
- 2011 – 365th[12]
- 2010 – 333rd[13]
- 2009 – 317th
- 2008 – 302nd
- 2007 – 329th out of 501 school districts.[14]
- Overachievers statewide ranking
In 2011, the Pittsburgh Business Times reported an Overachievers Ranking for 498 Pennsylvania school districts. Brockway Area School District ranked 201st. In 2010, the district was 313th. The editor describes the ranking as: "a ranking answers the question – which school districts do better than expectations based upon economics? This rank takes the Honor Roll rank and adds the percentage of students in the district eligible for free and reduced-price lunch into the formula. A district finishing high on this rank is smashing expectations, and any district above the median point is exceeding expectations."[15]
- District AYP status history
Brockway Area School District has achieved Adequate Yearly Progress (AYP), under the No Child Left Behind Act every year since 2003 when the assessments began.[16] In 2011, Brockway Area School District achieved Adequate Yearly Progress (AYP). In 2011, 94 percent of the 500 Pennsylvania public school districts achieved the No Child Left Behind Act progress level of 72% of students reading on grade level and 67% of students demonstrating on grade level math. In 2011, 46.9 percent of Pennsylvania school districts achieved Adequate Yearly Progress (AYP) based on student performance. An additional 37.8 percent of school districts made AYP based on a calculated method called safe harbor, 8.2 percent on the growth model and 0.8 percent on a two-year average performance.
Graduation rate
In 2011 and 2012, Brockway Area School District's graduation rate was 92%.[17] In 2010, the Pennsylvania Department of Education issued a new, 4-year cohort graduation rate. Brockway Junior Senior High School's rate was 92% for 2010.[18]
- According to traditional graduation rate calculations
Junior Senior High School
Brockway Junior Senior High School is located at 100 Alexander Street, Brockway. According to the National Center for Education Statistics, in 2010, the school reported an enrollment of 490 pupils in grades 7th through 12th, with 186 pupils eligible for a federal free or reduced-price lunch. The school employed 40 teachers, yielding a student–teacher ratio of 12:1.[23] In 2010 through 2012, Brockway Junior Senior High School achieved AYP status.[24]
- 11th Grade Reading
- 2012 – 66% on grade level, (15% below basic). State – 67% of 11th graders are on grade level.[25]
- 2011 – 76%, (13% below basic). State – 69.1%[26]
- 2010 – 64% (24% below basic). State – 66%[27]
- 2009 – 65% (17% below basic). State – 65%[28]
- 2008 – 68% (16% below basic). State – 65%[29]
- 2007 – 53% (18% below basic). State – 65%[30]
- 11th Grade Math
- 2012 – 65% on grade level (14% below basic). In Pennsylvania, 59% of 11th graders are on grade level.[31]
- 2011 – 57% (22% below basic). State – 60.3% .[32]
- 2010 – 57% (26% below basic). State – 59%
- 2009 – 48% (22% below basic). State – 56%.
- 2008 – 58% (21% below basic). State – 56%
- 2007 – 57% (23% below basic). State – 53%
- 11th Grade Science
College remediation rate
According to a Pennsylvania Department of Education study released in January 2009, 18% of the Brockway Area School District graduates required remediation in mathematics and or reading before they were prepared to take college level courses in the Pennsylvania State System of Higher Education or community colleges.[36] Less than 66% of Pennsylvania high school graduates, who enroll in a four-year college in Pennsylvania, will earn a bachelor's degree within six years. Among Pennsylvania high school graduates pursuing an associate degree, only one in three graduate in three years.[37] Per the Pennsylvania Department of Education, one in three recent high school graduates who attend Pennsylvania's public universities and community colleges takes at least one remedial course in math, reading or English.
Dual enrollment
Brockway Senior High School offers a dual enrollment program. This state program permits high school students to take courses, at local higher education institutions, to earn college credits. Students remain enrolled at their high school. The courses count towards high school graduation requirements and towards earning a college degree. The students continue to have full access to activities and programs at their high school. The college credits are offered at a deeply discounted rate. The state offered a small grant to assist students in costs for tuition, fees and books[38] Under the Pennsylvania Transfer and Articulation Agreement, many Pennsylvania colleges and universities accept these credits for students who transfer to their institutions.[39]
Graduation requirements
Brockway Area School Board has determined that a pupil must earn 24 credits to graduate, including: Math – 4 credits, English 4 credits, social studies 3 credits, science 4 credits, Arts and Humanities 2 credits, Health and Physical Education 2 credits and electives 6 credits.[40]
By law, all Pennsylvania secondary school students must complete a project as a part of their eligibility to graduate from high school. The type of project, its rigor and its expectations are set by the individual school district. Beginning with the Class of 2015, students will be required to have 4 science credits[41] At Brockway the students must complete 4 out of 5 choices: participate in at least 2 Career Activities; Complete a Career Interest Survey; Complete a Formal Resume; Participate in two community volunteer projects, activities or organizations and participate in two job shadowing experiences.
By Pennsylvania School Board regulations, for the graduating class of 2017, students must demonstrate successful completion of secondary level course work in Algebra I, Biology, English Composition, and Literature for which the Keystone Exams serve as the final course exams.[42][43][44] In 2011, Pennsylvania high school students field tested the Algebra 1, Biology and English Lit exams. The statewide results were: Algebra 1 38% on grade level, Biology 35% on grade level and English Lit – 49% on grade level.[45] Individual student, school or district reports were not made public, although they were reported to district officials by the Pennsylvania Department of Education.
SAT scores
In 2012, 68 Brockway Area School District students took the SAT exams. The District's Verbal Average Score was 464. The Math average score was 483. The Writing average score was 454. The statewide Verbal SAT exams results were: Verbal 491, Math 501, Writing 480. In the US, 1.65 million students took the exams achieving scores: Verbal 496, Math 514, Writing 488. According to the College Board the maximum score on each section was 800, and 360 students nationwide scored a perfect 2,400.
From January to June 2011, 45 Brockway students took the SAT exams. The district's Verbal Average Score was 491. The Math average score was 512. The Writing average score was 466.[46] Pennsylvania ranked 40th among states with SAT scores: Verbal – 493, Math – 501, Writing – 479.[47] In the United States 1.65 million students took the exam in 2011. They averaged 497 (out of 800) verbal, 514 math and 489 in writing.[48]
Seventh-eighth grades
PSSA Results:
|
|
- 8th Grade Science
- 2012 – 48% on grade level (20% below basic). State – 59%
- 2011 – 57% (28% below basic). State – 58.3%
- 2010 – 53% (28% below basic). State – 57%[49]
- 2009 – 62% (17% below basic). State – 55%[50]
- 2008 – 50% (21% below basic). State – 52%[51]
|
7th Grade Reading
|
7th Grade Math:
|
Elementary School
Brockway Area Elementary School is located at 40 North Street, Brockway. In 2010, the school had 565 students enrolled in grades kindergarten through 6th grade, with 268 pupils receiving a federal free or reduced-price lunch due to family poverty. The school employed 41 teachers, yielding a student–teacher ratio of 13:1.[52] In 2010 through 2012, Brockway Area Elementary School achieved AYP status.[53]
- PSSA Results
|
6th Grade Reading:
|
6th Grade Math:
|
|
5th Grade Reading:
|
5th Grade Math:
|
|
|
- 4th Grade Science
- 2012 – 88%, (2% below basic). State – 82%
- 2011 – 83%, (8% below basic). State – 82.9%
- 2010 – 84%, (8% below basic). State – 81%
- 2009 – 92%, (2% below basic). State – 83%
- 2008 – 74%, (8% below basic). State – 81%
|
|
Special education
In December 2010, the district administration reported that 144 pupils or 13% of the district's pupils received Special Education services, with 48% of identified students having a specific learning disability.[55] In December 2009, the District administration reported that 147 pupils or 13% of the district's pupils received Special Education services, with 47.6% of the identified pupils having specific learning disabilities.
To comply with state and federal Individuals with Disabilities Education Act rules and regulations, the school district engages in identification procedures to ensure that eligible students receive an appropriate educational program consisting of special education and related services, individualized to meet student needs. At no cost to the parents, these services are provided in compliance with state and federal law; and are reasonably calculated to yield meaningful educational benefit and student progress .[56] To identify students who may be eligible for special education services, various screening activities are conducted on an ongoing basis. These screening activities include: review of group-based data (cumulative records, enrollment records, health records, report cards, ability and achievement test scores); hearing, vision, motor, and speech/language screening; and review by the Special Education administration. When screening results suggest that the student may be eligible, the District seeks parental consent to conduct a multidisciplinary evaluation. Parents who suspect their child is eligible may verbally request a multidisciplinary evaluation from a professional employee of the District or contact the district's Special Education Department.[57][58]
In 2010, the state of Pennsylvania provided $1,026,815,000 for special education services. This funding is in addition to the state's basic education per pupil funding, as well as, all other state and federal funding.[59] The Pennsylvania Special Education funding system assumes that 16% of the district's students receive special education services. It also assumes that each student's needs accrue the same level of costs.[60] The state requires each district to have a three-year special education plan to meet the unique needs of its special education students.[61] Overidentification of students, to increase state funding, has been an issue in the Commonwealth. Some districts have more than 20% of its students receiving special education services while others have 10% supported through special education.[62]
Brockway Area School District received a $698,231 supplement for special education services in 2010.[63] For the 2012–13 and 2011–12 school years, all Pennsylvania public school districts received the same level of funding for special education that they received in 2010–11. This level funding is provided regardless of changes in the number of pupils who need special education services and regardless of the level of services the respective students required.[64]
Gifted education
The District Administration reported that 63 or 5.74% of its students were gifted in 2009.[65] By law, the district must provide mentally gifted programs at all grade levels. The referral process for a gifted evaluation can be initiated by teachers or parents by contacting the student's building principal and requesting an evaluation. All requests must be made in writing. To be eligible for mentally gifted programs in Pennsylvania, a student must have a cognitive ability of at least 130 as measured on a standardized ability test by a certified school psychologist. Other factors that indicate giftedness will also be considered for eligibility.[66][67]
Enrollment
Brockway Area School District has a low enrollment which is projected to continue to decline through 2015. The Class of 2013 has 58 pupils. The class of 2011, was 79 pupils. The Class of 2007 had 90 pupils.[68]
Over the next 10 years, rural Pennsylvania school enrollment is projected to decrease 8 percent. The most significant enrollment decline is projected to be in western Pennsylvania, where rural school districts may have a 16 percent decline. More than 40 percent of elementary schools and more than 60 percent of secondary schools in western Pennsylvania are projected to experience significant enrollment decreases (15 percent or greater).[69] As the enrollment declines, per pupil administrative costs of the schools continue to rise.
Pennsylvania has one of the highest numbers of school districts in the United States. In Pennsylvania, 80% of school districts serve student populations under 5,000, and 40% serve less than 2,000. Less than 95 of Pennsylvania's 501 school districts had enrollment below 1250 students, in 2007.[70] This results in excessive school administration bureaucracy and not enough course diversity.[71] In a survey of 88 superintendents of small districts, 42% of the 49 respondents stated that they thought consolidation would save money without closing any schools.[72] In March 2011, the Pennsylvania Institute of Certified Public Accountants released a report finding that the state would save hundreds of millions of tax dollars, by cutting the number of school administrations in half through consolidation, with no impact on programs offered to students.[73]
Budget
In 2011, the average teacher salary in Brockway Area School District was $50,590 a year, while the cost of the benefits teachers receive was $17,018 per employee, for a total annual average teacher compensation of $67,609.[74]
In 2009, Brockway Area School District reported employing 125 teachers and administrators with a starting salary of $31,840, a median salary of $52,968 and a top salary of $110,000.[75] Brockway Area School District teachers work 7.5 hours a day with a 30-minute duty-free lunch and a daily preparation period. The work year is 183 days. Additionally, the teachers receive a defined benefit pension, health insurance (employee contributes $360 per year), dental insurance, vision insurance, life insurance, group long term disability insurance, professional development reimbursement, 3 paid personal days, 10 paid sick days, up to 5 paid bereavement days, and other benefits.[76]
In 2007, the district employed 81 teachers. The average teacher salary in the district was $50,185 for the 180 student days worked.[77] As of 2007, Pennsylvania ranked in the top 10 states in average teacher salaries. When adjusted for cost of living Pennsylvania ranked fourth in the nation for teacher compensation.[78]
Brockway Area School District administrative costs per pupil in 2008 was $754.44 per pupil. The lowest administrative cost per pupil in Pennsylvania was $398 per pupil.[79] Superintendents and administrators receive a benefit package commensurate with that offered to the district's teachers' union.[80]
In 2008, Brockway Area School District administration reported that per pupil spending was $11,529 which ranked 337th among Pennsylvania's 501 public school districts. In 2010, the District's per pupil spending had increased to $11,681.16[81] Among the states, Pennsylvania's total per pupil revenue (including all sources) ranked 11th at $15,023 per student, in 2008–09.[82] In 2007, the Pennsylvania per pupil total expenditures was $12,759.[83]
Reserves In 2008, the Brockway Area School District reported a balance of $1,521,132 in an unreserved-designated fund. The unreserved-undesignated fund balance was reported as $8,798,727.[84] In 2010, Brockway Area Administration reported an increase to $11,154,096 in the unreserved-undesignated fund balance, while the unreserved-designated fund having a balance of zero. Pennsylvania school district reserve funds are divided into two categories – designated and undesignated. The undesignated funds are not committed to any planned project. Designated funds and any other funds, such as capital reserves, are allocated to specific projects. School districts are required by state law to keep 5 percent of their annual spending in the undesignated reserve funds to preserve bond ratings. According to the Pennsylvania Department of Education, from 2003 to 2010, as a whole, Pennsylvania school districts amassed nearly $3 billion in reserved funds.[85]
In October 2010, the Pennsylvania Auditor General conducted a performance audit of the District. The findings were reported to the school board and administration.[86] In December 2012, the Pennsylvania Auditor General conducted another performance audit of the District.
Students who live in the District's attendance range may choose to attend one of Pennsylvania's 157 public charter schools. Or a student living in a neighboring public school district may seek admission to Brockway Area School District. For these cases, the Pennsylvania Department of Education sets an annual tuition rate for each school district. It is the amount the public school district pays to a charter school for each resident student that attends the charter and it is the amount a nonresident student's parents must pay to attend the District's schools. Elementary School – $8,985.70, High School – $10,087.22[87]
The district is funded by a combination of: a local income tax – 1%, a property tax, a real estate transfer tax 0.5%, coupled with substantial funding from the Commonwealth of Pennsylvania and the federal government. In the Commonwealth of Pennsylvania, pension income and Social Security income are exempted from state personal income tax and local earned income tax, regardless of the level of the individual's personal wealth.[88]
State basic education funding
For the 2012–13 school year, Brockway Area School District received $6,819,100.[89] The Governor's Executive Budget for 2012–2013 included $9.34 billion for kindergarten through 12th grade public education, including $5.4 billion in basic education funding, which was an increase of $49 million over the 2011–12 budget. In addition, the Commonwealth provided $100 million for the Accountability Block grant program. The District received $79,760 in Accountability Block Grant funds.
In 2011–12, Brockway Area School District received a $6,739,340 allocation of state Basic Education Funding.[90][91] Additionally, Brockway Area School District received $79,760 in Accountability Block Grant funding. The enacted Pennsylvania state Education budget includes $5,354,629,000 for the 2011–2012 Basic Education Funding appropriation. This amount is a $233,290,000 increase (4.6%) over the enacted State appropriation for 2010–2011.[92] The highest increase in state basic education funding was awarded to Duquesne City School District, which got a 49% increase in state funding for 2011–12.[93] In 2010, the district reported that 434 students received free or reduced-price lunches, due to the family meeting the federal poverty level.[94]
For the 2010–2011 budget year, the Commonwealth of Pennsylvania provided a 2% increase in Basic Education Funding to Brockway Area School District for a total of $7,064,390. Among the districts in Jefferson County, the highest increase went to Brookville Area School District which got a 2.23% increase. One hundred fifty Pennsylvania school districts received the base 2% increase. The highest increase in Basic Education Funding in 2010–11 went to Kennett Consolidated School District in Chester County which received a 23.65% increase in state funding.[95] The state's hold harmless policy regarding state basic education funding continued where a district received at least the same amount as the year before, even where enrollment had significantly declined. The amount of increase each school district receives was set by Governor Edward G. Rendell and then Secretary of Education Gerald Zahorchak, as a part of the state budget proposal given each February. This was the second year of Governor Rendell's policy to fund some districts at a far greater rate than others.
In the 2009–10 budget year, the Commonwealth of Pennsylvania provided a 2.77% increase, in Basic Education Funding to Brockway Area School District, for a total of $6,925,873. Among the public school districts in Jefferson County, the highest increase went to Punxsutawney Area School District which got a 3.19%. The state Basic Education Funding provided to Brockway Area School District in 2008–09 was $6,739,340.28. Ninety school districts statewide received a base 2% increase. Muhlenberg School District in Berks County received a 22.31% increase in state basic education funding in 2009.[96] The amount of increase each school district receives was set by Governor Edward G. Rendell and the Secretary of Education Gerald Zahorchak, as a part of the state budget proposal.[97] According to the Pennsylvania Department of Education, 412 district students received free or reduced-price lunches due to low family income in the 2007–2008 school year.[98]
Accountability Block Grants
Beginning in 2004–2005, the state launched the Accountability Block Grant school funding. This program has provided $1.5 billion to Pennsylvania's school districts. The Accountability Block Grant program requires that its taxpayer dollars are focused on specific interventions that are most likely to increase student academic achievement. These interventions include: teacher training, all-day kindergarten, lower class size K-3rd grade, literacy and math coaching programs that provide teachers with individualized job-embedded professional development to improve their instruction, before or after school tutoring assistance to struggling students. For 2010–11, Brockway Area School District applied for and received $216,490 in addition to all other state and federal funding. The District used the funding to provide full-day kindergarten.[99][100]
Classrooms for the Future grant
The Classroom for the Future state program provided districts with hundreds of thousands of extra state funding to buy laptop computers for each core curriculum high school class (English, Science, History, Math) and paid for teacher training to optimize the computers use. The program was funded from 2006 to 2009. The Brockway Area School District did not apply to participate in 2006–07 or in 2007–08. The district received $83,715 in 2008–09.[101] In Jefferson County, the highest award, $807,235, was given to Punxsutawney Area School District. The highest funding statewide was awarded to Philadelphia City School District in Philadelphia County – $9,409,073.
Other grants
Brockway Area School District did not participate in the following grants: PA Department of Environmental Protection Environmental Education grants, Science Its Elementary grants, Striving Readers Comprehensive Literacy grant, nor the federal 21st Century Learning Grants and Safe Schools Target grant 2012.
Common Cents state initiative
Brockway Area School Board elected to not participate in the Pennsylvania Department of Education Common Cents program. The program called for the state to audit the district, at no cost to local taxpayers, to identify ways the district could save tax dollars.[102] After the review of the information, the district was not required to implement the recommended cost savings changes.
Federal Stimulus grant
The district received an extra $2,203,974 in ARRA – Federal Stimulus money to be used in specific programs like special education and meeting the academic needs of low-income students.[103] The funding was limited to the 2009–10 and 2010–2011 school years.[104] Due to the temporary nature of the funding, schools were repeatedly advised to use the funds for one-time expenditures like acquiring equipment, making repairs to buildings, training teachers to provide more effective instruction or purchasing books and software.
Race to the Top grant
District officials applied for the federal Race to the Top grant which would have provided over one million dollars in additional federal funding to improve student academic achievement.[105] Participation required the administration, the school board and the local teachers' union to sign an agreement to prioritize improving student academic success. In Pennsylvania, 120 public school districts and 56 charter schools agreed to participate.[106] Pennsylvania was not approved for the grant. The failure of districts to agree to participate was cited as one reason that Pennsylvania was not approved.[107][108][109]
Real estate taxes
Property tax rates in 2012–13 were set by the school board at 16.0000 mills in Jefferson County and mills in 20.8500 Elk County.[110] A mill is $1 of tax for every $1,000 of a property's assessed value. Property taxes, in the Commonwealth of Pennsylvania, apply only to real estate – land and buildings. The property tax is not levied on cars, business inventory, or other personal property. Certain types of property are exempt from property taxes, including: places of worship, places of burial, private social clubs, charitable and educational institutions and government property. Additionally, service related, disabled US military veterans may seek an exemption from paying property taxes. Pennsylvania school district revenues are dominated by two main sources: 1) Property tax collections, which account for the vast majority (between 75–85%) of local revenues; and 2) Act 511 tax collections, which are around 15% of revenues for school districts.[111] The school district includes municipalities in two counties, each of which has different rates of property tax assessment, necessitating a State board equalization of the tax rates between the counties.[112] In 2010, miscalculations by the State Tax Equalization Board were widespread in the Commonwealth and adversely impacted funding for many school districts.[113] Irregular property reassessments have become a serious issue in the commonwealth as it creates a significant disparity in taxation within a community and across a region.
- 2011-11 – 16.0000 mills in Jefferson County and 20.7700 mills in Elk County[114]
- 2010–11 – 16.0000 mills in Jefferson County and 21.1000 mills in Elk County[115]
- 2009–10 – 16.0000 mills in Jefferson County and 22.0000 mills in Elk County.[116]
- 2008–09 – 16.0000 mills in Jefferson County and 22.0000 mills in Elk County.[117]
- 2007–08 – 16.0000 mills in Jefferson County and 23.6000 mills in Elk County.[118]
- 2006–07 – 16.0000 mills in Jefferson County and 23.6000 mills in Elk County.[119]
- 2005–06 – 16.0000 mills in Jefferson County and 60.4000 mills in Elk County.[120]
According to a report prepared by the Pennsylvania Department of Education, the total real estate taxes collected by all school districts in Pennsylvania rose from $6,474,133,936 in 1999-00 to $10,438,463,356 in 2008–09 and to $11,153,412,490 in 2011.[121] The average yearly property tax paid by Jefferson County residents amounts to about 2.52% of their yearly income. Jefferson County is ranked 949th of the 3143 United States counties for property taxes as a percentage of median income. The average yearly property tax paid by Elk County residents amounts to about 2.89% of their yearly income. Elk County is ranked 668th for property taxes as a percentage of median income.[122]
Act 1 Adjusted Index
The Act 1 of 2006 Index regulates the rates at which each school district can raise property taxes in Pennsylvania. Districts are not allowed to raise taxes above that index unless they allow voters to vote by referendum, or they seek an exception from the state Department of Education. The base index for the 2011–2012 school year is 1.4 percent, but the Act 1 Index can be adjusted higher, depending on a number of factors, such as property values and the personal income of district residents. Act 1 included 10 exceptions, including: increasing pension costs, increases in special education costs, a catastrophe like a fire or flood, increase in health insurance costs for contracts in effect in 2006 or dwindling tax bases. The base index is the average of the percentage increase in the statewide average weekly wage, as determined by the PA Department of Labor and Industry, for the preceding calendar year and the percentage increase in the Employment Cost Index for Elementary and Secondary Schools, as determined by the Bureau of Labor Statistics in the U.S. Department of Labor, for the previous 12-month period ending June 30. For a school district with a market value/personal income aid ratio (MV/PI AR) greater than 0.4000, its index equals the base index multiplied by the sum of 0.75 and its MV/PI AR for the current year.[123] In June 2011, the Pennsylvania General Assembly eliminated six of the ten the exceptions to the Act 1 Index.[124] The following exceptions were maintained: 1) costs to pay interest and principal on indebtedness incurred prior to September 4, 2004 for Act 72 schools and prior to June 27, 2006 for non-Act 72 schools; 2) costs to pay interest and principal on electoral debt; 3) costs incurred in providing special education programs and services (beyond what is already paid by the State); and 4) costs due to increases of more than the Index in the school's share of payments to PSERS (PA school employees pension fund) taking into account the state mandated PSERS contribution rate.[125][126]
The School District Adjusted Index for the Brockway Area School District 2006–2007 through 2011–2012.[127]
|
|
For the 2012–13 budget year, Brockway Area School Board did not apply for exceptions to exceed the Act 1 Index. For 2012–2013, 274 school districts adopted a resolution certifying that tax rates would not be increased above their index; 223 school districts adopted a preliminary budget leaving open the option of exceeded the Index limit. For the exception for pension costs, 194 school districts received approval to exceed the Index. For special education costs, 129 districts received approval to exceed the tax limit.[129]
For the 2011–12 school year, the Brockway Area School Board did not apply for an exception to exceed the Act 1 Index. Each year, the Brockway Area School Board has the option of adopting either 1) a resolution in January certifying they will not increase taxes above their index or 2) a preliminary budget in February. A school district adopting the resolution may not apply for referendum exceptions or ask voters for a tax increase above the inflation index. A specific timeline for these decisions is published annually, by the Pennsylvania Department of Education.[130]
According to a state report, for the 2011–2012 school year budgets, 247 school districts adopted a resolution certifying that tax rates would not be increased above their index; 250 school districts adopted a preliminary budget. Of the 250 school districts that adopted a preliminary budget, 231 adopted real estate tax rates that exceeded their index. Tax rate increases in the other 19 school districts that adopted a preliminary budget did not exceed the school district's index. Of the districts who sought exceptions: 221 used the pension costs exemption and 171 sought a Special Education costs exemption. Only 1 school district sought an exemption for Nonacademic School Construction Project, while 1 sought an exception for Electoral debt for school construction.[131]
The Brockway Area School Board did not apply for any exceptions to exceed the Act 1 index for the budget in 2011.[132] For 2009–10 school budget, the board did not apply for exceptions to exceed the Index.[133] In the Spring of 2010, 135 Pennsylvania school boards asked to exceed their adjusted index. Approval was granted to 133 of them and 128 sought an exception for pension costs increases.[134]
Property tax relief
In 2010, the Homestead/Farmstead Property Tax Relief from gambling for the Brockway Area School District was $167 per approved permanent primary residence. In the district, 2,112 property owners applied for the tax relief.[135] The relief was subtracted from the total annual school property tax bill. Property owners apply for the relief through the county Treasurer's office. Farmers can qualify for a farmstead exemption on building used for agricultural purposes. The farm must be at least 10 contiguous acres (4.0 ha) and must be the primary residence of the owner. Farmers can qualify for both the homestead exemption and the farmstead exemption. In Jefferson County, 42% of eligible property owners applied for property tax relief in 2009.[136] In Jefferson County, the highest amount of tax relief in 2010, went to property owners in Brookville Area School District which was $206. The highest property tax relief in Pennsylvania went to the residents of Chester Upland School District of Delaware County who received $632 per approved homestead.[137] This was the third year they were the top recipient.
Additionally, the Pennsylvania Property Tax/Rent Rebate program is provided for low income Pennsylvanians aged 65 and older; widows and widowers aged 50 and older; and people with disabilities age 18 and older. The income limit is $35,000 for homeowners. The maximum rebate for both homeowners and renters is $650. Applicants can exclude one-half (1/2) of their Social Security income, consequently, individual with income much more than $35,000 may still qualify for a rebate. Individuals must apply annually for the rebate. This can be taken in addition to Homestead/Farmstead Property Tax Relief.[138]
Property taxes in Pennsylvania are relatively high on a national scale. According to the Tax Foundation, Pennsylvania ranked 11th in the U.S. in 2008 in terms of property taxes paid as a percentage of home value (1.34%) and 12th in the country in terms of property taxes as a percentage of income (3.55%).[139]
Extracurriculars
The district offers a variety of clubs, activities and interscholastic athletics. Eligibility for participation is determined by school board policy.
By Pennsylvania law, all K-12 students residing in the district, including those who attend a private nonpublic school, cyber charter school, charter school and those homeschooled, are eligible to participate in the extracurricular programs, including all athletics. They must meet the same eligibility rules as the students enrolled in the district's schools.[140]
Sports
The District funds:
|
|
- Junior high school sports
|
|
According to PIAA directory July 2012 [141]
References
- "Business Office". Brockway Area School District. Retrieved November 10, 2009.
- NCES, Common Core of Data – Brockway Area School District, 2012
- "Brockway Area Junior/Senior High School". publicschoolsreview.com. Retrieved December 22, 2008.
- WDSN-FM, Final Budget Proposed for Brockway School District, May 2012
- US Census Bureau, American Fact Finder, 2009
- US Census Bureau (2010). "American Fact Finder, State and County quick facts". Archived from the original on October 6, 2014. Retrieved March 25, 2012.
- US Census Bureau (September 2011). "Income, Poverty, and Health Insurance Coverage in the United States: 2010" (PDF).
- Pennsylvania Public School Code Governance 2010
- The Commonwealth Foundation for Public Policy Alternatives. "The Pennsylvania Project". Archived from the original on July 16, 2011. Retrieved May 20, 2010.
- "Guide to Pennsylvania Schools Statewide ranking". Pittsburgh Business Times. April 6, 2012. Archived from the original on October 16, 2012.
- "Statewide Honor Roll Rankings 2012". Pittsburgh Business Times. April 5, 2012. Archived from the original on October 23, 2012.
- "Statewide Honor Roll Rankings information 2011". Pittsburgh Business Times. April 4, 2011. Archived from the original on January 19, 2012.
- "Statewide Honor Roll Rankings 2010". Pittsburgh Business Times. April 30, 2010.
- "Three of top school districts in state hail from Allegheny County". Pittsburgh Business Times. May 23, 2007. Archived from the original on July 18, 2011.
- "Overachiever statewide ranking". Pittsburgh Business Times. April 4, 2011. Archived from the original on July 23, 2011.
- Pennsylvania Department of Education (September 29, 2012). "Brockway Area School District AYP Overview 2011". Archived from the original on February 29, 2012. Retrieved August 5, 2012.
- Pennsylvania Department of Education (September 29, 2011). "Brockway Area School District AYP Data Table". Archived from the original on March 4, 2016. Retrieved March 25, 2012.
- Pennsylvania Department of Education (March 15, 2011). "New 4-year Cohort Graduation Rate Calculation Now Being Implemented". Archived from the original on September 14, 2010.
- Pennsylvania Department of Education (2010). "Brockway Area School District Academic Achievement Report Card Data table". Archived from the original on March 4, 2016. Retrieved March 25, 2012.
- "PA School District Statistical Snapshot Database 2008–09". The Times-Tribune. June 27, 2010.
- "County School Districts Graduation Rates 2008". The Times-Tribune. June 25, 2009.
- Pennsylvania Partnerships for Children (2008). "High School Graduation rate 2007" (PDF). Archived from the original (PDF) on May 7, 2012. Retrieved March 25, 2012.
- National Center for Education Statistics – Common Care Data – Brockway Junior Senior High School, 2010
- Pennsylvania Department of Education (September 21, 2012). "Brockway Junior Senior High School Academic Achievement Report Card 2012". Archived from the original on February 29, 2012. Retrieved March 25, 2012.
- Pennsylvania Department of Education (September 29, 2012). "2011–2012 PSSA and AYP Results".
- Pennsylvania Department of Education (September 29, 2011). "2010–2011 PSSA and AYP Results".
- Pennsylvania Department of Education (2010). "2009–2010 PSSA and AYP Results".
- "Grading Our Schools database, 2009 PSSA results,". The Times-Tribune. September 14, 2009.
- Pennsylvania Department of Education (August 15, 2008). "2007–2008 PSSA and AYP Results".
- Pennsylvania Department of Education (2007). "PSSA Math and Reading results".
- "How is your school doing?". Pittsburgh Post Gazette. October 15, 2012.
- Pennsylvania Department of Education, Brockway Junior Senior High School Academic Achievement Report Card 2011, September 29, 2011
- Pennsylvania Department of Education (September 21, 2012). "Brockway Junior Senior High School Academic Achievement Report Card 2012" (PDF). Archived from the original (PDF) on March 4, 2016. Retrieved February 12, 2013.
- Pennsylvania Department of Education (September 29, 2011). "2010–2011 PSSA results in Science".
- "Grading Our Schools database, 2009 Science PSSA results". The Times-Tribune. 2009.
- Pennsylvania Department of Education (January 20, 2009). "Pennsylvania College Remediation Report,". Archived from the original on May 3, 2012.
- National Center for Education Statistics, IPEDS Integrated Postsecondary Education Data System, 2008
- Pennsylvania Department of Education (2010). "Dual Enrollment Guidelines".
- Commonwealth of Pennsylvania (March 2010). "Pennsylvania Transfer and Articulation Agreement".
- Brockway Area School District Administration, Program of Studies 2011–12, 2011
- Pennsylvania State Board of Education. "Pennsylvania Code §4.24 (a) High school graduation requirements".
- Pennsylvania Department of Education (2010). "Keystone Exam Overview" (PDF).
- Pennsylvania Department of Education (September 2011). "Pennsylvania Keystone Exams Overview". Archived from the original on March 17, 2012.
- Pennsylvania State Board of Education (2010). "Rules and Regulation Title 22 PA School Code CH. 4".
- Pennsylvania Department of Education (2011). "Keystone Exams".
- Pennsylvania Department of Education (2011). "Public School SAT Scores 2011". Archived from the original on October 15, 2011.
- "SAT Scores State By State – Pennsylvania". College Board. September 2011. Archived from the original on October 8, 2011.
- "While U.S. SAT scores dip across the board, N.J. test-takers hold steady". The Star-Ledger. September 2011.
- Pennsylvania Department of Education Report (August 2010). "Science PSSA 2010 by Schools".
- Pennsylvania Department of Education Report (August 2009). "Science PSSA 2009 by Schools".
- Pennsylvania Department of Education Report (August 15, 2008). "Science PSSA 2008 by Schools".
- National Center for Education Statistics, Common Core of data – Brockway Area Elementary School, 2010
- Pennsylvania Department of Education (September 21, 2012). "Brockway Area Elementary School AYP Overview 2012". Archived from the original on February 29, 2012. Retrieved March 25, 2012.
- Pennsylvania Department of Education (September 21, 2012). "Brockway Area Elementary School Academic Achievement Report Card 2012" (PDF).
- Pennsylvania Bureau of Special Education Services (2009–2010). "Brockway Area School District Special Education Data Report LEA Performance on State Performance Plan (SPP) Targets". Archived from the original on August 24, 2011.
- Pennsylvania Bureau of Special Education (2008). "Pennsylvania Parent Guide to Special Education Services".
- Pennsylvania Department of Education and Brockway Area School District Administration (January 6, 2011). "Child Find Procedural Safeguards Notice". Archived from the original on March 5, 2012. Retrieved March 25, 2012.
- Pennsylvania Department of Education, Bureau of Special Education (September 2005). "Gaskin Settlement Agreement Overview Facts Sheet" (PDF). Archived from the original (PDF) on October 20, 2007.
- Pennsylvania Department of Education. "Pennsylvania Special Education Funding".
- Senator Patrick Browne (November 1, 2011). "Senate Education Committee Holds Hearing on Special Education Funding & Accountability". Archived from the original on July 23, 2012.
- Pennsylvania Department of Education Amy Morton, Executive Deputy Secretary (November 11, 2011). "Public Hearing: Special Education Funding & Accountability Testimony". Archived from the original on April 22, 2012.
- Baruch Kintisch Education Law Center (November 11, 2011). "Public Hearing: Special Education Funding & Accountability Testimony" (PDF). Archived from the original (PDF) on April 22, 2012.
- Pennsylvania Department of Education (July 2010). "Special Education Funding from Pennsylvania State_2010-2011".
- Pennsylvania Department of Education (2011). "Special Education Funding 2011–2012 Fiscal Year".
- Pennsylvania Department of Education (December 1, 2009). "Gifted Students as Percentage of Total Enrollment by School District/Charter School" (PDF). Archived from the original (PDF) on March 4, 2016.
- Pennsylvania Department of Education and Pennsylvania School Board. "CHAPTER 16. Special Education For Gifted Students". Retrieved February 4, 2011.
- Pennsylvania Department of Education (March 26, 2010). "Special Education for Gifted Students Notice of Parental rights" (PDF). Archived from the original (PDF) on March 4, 2016.
- Pennsylvania DEpartment of Education, Enrollment and projections by LEA, July 20, 2010
- The Center for Rural Pennsylvania., "Research Analyzes Rural School District Enrollment and Building Capacity", October 2009
- Pennsylvania Legislative Budget and Finance Committee, Study of the Cost Effectiveness of Consolidating Pennsylvania School Districts, 2007.
- Rendell, E. & Soderberg, M. (2009). Pennsylvania school district consolidation. 2009–10 Executive Budget Fast Facts. Pennsylvania Office of the Governor.
- Study of the cost-effectiveness of consolidating Pennsylvania districts. New York: Standard & Poor's School Evaluation Services. 2007, p. 6.
- Pennsylvania Institute of Certified Public Accountants (January 2011). "Report of the Fiscal Responsibility Task Force" (PDF).
- Pennsylvania Department of Education (2012). "Investing in Pennsylvania Students".
- Asbury Park Press (2009). "PA. Public School Salaries". Archived from the original on July 21, 2012.
- "Brockway Area School District Teacher Union Employment Contract 2010–2015". Brockway Area School Board. Archived from the original on November 19, 2010.
- Fenton, Jacob, Average classroom teacher salary in Jefferson County, 2006–07, The Morning Call, March 2009
- PA Delaware County Times, Teachers need to know enough is enough, April 20, 2010.
- Fenton, Jacob. (February 2009). "Pennsylvania School District Data: Will School Consolidation Save Money?,". The Morning Call. Archived from the original on October 8, 2011.
- Pennsylvania School Board Association (October 2009). "Public School Salaries 11th Annual". Archived from the original on October 5, 2008.
- Pennsylvania Department of Education (2010). "2009–10 Selected Data – 2009–10 Total Expenditures per ADM".
- United States Census Bureau (2009). "States Ranked According to Per Pupil Elementary-Secondary Public School System Finance Amounts: 2008–09" (PDF).
- US Census Bureau (2009). "Total and current expenditures per pupil in fall enrollment in public elementary and secondary education, by function and state or jurisdiction: 2006–07".
- Pennsylvania Department of Education. "Fund Balances by Local Education Agency 1997 to 2008".
- Murphy, Jan., Pennsylvania's public schools boost reserves, CentreDaily Times, September 22, 2010
- Pennsylvania Auditor General (October 2010). "Brockway Area School District Jefferson County, Pennsylvania Performance Audit Report".
- Pennsylvania Department of Education (May 2012). "Pennsylvania Public School District Tuition Rates".
- Pennsylvania Department of Revenue (April 2010). "Personal Income Taxation Guidelines". Archived from the original on December 13, 2009.
- Senator Jake Corman (June 28, 2012). "Pennsylvania Education funding by Local School District" (PDF). Archived from the original (PDF) on July 30, 2012.
- PA Senate Appropriations Committee (June 28, 2011). "School District 2011–12 Funding Report". Archived from the original on September 10, 2013.
- Pennsylvania Department of Education (July 2011). "Basic Education Funding".
- Pennsylvania Department of Education (June 30, 2011). "Basic Education Funding".
- Pennsylvania Department of Education (June 30, 2011). "Basic Education Funding 2011–2012 Fiscal Year".
- Pennsylvania Department of Education, District Allocations Report 2009, 2009–10
- Pennsylvania House Appropriations Committee Education Budget information (June 30, 2010). "PA Basic Education Funding-Printout2 2010–2011" (PDF). Pittsburgh Post-Gazette.
- Pennsylvania Department of Education (October 2009). "Funding Allocations by district".
- Pennsylvania Office of Budget (February 2009). "Governor's Budget Proposal 2009 Pennsylvania Department of Education Budget Proposal 2009,". Archived from the original on December 24, 2009.
- Pennsylvania Department of Education, Funding Report by LEA, 2009
- Pennsylvania Department of Education (2010). "Accountability Block Grant report Grantee list 2010".
- Pennsylvania Department of Education (2008). "Accountability Block Grant Mid Year report".
- Pennsylvania Auditor General (December 22, 2008). "Classrooms for the Future grants audit" (PDF).
- Pennsylvania Department of Education (2007). "Common Cents program – Making Every Dollar Count".
- Commonwealth of Pennsylvania (2009). "Jefferson County ARRA FUNDING Report". Archived from the original on March 7, 2011.
- "School stimulus money". Pittsburgh Post-Gazette. March 12, 2009.
- Pennsylvania Department of Education (December 9, 2009). "Race to the Top Webinar powerpoint for districts December 2009" (PDF). Archived from the original (PDF) on July 4, 2013.
- Governor's Press Office release (January 20, 2010). "Pennsylvania's 'Race to the Top' Fueled by Effective Reforms, Strong Local Support,".
- Race to the Top Fund, U.S. Department of Education, March 29, 2010.
- Gerald Zahorchak (December 2008). "Pennsylvania Race to the Top Letter to Superintendents" (PDF).
- Pennsylvania Department of Education (January 19, 2009). "Pennsylvania Race to the Top -School Districts Title I Allocations 2009–10".
- Pennsylvania Department of Education (2012). "Real Estate Tax Rates by School District 2012–13 Real Estate Mills".
- Pennsylvania Department of Education (2004). "Act 511 Tax Report".
- "State Tax Equalization Board About US". State Tax Equalization Board. 2011. Archived from the original on November 14, 2012.
- Pennsylvania Auditor General office – Bureau of Audits (February 2011). "A Special Performance Audit of the Pennsylvania State Tax Equalization Boards" (PDF).
- Pennsylvania Department of Education, Real Estate Tax Millage by School District, 2011
- Pennsylvania Department of Education, Real Estate Tax Millage by School District, 2010
- Pennsylvania Department of Education, Real Estate Tax Millage by School District 2009–10, 2009
- Pennsylvania Department of Education, Real Estate Tax Millage by School District 2008–09, 2008
- Pennsylvania Department of Education, Real Estate Tax Millage by School District, 2007
- Pennsylvania Department of Education, Real Estate Tax Millage by School District, 2006
- Pennsylvania Department of Education, Real Estate Tax Millage by School District, 2005
- Pennsylvania Department of Education, Pennsylvania School Finances – Summaries of Annual Financial Report Data 2010–11, 2011
- Tax-rates.org., County Property Taxes 2012, 2012
- Pennsylvania Department of Education (2010). "2010–11 Act 1 of 2006 Referendum Exception Guidelines".
- Kaitlynn Riely (August 4, 2011). "Law could restrict school construction projects". Pittsburgh Post-Gazette.
- Pennsylvania General Assembly (June 29, 2011). "SB330 of 2011".
- Eric Boehm (July 1, 2011). "Property tax reform final piece of state budget". PA Independent. Archived from the original on July 4, 2011.
- Pennsylvania Department of Education (May 2010). "Special Session Act 1 of 2006 School District Adjusted Index for 2006–2007 through 2010–2011".
- Pennsylvania Department of Education (May 2011). "2012–2013 School District Adjusted Index Listing".
- Pennsylvania Department of Education, Report on Referendum Exceptions For School Year 2012–2013, March 30, 2012
- Pennsylvania Department of Education (2011). "Special Session Act 1 of 2006 the Taxpayer Relief Act information".
- Pennsylvania Department of Education (April 2011). "Report on Exceptions".
- Pennsylvania Department of Education (May 2010). "Report on Referendum Exceptions for 2010–2011".
- Pennsylvania Department of Education (May 2009). "Report on Referendum Exceptions for 2009–2010".
- Scarcella, Frank & Pursell, Tricia (May 25, 2010). "Local school tax assessments exceed state averages". The Daily Item.
- Pennsylvania Department of Education (May 1, 2010). "SSAct1_Property Tax Relief Per HomeStead 2010".
- Pennsylvania Auditor General Office (February 23, 2010). "Special Report Pennsylvania Property Tax Relief,".
- Tax Relief per Homestead 2009, Pennsylvania Department of Education Report May 1, 2010
- Commonwealth of Pennsylvania Department of Education (2006). "Property Tax/Rent Rebate Program".
- "New Census Data on Property Taxes on Homeowners". Tax Foundation. September 22, 2009. Archived from the original on September 6, 2011.
- Pennsylvania Office of the Governor Press Release (November 10, 2005). "Home-Schooled, Charter School Children Can Participate in School District Extracurricular Activities".
- Pennsylvania Interscholastic Athletics Association (2012). "PIAA School Directory".
External links
Elk County, Pennsylvania Schools | |||||||||||
|---|---|---|---|---|---|---|---|---|---|---|---|
| |||||||||||
| |||||||||||