Jefferson County, Pennsylvania
Jefferson County is a county located in the U.S. state of Pennsylvania. As of the 2010 census, the population was 45,200.[1] Its county seat is Brookville.[2] The county was established on March 26, 1804, from part of Lycoming County and later organized in 1830.[3] It is named for President Thomas Jefferson.[4] It is home to Punxsutawney Phil, the most famous groundhog that predicts when spring will come every February 2 (Groundhog Day).
Jefferson County | |
|---|---|
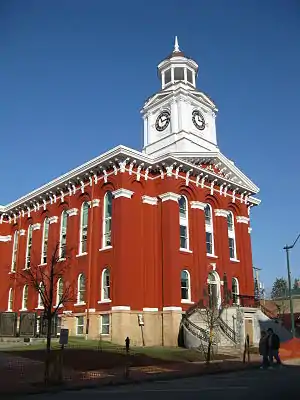 Jefferson County Courthouse | |
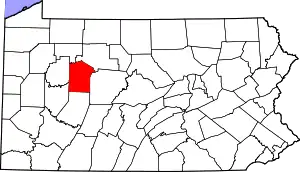 Location within the U.S. state of Pennsylvania | |
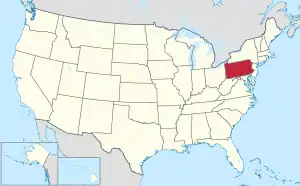 Pennsylvania's location within the U.S. | |
| Coordinates: 41°08′N 79°00′W | |
| Country | |
| State | |
| Founded | October 1, 1830 |
| Named for | Thomas Jefferson |
| Seat | Brookville |
| Largest borough | Punxsutawney |
| Area | |
| • Total | 657 sq mi (1,700 km2) |
| • Land | 652 sq mi (1,690 km2) |
| • Water | 4.4 sq mi (11 km2) 0.7%% |
| Population | |
| • Estimate (2018) | 43,641 |
| • Density | 68/sq mi (26/km2) |
| Time zone | UTC−5 (Eastern) |
| • Summer (DST) | UTC−4 (EDT) |
| Congressional district | 15th |
| Website | www |
Geography
According to the U.S. Census Bureau, the county has a total area of 657 square miles (1,700 km2), of which 652 square miles (1,690 km2) is land and 4.4 square miles (11 km2) (0.7%) is water.[5] It has a warm-summer humid continental climate (Dfb) and average monthly temperatures in Brookville range from 24.8 °F in January to 68.8 °F in July, while in Punxsutawney they range from 25.7 °F in January to 69.6 °F in July.
Adjacent counties
- Forest County (northwest)
- Elk County (northeast)
- Clearfield County (east)
- Indiana County (south)
- Armstrong County (southwest)
- Clarion County (west)
Major highways
Streams
There are many named streams flowing through Jefferson County, far too many to list here. An exhaustive list is presented in a separate article. All those streams eventually flow to the Allegheny River except for Bear Run, 1.36 square miles (3.5 km2), in the southeast which flows into the Susquehanna River. The principal streams and the area of their watersheds that lie within the county are:
- Clarion River: 130.50 square miles (338.0 km2)
- Little Toby Creek: 34.46 square miles (89.3 km2)
- Clear Creek: 20.12 square miles (52.1 km2)
- Cathers Run: 15.69 square miles (40.6 km2)
- Mill Creek: 30.70 square miles (79.5 km2)
- Redbank Creek: 375.52 square miles (972.6 km2)
- North Fork Creek: 91.63 square miles (237.3 km2)
- Clear Run: 9.79 square miles (25.4 km2)
- Pekin Run: 10.12 square miles (26.2 km2)
- Sandy Lick Creek: 143.98 square miles (372.9 km2)
- Wolf Run: 18.19 square miles (47.1 km2)
- Soldier Run: 11.09 square miles (28.7 km2)
- Trout Run: 10.74 square miles (27.8 km2)
- Mill Creek: 53.69 square miles (139.1 km2)
- Fivemile Run: 17.55 square miles (45.5 km2)
- Falls Creek: 11.39 square miles (29.5 km2)
- Little Sandy Creek: 70.65 square miles (183.0 km2)
- North Fork Creek: 91.63 square miles (237.3 km2)
- Mahoning Creek: 149.63 square miles (387.5 km2)
- East Branch Mahoning Creek: 15.27 square miles (39.5 km2)
- Stump Creek: 14.86 square miles (38.5 km2)
- Big Run: 19.41 square miles (50.3 km2)
- Canoe Creek: 11.57 square miles (30.0 km2)
- Elk Run: 13.20 square miles (34.2 km2)
- Pine Run: 18.88 square miles (48.9 km2)
Demographics
| Historical population | |||
|---|---|---|---|
| Census | Pop. | %± | |
| 1810 | 161 | — | |
| 1820 | 561 | 248.4% | |
| 1830 | 2,025 | 261.0% | |
| 1840 | 7,253 | 258.2% | |
| 1850 | 13,518 | 86.4% | |
| 1860 | 18,270 | 35.2% | |
| 1870 | 21,656 | 18.5% | |
| 1880 | 27,935 | 29.0% | |
| 1890 | 44,005 | 57.5% | |
| 1900 | 59,113 | 34.3% | |
| 1910 | 63,090 | 6.7% | |
| 1920 | 62,104 | −1.6% | |
| 1930 | 52,114 | −16.1% | |
| 1940 | 54,090 | 3.8% | |
| 1950 | 49,147 | −9.1% | |
| 1960 | 46,792 | −4.8% | |
| 1970 | 43,695 | −6.6% | |
| 1980 | 48,303 | 10.5% | |
| 1990 | 46,083 | −4.6% | |
| 2000 | 45,932 | −0.3% | |
| 2010 | 45,200 | −1.6% | |
| 2018 (est.) | 43,641 | [6] | −3.4% |
| U.S. Decennial Census[7] 1790-1960[8] 1900-1990[9] 1990-2000[10] 2010-2017[1] | |||
As of the census[11] of 2000, there were 45,932 people, 18,375 households, and 12,862 families residing in the county. The population density was 70 people per square mile (27/km2). There were 22,104 housing units at an average density of 34 per square mile (13/km2). The racial makeup of the county was 98.97% White, 0.13% Black or African American, 0.16% Native American, 0.21% Asian, 0.01% Pacific Islander, 0.07% from other races, and 0.45% from two or more races. 0.41% of the population were Hispanic or Latino of any race. 31.1% were of German, 13.4% Italian, 10.8% American, 9.2% Irish and 7.8% English ancestry.
There were 18,375 households, out of which 30.30% had children under the age of 18 living with them, 56.80% were married couples living together, 9.10% had a female householder with no husband present, and 30.00% were non-families. 26.60% of all households were made up of individuals, and 13.80% had someone living alone who was 65 years of age or older. The average household size was 2.45 and the average family size was 2.96.
In the county, the population was spread out, with 23.60% under the age of 18, 7.70% from 18 to 24, 27.20% from 25 to 44, 23.60% from 45 to 64, and 17.90% who were 65 years of age or older. The median age was 40 years. For every 100 females there were 95.70 males. For every 100 females age 18 and over, there were 92.60 males.
Law and government
Jefferson County is a very safe county for the Republican Party, which has won the vote of all but two presidential elections.
| Year | Republican | Democratic | Third parties |
|---|---|---|---|
| 2020 | 78.7% 17,960 | 19.8% 4,527 | 1.5% 337 |
| 2016 | 77.5% 15,192 | 18.6% 3,650 | 3.8% 753 |
| 2012 | 71.8% 13,048 | 26.3% 4,787 | 1.9% 343 |
| 2008 | 63.8% 12,057 | 34.1% 6,447 | 2.2% 408 |
| 2004 | 68.4% 13,371 | 31.1% 6,073 | 0.6% 116 |
| 2000 | 65.2% 11,473 | 31.7% 5,566 | 3.1% 547 |
| 1996 | 49.6% 8,156 | 35.5% 5,846 | 14.9% 2,455 |
| 1992 | 41.1% 7,271 | 33.9% 5,998 | 25.1% 4,442 |
| 1988 | 60.5% 9,743 | 38.7% 6,235 | 0.8% 131 |
| 1984 | 65.3% 11,334 | 34.3% 5,950 | 0.4% 71 |
| 1980 | 57.4% 9,628 | 37.5% 6,296 | 5.1% 854 |
| 1976 | 55.1% 9,437 | 43.5% 7,456 | 1.4% 237 |
| 1972 | 68.9% 11,631 | 29.8% 5,024 | 1.3% 221 |
| 1968 | 55.7% 10,214 | 37.3% 6,839 | 7.1% 1,294 |
| 1964 | 43.5% 8,373 | 56.3% 10,851 | 0.2% 37 |
| 1960 | 63.8% 13,845 | 36.0% 7,811 | 0.2% 38 |
| 1956 | 66.3% 13,051 | 33.6% 6,627 | 0.1% 19 |
| 1952 | 64.6% 11,833 | 34.8% 6,365 | 0.6% 116 |
| 1948 | 61.4% 9,395 | 36.8% 5,632 | 1.8% 268 |
| 1944 | 62.5% 10,970 | 36.6% 6,425 | 0.9% 152 |
| 1940 | 58.4% 12,081 | 41.4% 8,559 | 0.2% 47 |
| 1936 | 51.2% 11,943 | 47.5% 11,080 | 1.2% 283 |
| 1932 | 52.5% 8,246 | 41.8% 6,570 | 5.7% 897 |
| 1928 | 74.6% 13,233 | 24.4% 4,325 | 1.0% 173 |
| 1924 | 64.9% 10,673 | 16.2% 2,664 | 18.9% 3,113 |
| 1920 | 66.7% 7,970 | 25.6% 3,060 | 7.7% 920 |
| 1916 | 51.7% 4,332 | 38.9% 3,253 | 9.4% 788 |
| 1912 | 18.7% 1,608 | 29.1% 2,510 | 52.2% 4,504 |
| 1908 | 60.2% 5,652 | 31.8% 2,986 | 8.0% 755 |
| 1904 | 69.1% 5,860 | 24.7% 2,095 | 6.2% 527 |
| 1900 | 62.4% 5,950 | 32.1% 3,063 | 5.5% 525 |
| 1896 | 57.2% 5,500 | 38.2% 3,671 | 4.7% 448 |
| 1892 | 50.4% 4,100 | 40.0% 3,251 | 9.6% 782 |
| 1888 | 53.5% 4,090 | 42.6% 3,257 | 3.9% 301 |
County Commissioners
- John D. Matson (R)
- Herbert L. Bullers Jr.(R)
- Jeffrey E. Pisarcik (D)
State Senate[13]
State House of Representatives[13]
- Cris Dush, Republican, Pennsylvania's 66th Representative District
United States House of Representatives
United States Senate
Education
Colleges and universities
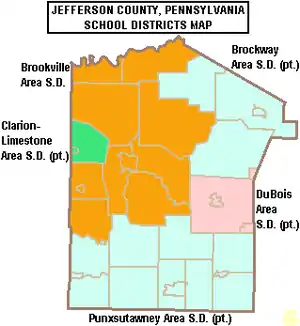
Public school districts
Related public entities
- Jefferson County-DuBois AVTS
- Riverview Intermediate Unit #6
Private schools
- Allens Mills School - Reynoldsville
- Bear Lane School - Punxsutawney
- Blose Hill Amish School - Reynoldsville
- Bucks Run - Reynoldsville
- Canoe Ridge Amish School - Rossiter
- Christ Dominion Academy
- Colonial Drake - Punxsutawney
- Eagles Nest Amish School - Brockway
- Highland Park - Punxsutawney
- Hillside School - Punxsutawney
- Lone Maple School - Punxsutawney
- Maple Grove School - Reynoldsville
- Mountain View School - Punxsutawney
- Munderf Amish School - Brockway
- Oak Grove Parochial School - Smicksburg
- Pine Valley Parochial School - Punxsutawney
- Playhouse Children's Center - Punxsutawney
- Praise Christian Academy - Reynoldsville
- Punxsutawney Christian Sch - Ele Level - Punxsutawney
- Spring Hollow Amish School - Reynoldsville
- Spring Run School - Smickburg
- Sts Cosmas & Damian School - Punxsutawney
- Trout Run School - Punxsutawney
- Valley View School - Punxsutawney
- West Creek Road Amish School - Punxsutawney
- Willow Drive School - Punxsutawney
- Windy Hollow Amish School - Mayport
Libraries
- Jefferson County Library System - Brockway
- Mengle Memorial Library - Brockway
- Punxsutawney Memorial Library - Punxsutawney
- Rebecca M Arthurs Memorial Library - Brookville
- Reynoldsville Public Library - Reynoldsville
- Summerville Public Library - Summerville
- Sykesville Public Library - Sykesville
Licensed entities
- Full Circle Inc Boys Home - Reynolds
- Jefferson County Adult Detention Center
- Western Pennsylvania School of Taxidermy - Oliveburg
Recreation
Two Pennsylvania state parks are in the county.
- Clear Creek State Park is in Barnett and Heath Townships.
- Cook Forest State Park is in Barnett Township and stretches into neighboring Clarion and Forest Counties
The Jefferson County Fair is held annually in July.
Communities
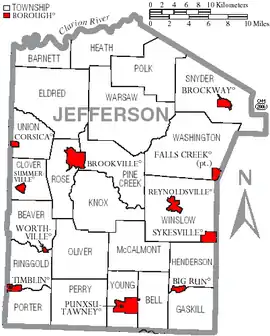
Under Pennsylvania law, there are four types of incorporated municipalities: cities, boroughs, townships, and, in at most two cases, towns. The following boroughs and townships are located in Jefferson County:
Boroughs
- Big Run
- Brockway
- Brookville (county seat)
- Corsica
- Falls Creek (partly in Clearfield County)
- Punxsutawney
- Reynoldsville
- Summerville
- Sykesville
- Timblin
- Worthville
Townships
Census-designated place
Unincorporated communities
- Adrian Mines
- Alaska
- Allens Mills
- Anita
- Baxter
- Beechtree
- Beechwoods
- Bells Mills
- Blowtown
- Bowersville
- Cloe
- Coal Glen
- Conifer
- Content
- Coolspring
- Cortez
- Desire
- Dora
- East Branch
- Ella
- Emerickville
- Fordham
- Frostburg
- Fuller
- Hamilton
- Hazen
- Heathville
- Horatio
- Howe
- Kahletown
- Knox Dale
- Lanes Mills
- Langville
- Markton
- McMinns Summit
- Munderf
- North Freedom
- Ohl
- Oliveburg
- Panic
- Pancoast
- Pansy
- Pardus
- Port Barnett
- Porter
- Prescottville
- Ramsaytown
- Rathmel
- Richardsville
- Ringgold
- Rockdale
- Roseville
- Sandy Valley
- Schoffner Corner
- Sigel
- Soldier
- Sprankle Mills
- Stanton
- Stump Creek
- Sugar Hill
- Valier
- Walston
- Warsaw
- Westville
- Winslow
- Wishaw
Population ranking
The population ranking of the following table is based on the 2010 census of Jefferson County.[14]
† county seat
| Rank | City/Town/etc. | Municipal type | Population (2010 Census) |
|---|---|---|---|
| 1 | Punxsutawney | Borough | 5,962 |
| 2 | † Brookville | Borough | 3,924 |
| 3 | Reynoldsville | Borough | 2,759 |
| 4 | Brockway | Borough | 2,072 |
| 5 | Sykesville | Borough | 1,157 |
| 6 | Falls Creek (partially in Clearfield County) | Borough | 1,037 |
| 7 | Big Run | Borough | 624 |
| 8 | Summerville | Borough | 528 |
| 9 | Crenshaw | CDP | 468 |
| 10 | Corsica | Borough | 357 |
| 11 | Timblin | Borough | 157 |
| 12 | Worthville | Borough | 67 |
Notable people
- John T. Morrison, sixth Governor of Idaho from 1903 until 1905; born in Jefferson County.[15]
- Sparky Lyle, professional baseball player
- Chuck Daly, American basketball head coach
- George Jenks, politician
- Florence Parry Heide, author
- Wilbur Good, professional baseball player
- Andy Hastings, professional football player
- Mal Eason, professional baseball player
- John Mizerock, professional baseball player
- Devin Mesoraco, professional baseball player
- Jim Pittsley, professional baseball player
- Britt Baker, professional wrestler and dentist
See also
References
- "State & County QuickFacts". United States Census Bureau. Archived from the original on June 6, 2011. Retrieved November 17, 2013.
- "Find a County". National Association of Counties. Archived from the original on 2011-05-31. Retrieved 2011-06-07.
- "Pennsylvania: Individual County Chronologies". Pennsylvania Atlas of Historical County Boundaries. The Newberry Library. 2008. Archived from the original on March 25, 2015. Retrieved March 12, 2015.
- Gannett, Henry (1905). The Origin of Certain Place Names in the United States. Govt. Print. Off. pp. 168.
- "2010 Census Gazetteer Files". United States Census Bureau. August 22, 2012. Retrieved March 8, 2015.
- "Population and Housing Unit Estimates". Retrieved October 10, 2018.
- "U.S. Decennial Census". United States Census Bureau. Retrieved March 8, 2015.
- "Historical Census Browser". University of Virginia Library. Archived from the original on August 11, 2012. Retrieved March 8, 2015.
- Forstall, Richard L., ed. (March 24, 1995). "Population of Counties by Decennial Census: 1900 to 1990". United States Census Bureau. Archived from the original on March 20, 2015. Retrieved March 8, 2015.
- "Census 2000 PHC-T-4. Ranking Tables for Counties: 1990 and 2000" (PDF). United States Census Bureau. April 2, 2001. Archived (PDF) from the original on December 18, 2014. Retrieved March 8, 2015.
- "U.S. Census website". United States Census Bureau. Retrieved 2008-01-31.
- Leip, David. "Dave Leip's Atlas of U.S. Presidential Elections". uselectionatlas.org. Archived from the original on 23 March 2018. Retrieved 7 May 2018.
- Center, Legislativate Data Processing. "Find Your Legislator". The official website for the Pennsylvania General Assembly. Archived from the original on 2017-05-06. Retrieved 2017-05-11.
- "2010 U.S. Census website". United States Census Bureau. Retrieved 2016-02-13.
- "Idaho Governor John T. Morrison". National Governors Association. Archived from the original on September 10, 2012. Retrieved September 19, 2012.
Municipalities and communities of Jefferson County, Pennsylvania, United States | ||
|---|---|---|
| Boroughs | | |
| Townships | ||
| CDP | ||
| Other unincorporated communities |
| |
| Footnotes | ‡This populated place also has portions in an adjacent county or counties | |
| ||
| Authority control |
|---|