Elk County, Pennsylvania
Elk County is a county in the U.S. state of Pennsylvania. As of the 2010 United States Census, the population was 31,946.[2] Its county seat is Ridgway.[3] The county was created on April 18, 1843, from parts of Jefferson, Clearfield and McKean Counties, and is named for the Eastern elk that historically inhabited the region.
Elk County | |
|---|---|
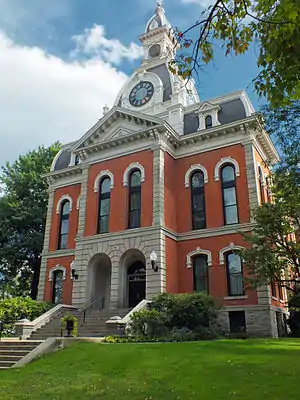 County courthouse in Ridgway | |
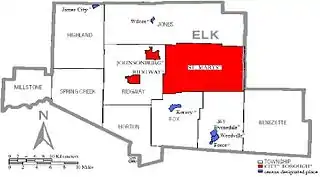
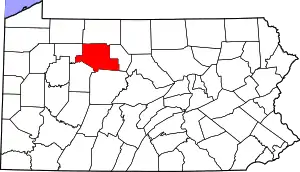 Location within the U.S. state of Pennsylvania | |
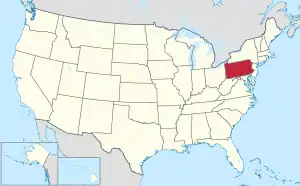 Pennsylvania's location within the U.S. | |
| Coordinates: 41°25′N 78°39′W | |
| Country | |
| State | |
| Founded | 18 April 1843 |
| Named for | Eastern elk |
| Seat | Ridgway |
| Largest city | St. Marys |
| Area | |
| • Total | 832 sq mi (2,150 km2) |
| • Land | 827 sq mi (2,140 km2) |
| • Water | 4.9 sq mi (13 km2) 0.6%% |
| Population | |
| • Estimate (2018) | 30,169[1] |
| • Density | 36.5/sq mi (14.1/km2) |
| Time zone | UTC−5 (Eastern) |
| • Summer (DST) | UTC−4 (EDT) |
| Congressional district | 15th |
| Website | www |
Geography
Elk County consists of low rolling hills, carved by frequent drainages and heavily wooded.
According to the United States Census Bureau, the county has a total area of 832 square miles (2,150 km2), of which 827 square miles (2,140 km2) is land and 4.9 square miles (13 km2) (0.6%) is water.[4] Elk has a warm-summer humid continental climate (Dfb) and average monthly temperatures in Ridgway range from 23.2 °F in January to 67.4 °F in July, while in Saint Marys they range from 22.6 °F in January to 66.8 °F in July.
Adjacent counties
- McKean County - north
- Cameron County - east
- Clearfield County - south
- Jefferson County - southwest
- Forest County - west
- Warren County - northwest
National protected area
- Allegheny National Forest (part)
State protected areas
Demographics
| Historical population | |||
|---|---|---|---|
| Census | Pop. | %± | |
| 1850 | 3,531 | — | |
| 1860 | 5,915 | 67.5% | |
| 1870 | 8,488 | 43.5% | |
| 1880 | 12,800 | 50.8% | |
| 1890 | 22,239 | 73.7% | |
| 1900 | 32,903 | 48.0% | |
| 1910 | 35,871 | 9.0% | |
| 1920 | 34,981 | −2.5% | |
| 1930 | 33,431 | −4.4% | |
| 1940 | 34,443 | 3.0% | |
| 1950 | 34,503 | 0.2% | |
| 1960 | 37,328 | 8.2% | |
| 1970 | 37,770 | 1.2% | |
| 1980 | 38,338 | 1.5% | |
| 1990 | 34,878 | −9.0% | |
| 2000 | 35,111 | 0.7% | |
| 2010 | 31,946 | −9.0% | |
| 2018 (est.) | 30,169 | [1] | −5.6% |
| US Decennial Census[5] 1790-1960[6] 1900-1990[7] 1990-2000[8] 2010-2017[2] | |||
As of the 2000 United States Census,[9] there were 35,112 people, 14,124 households, and 9,745 families in the county. The population density was 42/sqmi (16/km2). There were 18,115 housing units at an average density of 22/sqmi (8/km2). The racial makeup of the county was 98.96% White, 0.15% Black or African American, 0.09% Native American, 0.35% Asian, 0.04% Pacific Islander, 0.10% from other races, and 0.31% from two or more races. 0.40% of the population were Hispanic or Latino of any race. 54.4% were of German, 21.7% Italian, 16.5% Irish, 8.8% Polish, 7.6% American, 7.4% English, 6.3% Swedish, 3.6% French ancestry.
There were 14,124 households, out of which 31.00% had children under the age of 18 living with them, 56.00% were married couples living together, 8.70% had a female householder with no husband present, and 31.00% were non-families. 27.30% of all households were made up of individuals, and 13.60% had someone living alone who was 65 years of age or older. The average household size was 2.45 and the average family size was 2.99.
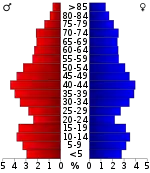
The county population contained 24.00% under the age of 18, 6.80% from 18 to 24, 28.60% from 25 to 44, 23.30% from 45 to 64, and 17.30% who were 65 years of age or older. The median age was 39 years. For every 100 females there were 98.00 males. For every 100 females age 18 and over, there were 95.30 males.
Politics and government
| Year | Republican | Democratic | Third parties |
|---|---|---|---|
| 2020 | 71.8% 12,140 | 26.7% 4,522 | 1.4% 244 |
| 2016 | 68.9% 10,025 | 26.5% 3,853 | 4.6% 669 |
| 2012 | 57.1% 7,579 | 41.1% 5,463 | 1.8% 237 |
| 2008 | 46.5% 6,676 | 50.8% 7,290 | 2.8% 396 |
| 2004 | 54.1% 7,872 | 45.4% 6,602 | 0.5% 76 |
| 2000 | 54.1% 7,347 | 42.4% 5,754 | 3.5% 479 |
| 1996 | 37.6% 4,889 | 44.2% 5,749 | 18.3% 2,375 |
| 1992 | 35.5% 4,908 | 36.3% 5,016 | 28.3% 3,908 |
| 1988 | 52.9% 6,737 | 46.1% 5,879 | 1.0% 128 |
| 1984 | 60.5% 8,470 | 39.2% 5,486 | 0.4% 51 |
| 1980 | 52.5% 7,175 | 43.2% 5,898 | 4.4% 596 |
| 1976 | 47.0% 6,159 | 51.2% 6,713 | 1.8% 237 |
| 1972 | 61.2% 7,900 | 36.5% 4,710 | 2.3% 298 |
| 1968 | 44.1% 6,193 | 49.0% 6,886 | 6.9% 967 |
| 1964 | 29.4% 4,354 | 70.5% 10,455 | 0.1% 19 |
| 1960 | 46.0% 7,155 | 54.0% 8,398 | 0.1% 14 |
| 1956 | 61.8% 8,947 | 38.0% 5,498 | 0.2% 23 |
| 1952 | 54.3% 7,702 | 45.4% 6,448 | 0.3% 45 |
| 1948 | 49.0% 5,148 | 51.0% 5,363 | |
| 1944 | 47.8% 5,645 | 51.6% 6,097 | 0.6% 67 |
| 1940 | 50.0% 6,949 | 49.8% 6,920 | 0.2% 31 |
| 1936 | 35.1% 5,489 | 57.8% 9,035 | 7.1% 1,107 |
| 1932 | 46.4% 5,797 | 51.7% 6,461 | 1.9% 239 |
| 1928 | 40.2% 5,234 | 59.2% 7,705 | 0.5% 70 |
| 1924 | 70.9% 6,626 | 14.7% 1,370 | 14.5% 1,356 |
| 1920 | 66.1% 5,267 | 26.3% 2,093 | 7.6% 604 |
| 1916 | 52.3% 2,829 | 40.4% 2,186 | 7.2% 390 |
| 1912 | 10.5% 603 | 35.8% 2,057 | 53.7% 3,082 |
| 1908 | 51.5% 2,991 | 43.6% 2,531 | 4.9% 283 |
| 1904 | 55.3% 3,820 | 41.3% 2,857 | 3.4% 237 |
| 1900 | 50.1% 3,254 | 47.8% 3,105 | 2.2% 141 |
| 1896 | 49.6% 2,807 | 48.0% 2,717 | 2.5% 139 |
| 1892 | 38.9% 1,438 | 57.6% 2,126 | 3.5% 129 |
| 1888 | 41.1% 1,321 | 56.7% 1,824 | 2.2% 70 |
As of January 2021, there were 20,169 registered voters in Elk County.[11]
- Democratic: 7,351 (36.45%)
- Republican: 10,527 (52.19%)
- Other parties: 2,291 (11.36%)
Elk County tended to be politically competitive in statewide and national elections, but has recently become a solid Republican county like most of rural Pennsylvania. The county was carried by George W. Bush in 2000 and 2004. The county was carried by Barack Obama in 2008 and by Mitt Romney in 2012 over Obama's victorious ticket. Like most other rural counties, both in Pennsylvania and nationwide, Donald Trump strongly won the county in 2016 and 2020 -- increasing his margin in the latter.
The county has frequently voted with the eventual winner of national elections, from 1920 to 2008, except for 1928 when Al Smith carried the county with nearly 60% of the vote over winner Herbert Hoover, 1940 when Wendell Willkie carried the county with a very slim margin of 29 votes over incumbent Franklin D. Roosevelt, and in 1968, when Hubert Humphrey won it over eventual winner Richard Nixon.
The three state row offices winners also carried Elk and Democratic incumbent State Representative Dan Surra lost after nine terms to Republican Matt Gabler in 2008.
County commissioners
- Joseph Daghir, Republican
- M. Fritz Lecker, Republican
- Matthew G. Quesenberry, Democrat
Other county offices
- Clerk of Courts and Prothonotary, Susanne Schneider, Republican
- Coroner, Michelle Muccio, Republican
- District Attorney, Shawn McMahon,
- Register of Wills and Recorder of Deeds, Pete Weidenboerner, Democrat
- Sheriff, Todd Caltagarone, Republican
- Treasurer, Peggy Schneider, Democrat
State representative[13]
- Mike Armanini, Republican, 75th district
State senator[13]
- Cris Dush, Republican, 25th district
U.S. representative
- Glenn "G.T." Thompson, Republican, 15th district
Education
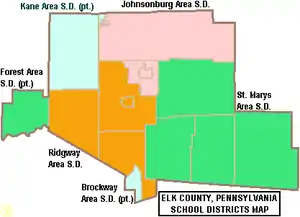
Public school districts
- Brockway Area School District
- Forest Area School District
- Kane Area School District
- Johnsonburg Area School District
- Ridgway Area School District
- Saint Marys Area School District
All children living in the Commonwealth of Pennsylvania may also choose to attend one of 12 state-licensed public cyber charter schools.
Children in Elk County are also served by Seneca Highlands Intermediate Unit Nine, in Saint Marys. The IU serves all schools (public, private, charter) in Cameron County, Elk County, McKean County and Potter County. IU9 serves 15,761 public school students in fourteen school districts and 1,673 non-public school students in nineteen schools. Intermediate Unit Nine covers 3,300 square miles with a population of 105,102.
Private schools
- Elk County Catholic High School
- St Boniface School - Kersey
- St Leo School - Ridgway
- St Marys Catholic Elementary School = Saint Marys
- St Marys Catholic Middle School = Saint Marys
- North Central Workforce Investment Board - Ridgway
- Anne Forbes Nursery School - Ridgway
Libraries
- Elk County Library System - Saint Marys
- Johnsonburg Public Library - Johnsonburg
- Ridgway Free Public Library - Ridgway
- Saint Marys Public Library - Saint Marys
- Tri State Coll Library Co-Op - Rosemont
- Wilcox Public Library - Wilcox
Communities
Under Pennsylvania law, there are four types of incorporated municipalities: cities, boroughs, townships, and, in at most two cases, towns. The following cities, boroughs, and townships are located in Elk County:
City
Boroughs
- Johnsonburg
- Ridgway (county seat)
Unincorporated communities
- Arroyo
- Dagus Mines
- Loleta
- Portland Mills[14]
Population ranking
The population ranking of the following table is based on the 2010 census of Elk County.[15]
† county seat
| Rank | City/Town/etc. | Municipal type | Population (2010 Census) |
|---|---|---|---|
| 1 | St. Marys | City | 13,070 |
| 2 | † Ridgway | Borough | 4,078 |
| 3 | Johnsonburg | Borough | 2,483 |
| 4 | Kersey | CDP | 937 |
| 5 | Weedville | CDP | 542 |
| 6 | Byrnedale | CDP | 427 |
| 7 | Wilcox | CDP | 383 |
| 8 | James City | CDP | 287 |
| 9 | Force | CDP | 253 |
References
- "Population and Housing Unit Estimates". Retrieved June 9, 2017.
- "State & County QuickFacts". US Census Bureau. Archived from the original on June 6, 2011. Retrieved November 16, 2013.
- "Find a County". National Association of Counties. Archived from the original on 31 May 2011. Retrieved 7 June 2011.
- "2010 Census Gazetteer Files". US Census Bureau. August 22, 2012. Retrieved March 5, 2015.
- "US Decennial Census". US Census Bureau. Retrieved March 5, 2015.
- "Historical Census Browser". University of Virginia Library. Retrieved March 5, 2015.
- Forstall, Richard L., ed. (March 24, 1995). "Population of Counties by Decennial Census: 1900 to 1990". US Census Bureau. Retrieved March 5, 2015.
- "Census 2000 PHC-T-4. Ranking Tables for Counties: 1990 and 2000" (PDF). US Census Bureau. April 2, 2001. Retrieved March 5, 2015.
- "U.S. Census website". US Census Bureau. Retrieved January 31, 2008.
- Leip, David. "Atlas of US Presidential Elections". uselectionatlas.org. Retrieved 25 November 2018.
- https://www.co.elk.pa.us/index.php/government/local-government/county-offices/item/282-meet-the-commissioners
- Center, Legislativate Data Processing. "Find Your Legislator". The official website for the Pennsylvania General Assembly. Retrieved 11 May 2017.
- Portland Mills PA (Google Maps - accessed 11 November 2019)
- "2010 U.S. Census website". United States Census Bureau. Retrieved 10 February 2013.
Municipalities and communities of Elk County, Pennsylvania, United States | ||
|---|---|---|
| City | | |
| Boroughs | ||
| Townships | ||
| CDPs | ||
| Unincorporated communities | ||
| ||
| Authority control |
|---|