California's 24th congressional district
California's 24th congressional district is a congressional district in the U.S. state of California. The district is currently represented by Salud Carbajal. It contains all of Santa Barbara and San Luis Obispo counties and part of Ventura County.
| California's 24th congressional district | |||
|---|---|---|---|
.tif.png.webp) California's 24th congressional district since January 3, 2013 | |||
| Representative |
| ||
| Population (2019) | 737,443 | ||
| Median household income | $76,308[1] | ||
| Ethnicity | |||
| Cook PVI | D+7[3] | ||
Prior to redistricting in 2011, the district covered the inland portions of Ventura and Santa Barbara counties, as well as a sparsely-populated portion of the Ventura County coast.
Results in statewide elections
| Year | Office | Results |
|---|---|---|
| 1992 | President | Clinton 48–30% |
| Senator | Boxer 50–43% | |
| Senator | Feinstein 57–37% | |
| 1994 | Governor | [data unknown/missing] |
| Senator | [data unknown/missing] | |
| 1996 | President | [data unknown/missing] |
| 1998 | Governor | [data unknown/missing] |
| Senator | [data unknown/missing] | |
| 2000 | President[4] | Gore 57–38% |
| Senator[5] | Feinstein 59–35% | |
| 2002 | Governor[6] | Simon 52–39% |
| 2003 | Recall[7][8] | Yes 67–33% |
| Schwarzenegger 55–20% | ||
| 2004 | President[9] | Bush 56–43% |
| Senator[10] | Jones 48–47% | |
| 2006 | Governor[11] | Schwarzenegger 66–30% |
| Senator[12] | Feinstein 49–46% | |
| 2008 | President[13] | Obama 52–46% |
| 2010 | Governor | Whitman 54–41% |
| Senator | Fiorina 55–40% | |
| 2012 | President[14] | Obama 54–43% |
| Senator | Feinstein 56–44% | |
| 2014 | Governor | Brown 57–43% |
| 2016 | President | Clinton 57–37% |
| Senator | Harris 62–38% | |
| 2018 | Governor | Newsom 57–43% |
| Senator | Feinstein 53–47% | |
| 2020 | President | Biden 61–37% |
List of members representing the district

.tif.png.webp)
Election results
|
1952 • 1953 (Special) • 1954 • 1956 • 1958 • 1960 • 1962 • 1964 • 1966 • 1968 • 1970 (Special) • 1970 • 1972 • 1974 • 1976 • 1978 • 1980 • 1982 • 1984 • 1986 • 1988 • 1990 • 1992 • 1994 • 1996 • 1998 • 2000 • 2002 • 2004 • 2006 • 2008 • 2010 • 2012 • 2014 • 2016 • 2018 • 2020 |
1952
| Party | Candidate | Votes | % | |
|---|---|---|---|---|
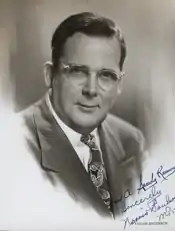
| Republican | Norris Poulson (incumbent) | 119,799 | 87.4 | |
| Progressive | Bertram L. Sharp | 17,307 | 12.6 | |
| Total votes | 137,106 | 100.0 | ||
| Turnout | ||||
| Republican hold | ||||
1953 (Special)
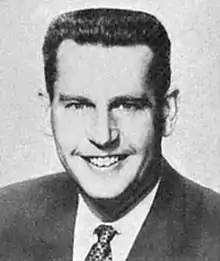
Republican Glenard P. Lipscomb won the special election to replace fellow Republican Norris Poulson, who was elected Mayor of Los Angeles. Data for this special election is not available.[16]
1954
| Party | Candidate | Votes | % | |
|---|---|---|---|---|
| Republican | Glenard P. Lipscomb (inc.) | 65,431 | 56.9 | |
| Democratic | George Arnold | 49,592 | 43.1 | |
| Total votes | 115,023 | 100.0 | ||
| Turnout | ||||
| Republican hold | ||||
1956
| Party | Candidate | Votes | % | |
|---|---|---|---|---|
| Republican | Glenard P. Lipscomb (inc.) | 84,120 | 61.9 | |
| Democratic | Fay Porter | 51,692 | 38.1 | |
| Total votes | 135,812 | 100.0 | ||
| Turnout | ||||
| Republican hold | ||||
1958
| Party | Candidate | Votes | % | |
|---|---|---|---|---|
| Republican | Glenard P. Lipscomb (inc.) | 68,184 | 56.4 | |
| Democratic | William H. Ware, Jr. | 52,804 | 43.6 | |
| Total votes | 120,988 | 100.0 | ||
| Turnout | ||||
| Republican hold | ||||
1960
| Party | Candidate | Votes | % | |
|---|---|---|---|---|
| Republican | Glenard P. Lipscomb (inc.) | 82,497 | 59.7 | |
| Democratic | Norman Hass | 55,613 | 40.3 | |
| Total votes | 138,110 | 100.0 | ||
| Turnout | ||||
| Republican hold | ||||
1962
| Party | Candidate | Votes | % | |
|---|---|---|---|---|
| Republican | Glenard P. Lipscomb (inc.) | 120,884 | 70.3 | |
| Democratic | Knox Mellon | 50,970 | 29.7 | |
| Total votes | 171,854 | 100.0 | ||
| Turnout | ||||
| Republican hold | ||||
1964
| Party | Candidate | Votes | % | |
|---|---|---|---|---|
| Republican | Glenard P. Lipscomb (inc.) | 139,784 | 67.9 | |
| Democratic | Bryan W. Stevens | 65,967 | 32.1 | |
| Total votes | 205,751 | 100.0 | ||
| Turnout | ||||
| Republican hold | ||||
1966
| Party | Candidate | Votes | % | |
|---|---|---|---|---|
| Republican | Glenard P. Lipscomb (inc.) | 148,190 | 76.3 | |
| Democratic | Fred Warner Neal | 46,115 | 23.7 | |
| Total votes | 194,305 | 100.0 | ||
| Turnout | ||||
| Republican hold | ||||
1968
| Party | Candidate | Votes | % | |
|---|---|---|---|---|
| Republican | Glenard P. Lipscomb (inc.) | 152,180 | 72.8 | |
| Democratic | Fred Warner Neal | 56,723 | 27.2 | |
| Total votes | 208,903 | |||
| Republican hold | ||||
1970 (Special)
| Party | Candidate | Votes | % | |
|---|---|---|---|---|
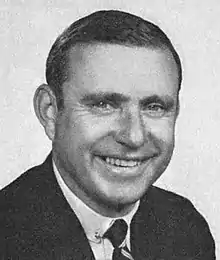
| Republican | John H. Rousselot | 62,749 | 68.2 | |
| Democratic | Myrlie B. Evers | 29,248 | 31.8 | |
| Total votes | 91,997 | 100.0 | ||
| Turnout | ||||
| Republican hold | ||||
1970
| Party | Candidate | Votes | % | |
|---|---|---|---|---|
| Republican | John H. Rousselot (inc.) | 124,071 | 65.1 | |
| Democratic | Myrlie B. Evers | 61,777 | 32.4 | |
| American Independent | Brian Scanlon | 3,018 | 1.6 | |
| Peace and Freedom | Harold Kaplan | 1,858 | 1.0 | |
| Total votes | 190,724 | 100.0 | ||
| Turnout | ||||
| Republican hold | ||||
1972
| Party | Candidate | Votes | % | |
|---|---|---|---|---|
| Republican | John H. Rousselot (inc.) | 141,274 | 70.1 | |
| Democratic | Luther Mandell | 60,170 | 29.9 | |
| Total votes | 201,444 | |||
| Republican hold | ||||
1974
| Party | Candidate | Votes | % | |
|---|---|---|---|---|
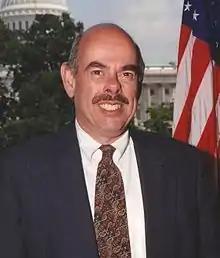
| Democratic | Henry Waxman | 85,343 | 64.0 | |
| Republican | Elliott Stone Graham | 43,680 | 33.0 | |
| American Independent | David E. Davis | 3,980 | 3.0 | |
| Total votes | 133,003 | 100.0 | ||
| Turnout | ||||
| Democratic hold | ||||
1976
| Party | Candidate | Votes | % | |
|---|---|---|---|---|
| Democratic | Henry Waxman (incumbent) | 108,296 | 67.8 | |
| Republican | David Irvins Simmons | 51,478 | 32.2 | |
| Total votes | 159,774 | 100.0 | ||
| Turnout | ||||
| Democratic hold | ||||
1978
| Party | Candidate | Votes | % | |
|---|---|---|---|---|
| Democratic | Henry Waxman (incumbent) | 85,075 | 62.7 | |
| Republican | Howard G. Schaefer | 44,243 | 32.6 | |
| Peace and Freedom | Kevin Casey Peters | 6,453 | 4.8 | |
| Total votes | 135,771 | 100.0 | ||
| Turnout | ||||
| Democratic hold | ||||
1980
| Party | Candidate | Votes | % | |
|---|---|---|---|---|
| Democratic | Henry Waxman (incumbent) | 93,569 | 63.8 | |
| Republican | Roland Cayard | 39,744 | 27.1 | |
| Peace and Freedom | Margaret "Maggie" Feigin | 5,905 | 4.0 | |
| Libertarian | Robert E. Lehman | 5,172 | 3.5 | |
| American Independent | Jack Smilowitz | 2,341 | 1.6 | |
| Total votes | 146,731 | 100.0 | ||
| Turnout | ||||
| Democratic hold | ||||
1982
| Party | Candidate | Votes | % | |
|---|---|---|---|---|
| Democratic | Henry Waxman (incumbent) | 88,516 | 65.1 | |
| Republican | Jerry Zerg | 42,133 | 31.0 | |
| Libertarian | Jeff Mandel | 5,420 | 1.8 | |
| Total votes | 136,069 | 100.0 | ||
| Turnout | ||||
| Democratic hold | ||||
1984
| Party | Candidate | Votes | % | |
|---|---|---|---|---|
| Democratic | Henry Waxman (incumbent) | 97,340 | 63.4 | |
| Republican | Jerry Zerg | 51,010 | 33.2 | |
| Peace and Freedom | James Green | 2,780 | 1.8 | |
| Libertarian | Tim Custer | 2,477 | 1.6 | |
| Total votes | 153,607 | 100.0 | ||
| Turnout | ||||
| Democratic hold | ||||
1986
| Party | Candidate | Votes | % | |
|---|---|---|---|---|
| Democratic | Henry Waxman (incumbent) | 103,914 | 87.9 | |
| Libertarian | George Abrahams | 8,871 | 7.5 | |
| Peace and Freedom | James Green | 5,388 | 4.6 | |
| Total votes | 118,173 | 100.0 | ||
| Turnout | ||||
| Democratic hold | ||||
1988
| Party | Candidate | Votes | % | |
|---|---|---|---|---|
| Democratic | Henry Waxman (incumbent) | 112,038 | 72.2 | |
| Republican | John N. Cowles | 36,835 | 23.8 | |
| Peace and Freedom | James Green | 3,571 | 2.3 | |
| Libertarian | George Abrahams | 2,627 | 1.7 | |
| Total votes | 155,071 | 100.0 | ||
| Turnout | ||||
| Democratic hold | ||||
1990
| Party | Candidate | Votes | % | |
|---|---|---|---|---|
| Democratic | Henry Waxman (incumbent) | 71,562 | 68.9 | |
| Republican | John N. Cowles | 26,607 | 25.6 | |
| Peace and Freedom | Maggie Phair | 5,706 | 5.5 | |
| Total votes | 103,875 | 100.0 | ||
| Turnout | ||||
| Democratic hold | ||||
1992
| Party | Candidate | Votes | % | |
|---|---|---|---|---|
| Democratic | Anthony C. Beilenson (inc.) | 141,742 | 55.5 | |
| Republican | Tom McClintock | 99,835 | 39.1 | |
| Peace and Freedom | John Paul Lindblad | 13,690 | 5.4 | |
| Total votes | 255,267 | 100.0 | ||
| Turnout | ||||
| Democratic hold | ||||
1994
| Party | Candidate | Votes | % | |
|---|---|---|---|---|
| Democratic | Anthony C. Beilenson (inc.) | 95,342 | 49.35 | |
| Republican | Rich Sybert | 91,806 | 47.52 | |
| Libertarian | John C. Koehler | 6,031 | 3.12 | |
| Total votes | 193,179 | 100.0 | ||
| Turnout | ||||
| Democratic hold | ||||
1996
| Party | Candidate | Votes | % | |
|---|---|---|---|---|
| Democratic | Brad Sherman | 106,193 | 49.5 | |
| Republican | Rich Sybert | 93,629 | 43.6 | |
| Peace and Freedom | Ralph Shroyer | 6,267 | 2.9 | |
| Libertarian | Erich Miller | 5,691 | 2.6 | |
| Natural Law | Ron Lawrence | 3,068 | 1.4 | |
| Total votes | 214,848 | 100.0 | ||
| Turnout | ||||
| Democratic hold | ||||
1998
| Party | Candidate | Votes | % | |
|---|---|---|---|---|
| Democratic | Brad Sherman (incumbent) | 103,491 | 57.31 | |
| Republican | Randy Hoffman | 69,501 | 38.49 | |
| Natural Law | Catherine Carter | 3,033 | 1.68 | |
| Libertarian | Erich D. Miller | 2,695 | 1.49 | |
| Peace and Freedom | Ralph Shroyer | 1,860 | 1.03 | |
| Total votes | 180,580 | 100.0 | ||
| Turnout | ||||
| Democratic hold | ||||
2000
| Party | Candidate | Votes | % | |
|---|---|---|---|---|
| Democratic | Brad Sherman (incumbent) | 155,398 | 66.1 | |
| Republican | Jerry Doyle | 70,169 | 29.8 | |
| Libertarian | Juan Carlos Ros | 6,966 | 2.9 | |
| Natural Law | Michael Cuddehe | 2,911 | 1.2 | |
| Total votes | 235,444 | 100.0 | ||
| Turnout | ||||
| Democratic hold | ||||
2002
| Party | Candidate | Votes | % | |
|---|---|---|---|---|
| Republican | Elton Gallegly (incumbent) | 120,585 | 65.2 | |
| Democratic | Fern Rudin | 58,755 | 31.8 | |
| Libertarian | Gary Harber | 5,666 | 3.0 | |
| Total votes | 185,006 | 100.0 | ||
| Turnout | ||||
| Republican hold | ||||
2004
| Party | Candidate | Votes | % | |
|---|---|---|---|---|
| Republican | Elton Gallegly (incumbent) | 178,660 | 62.9 | |
| Democratic | Brett Wagner | 96,397 | 33.9 | |
| Green | Stuart A. Bechman | 9,321 | 3.2 | |
| Total votes | 284,378 | 100.0 | ||
| Turnout | ||||
| Republican hold | ||||
2006
| Party | Candidate | Votes | % | |
|---|---|---|---|---|
| Republican | Elton Gallegly (incumbent) | 129,812 | 62.1 | |
| Democratic | Jill M. Martinez | 79,461 | 37.9 | |
| No party | Michael Kurt Stettler (write-in) | 16 | 0.0 | |
| No party | Henry Nicolle (write-in) | 3 | 0.0 | |
| Total votes | 209,292 | 100.0 | ||
| Turnout | ||||
| Republican hold | ||||
2008
| Party | Candidate | Votes | % | |
|---|---|---|---|---|
| Republican | Elton Gallegly (incumbent) | 174,492 | 58.20 | |
| Democratic | Marta Ann Jorgensen | 125,560 | 41.80 | |
| Turnout | ||||
| Republican hold | ||||
2010
| Party | Candidate | Votes | % | |
|---|---|---|---|---|
| Republican | Elton Gallegly (incumbent) | 144,055 | 59.94 | |
| Democratic | Timothy J. Allison | 96,279 | 40.06 | |
| Turnout | ||||
| Republican hold | ||||
2012
| Primary election | ||||
|---|---|---|---|---|
| Party | Candidate | Votes | % | |
| Democratic | Lois Capps (incumbent) | 72,356 | 46.4 | |
| Republican | Abel Maldonado | 46,295 | 29.7 | |
| Republican | Chris Mitchum | 33,604 | 21.5 | |
| No party preference | Matt Boutté | 3,832 | 2.5 | |
| Total votes | 156,087 | 100.0 | ||
| General election | ||||
| Democratic | Lois Capps (incumbent) | 156,749 | 55.1 | |
| Republican | Abel Maldonado | 127,746 | 44.9 | |
| Total votes | 284,495 | 100.0 | ||
| Democratic hold | ||||
2014
| Primary election | ||||
|---|---|---|---|---|
| Party | Candidate | Votes | % | |
| Democratic | Lois Capps (incumbent) | 45,482 | 44.5 | |
| Republican | Christopher Mitchum | 15,927 | 15.6 | |
| Republican | Justin Donald Fareed | 15,013 | 14.7 | |
| Republican | Dale Francisco | 12,256 | 12.0 | |
| Republican | Bradley Allen | 6,573 | 6.4 | |
| Democratic | Sandra J. Marshall-Eminger | 3,675 | 3.6 | |
| Democratic | Paul H. Coyne, Jr. | 1,753 | 1.7 | |
| No party preference | Steve Isakson | 947 | 0.9 | |
| Republican | Alexis Stuart | 527 | 0.5 | |
| Total votes | 102,153 | 100.00 | ||
| General election | ||||
| Democratic | Lois Capps (incumbent) | 103,228 | 52% | |
| Republican | Christopher Mitchum | 95,566 | 48% | |
| Total votes | 198,794 | 100% | ||
| Democratic hold | ||||
2016
| Primary election | ||||
|---|---|---|---|---|
| Party | Candidate | Votes | % | |
| Democratic | Salud Carbajal | 66,402 | 31.9 | |
| Republican | Justin Fareed | 42,521 | 20.5 | |
| Republican | Katcho Achadjian | 37,716 | 18.1 | |
| Democratic | Helene Schneider | 31,046 | 14.9 | |
| Democratic | William "Bill" Ostrander | 12,657 | 6.1 | |
| Republican | Matt T. Kokkonen | 11,636 | 5.6 | |
| No party preference | John Uebersax | 2,188 | 1.1 | |
| No party preference | Steve Isakson | 2,172 | 1.0 | |
| Democratic | Benjamin Lucas | 1,568 | 0.8 | |
| Total votes | 207,906 | 100.0 | ||
| General election | ||||
| Democratic | Salud Carbajal | 166,034 | 53.4 | |
| Republican | Justin Fareed | 144,780 | 46.6 | |
| Total votes | 310,814 | 100.0 | ||
| Democratic hold | ||||
2018
| Primary election | ||||
|---|---|---|---|---|
| Party | Candidate | Votes | % | |
| Democratic | Salud Carbajal (incumbent) | 94,558 | 53.6 | |
| Republican | Justin Fareed | 64,177 | 36.4 | |
| Republican | Michael E. Woody | 17,715 | 10.0 | |
| General election | ||||
| Democratic | Salud Carbajal (incumbent) | 166,550 | 58.6 | |
| Republican | Justin Fareed | 117,881 | 41.4 | |
| Total votes | 284,431 | 100.0 | ||
| Democratic hold | ||||
2020
| Party | Candidate | Votes | % | |
|---|---|---|---|---|
| Democratic | Salud Carbajal (incumbent) | 139,973 | 57.8 | |
| Republican | Andy Caldwell | 92,537 | 38.2 | |
| No party preference | Kenneth Young | 9,650 | 4.0 | |
| Total votes | 242,160 | 100.0 | ||
| General election | ||||
| Democratic | Salud Carbajal (incumbent) | 212,564 | 58.7 | |
| Republican | Andy Caldwell | 149,781 | 41.3 | |
| Total votes | 362,345 | 100.0 | ||
| Democratic hold | ||||
References
- "My Congressional District".
- "Citizens Redistricting Commission Final Report, 2011" (PDF).
- "Partisan Voting Index – Districts of the 115th Congress" (PDF). The Cook Political Report. April 7, 2017. Retrieved April 7, 2017.
- Statement of Vote (2000 President) Archived 2011-05-20 at the Wayback Machine
- Statement of Vote (2000 Senator) Archived 2011-05-20 at the Wayback Machine
- Statement of Vote (2002 Governor) Archived 2010-11-11 at the Wayback Machine
- Statement of Vote (2003 Recall Question) Archived 2011-05-20 at the Wayback Machine
- Statement of Vote (2003 Governor) Archived 2011-05-20 at the Wayback Machine
- Statement of Vote (2004 President) Archived 2011-05-20 at the Wayback Machine
- Statement of Vote (2004 Senator) Archived 2011-08-10 at the Wayback Machine
- Statement of Vote (2006 Governor) Archived 2011-08-10 at the Wayback Machine
- Statement of Vote (2006 Senator) Archived 2011-08-10 at the Wayback Machine
- (2008 Presidential election) Archived June 12, 2009, at the Wayback Machine
- "Daily Kos Elections' presidential results by congressional district for 2016, 2012, and 2008".
- 1952 election results
- 1953 special election results
- 1954 election results
- 1956 election results
- 1958 election results
- 1960 election results
- 1962 election results
- 1964 election results
- 1966 election results
- 1968 election results
- 1970 special election results
- 1970 election results
- 1972 election results
- 1974 election results
- 1976 election results
- 1978 election results
- 1980 election results
- 1982 election results
- 1984 election results
- 1986 election results
- 1988 election results
- 1990 election results
- 1992 election results
- 1994 election results
- 1996 election results
- 1998 election results
- 2000 election results
- 2002 general election results Archived February 3, 2009, at the Wayback Machine
- 2004 general election results
- 2006 general election results Archived November 27, 2008, at the Wayback Machine
- Statement of Vote November 4, 2008, General Election Archived October 18, 2012, at the Wayback Machine
- STATISTICS OF THE PRESIDENTIAL AND CONGRESSIONAL ELECTION OF NOVEMBER 4, 2008
- Statement of Vote November 2, 2010, General Election
- STATISTICS OF THE PRESIDENTIAL AND CONGRESSIONAL ELECTION OF NOVEMBER 2, 2010
- U.S. House of Representatives District 24 - Districtwide Results
- "Archived copy". Archived from the original on 2016-11-17. Retrieved 2016-11-17.CS1 maint: archived copy as title (link)