2020 United States presidential election in California
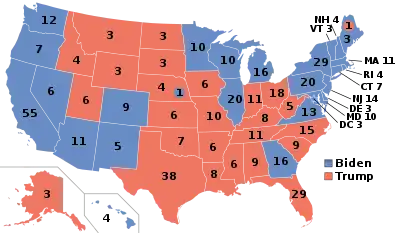
The 2020 United States presidential election in California was held on Tuesday, November 3, 2020, as part of the 2020 United States elections in which all 50 states plus the District of Columbia participated.[2] California voters chose electors to represent them in the Electoral College via a popular vote, pitting the Republican Party's nominee, incumbent President Donald Trump, and running mate Vice President Mike Pence against Democratic Party nominee, former Vice President Joe Biden, and his running mate Kamala Harris, the junior senator from California. California has 55 electoral votes in the Electoral College, the most of any state.[3] Prior to the election, all 14 news organizations considered California a strongly Democratic state, or a safe blue state. It has voted Democratic in every presidential election from 1992 onward. California was one of six states where Trump received more percentage of the two-party vote than he did in 2016. [lower-alpha 1]
| ||||||||||||||||||||||||||
| Turnout | 80.67% (of registered voters) 70.88% (of eligible voters) | |||||||||||||||||||||||||
|---|---|---|---|---|---|---|---|---|---|---|---|---|---|---|---|---|---|---|---|---|---|---|---|---|---|---|
| ||||||||||||||||||||||||||
 County results
| ||||||||||||||||||||||||||
| ||||||||||||||||||||||||||
.jpg.webp)
| Elections in California |
|---|
 |
Biden carried California with 63.5% of the vote and a margin of 29.2% over Trump. Biden earned the highest percentage of the vote in the state for any candidate since Franklin D. Roosevelt in 1936. Biden's margin of victory was slightly smaller than Hillary Clinton's 30.1% in 2016. Biden became the first candidate in any race for any office in U.S. history to win more than 10 million votes in a single state, while Trump also received the most votes a Republican has ever received in any state in any race since the country's founding, narrowly besting his vote total in Texas, a state that he won.[4] President Trump also became the first Republican since President George W. Bush in 2004 to garner more than one million votes in Los Angeles County, and the first Republican candidate to earn 6 million votes in the state.
Per exit polls by the Associated Press, Biden's strength in the state came from a coalition of key Democratic-leaning constituencies, garnering 68% with voters with college degrees;[5] 74% of voters under the age of 30;[5] 93% with Blacks; 69% with Latinos, including 71% of Latinos of Mexican heritage; 73% with Asians; and 67% of union households. California legalized marijuana for recreational use under Proposition 64 in 2016, and 67% of voters favored legalizing the recreational use of marijuana nationwide, breaking for Biden by 75%–22%. Sixty percent of voters approved of Harris.[6] This became only the fourth presidential election in over 100 years where over 70% of California's eligible electorate cast their vote.
Biden flipped Butte County and Inyo County to Democratic, both of which have not voted Democrat since 2008 and 1964, respectively. In contrast, while he improved his total vote share by nearly three percentage points, Trump did not flip any counties that his then-Democratic opponent Hillary Clinton had won in 2016. California Secretary of State Alex Padilla certified the results on December 4.[7]
Primary elections
In a departure from previous election cycles, California held its primaries on Super Tuesday, March 3, 2020.[8] Early voting began several weeks earlier.
Donald Trump secured the Republican nomination on March 17, 2020, defeating several longshot candidates, most notably former Massachusetts Governor Bill Weld. Kamala Harris, the state's junior U.S. senator, was among the Democratic candidates declared until she dropped out on December 3, 2019. Representative Eric Swalwell from the 15th district was also a Democratic candidate but dropped out of the race on July 8, 2019. Other prominent state figures, including former Governor Jerry Brown, current Governor Gavin Newsom, and Los Angeles Mayor Eric Garcetti declined to run.[9][10][11]
Republican primary
The Republican Party's primary campaign was dominated by a lawsuit over the President's taxes.[12] The suit alleges that the new requirement for several years of a candidate's taxes was unconstitutional and onerous. The law was blocked in September 2019 while State Supreme court heard testimony and made a ruling.[13]
As a contingency, the Republican state committee changed its delegate selection process, turning the primary into a mere "beauty contest" and setting up an emergency state convention to Trump's delegate choices.[14] If Trump were allowed on the ballot, the convention would be canceled and the so-called "winner-take-most" rules, which require a challenger to get 20% of the vote, would apply.
President Trump was allowed on the ballot, and the contingency convention was canceled.
| Candidate | Votes | % | Estimated delegates |
|---|---|---|---|
| Donald Trump | 2,279,120 | 92.2% | 172 |
| Bill Weld | 66,904 | 2.7% | |
| Joe Walsh (withdrawn) | 64,749 | 2.6% | |
| Rocky De La Fuente | 24,351 | 1.0% | |
| Matthew John Matern | 15,469 | 0.6% | |
| Robert Ardini | 12,857 | 0.5% | |
| Zoltan Istvan | 8,141 | 0.3% | |
| Total | 2,471,591 | 100% |
Democratic primary
Candidates began filing their paperwork on November 4, 2019, and the final list will be announced on December 9.
Leading California Democrats complained that Joe Biden and Senator Elizabeth Warren were snubbing the state by refusing to attend a forum at the State's "endorsement convention".[16] Early voting began on February 11 and ended the day before primary day.
.svg.png.webp)
- Biden—<30%
- Biden—30–40%
- Sanders—<30%
- Sanders—30–40%
- Sanders—40–50%
- Sanders—50–60%
.jpg.webp)

| 2020 California Democratic presidential primary[17][18] | |||
|---|---|---|---|
| Candidate | Votes | % | Delegates |
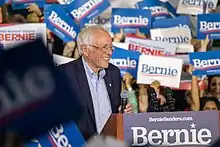
| Bernie Sanders | 2,080,846 | 35.97 | 225 |
| Joe Biden | 1,613,854 | 27.90 | 172 |
| Elizabeth Warren | 762,555 | 13.18 | 11 |
| Michael Bloomberg | 701,803 | 12.13 | 7 |
| Pete Buttigieg (withdrawn)[lower-alpha 2] | 249,256 | 4.31 | 0 |
| Amy Klobuchar (withdrawn)[lower-alpha 2] | 126,961 | 2.19 | 0 |
| Tom Steyer (withdrawn)[lower-alpha 2] | 113,092 | 1.96 | 0 |
| Andrew Yang (withdrawn) | 43,571 | 0.75 | 0 |
| Tulsi Gabbard | 33,769 | 0.58 | 0 |
| Julian Castro (withdrawn) | 13,892 | 0.24 | 0 |
| Michael Bennet (withdrawn) | 7,377 | 0.13 | 0 |
| Marianne Williamson (withdrawn) | 7,052 | 0.12 | 0 |
| Rocky De La Fuente | 6,151 | 0.11 | 0 |
| Cory Booker (withdrawn) | 6,000 | 0.10 | 0 |
| John Delaney (withdrawn) | 4,606 | 0.08 | 0 |
| Michael Ellinger | 3,424 | 0.06 | 0 |
| Joe Sestak (withdrawn) | 3,270 | 0.06 | 0 |
| Mark Greenstein | 3,190 | 0.06 | 0 |
| Deval Patrick (withdrawn) | 2,022 | 0.03 | 0 |
| Mosie Boyd | 1,639 | 0.03 | 0 |
| Robert Jordan (write-in) | 20 | 0.00 | 0 |
| Daphne Bradford (write-in) | 8 | 0.00 | 0 |
| Nakia Anthony (write-in) | 3 | 0.00 | 0 |
| Willie Carter (write-in) | 3 | 0.00 | 0 |
| Michael Dename (write-in) | 0 | 0.00 | 0 |
| Jeffrey Drobman (write-in) | 0 | 0.00 | 0 |
| Heather Stagg (write-in) | 0 | 0.00 | 0 |
| Total votes | 5,784,364 | 100% | 415 |
| District | Bernie Sanders | Joe Biden | Michael Bloomberg | Elizabeth Warren | Total delegates | ||||
|---|---|---|---|---|---|---|---|---|---|
| 1st | 34% | 2 | 23.7% | 2 | 10.3% | 0 | 12.9% | 0 | 4 |
| 2nd | 33.3% | 3 | 25.3% | 2 | 13.5% | 0 | 15.9% | 1 | 6 |
| 3rd | 34.3% | 3 | 29.3% | 2 | 12% | 0 | 12% | 0 | 5 |
| 4th | 26.1% | 2 | 29.6% | 3 | 14.7% | 0 | 11.4% | 0 | 5 |
| 5th | 32.7% | 3 | 27.2% | 3 | 14.9% | 0 | 12.6% | 0 | 6 |
| 6th | 35.8% | 3 | 28.1% | 2 | 10.7% | 0 | 14.3% | 0 | 5 |
| 7th | 30.9% | 2 | 31.4% | 3 | 13% | 0 | 11.2% | 0 | 5 |
| 8th | 35.7% | 2 | 31.2% | 2 | 11.8% | 0 | 8.8% | 0 | 4 |
| 9th | 32.9% | 2 | 32.5% | 2 | 15.9% | 1 | 7% | 0 | 5 |
| 10th | 35.5% | 2 | 29.1% | 1 | 15.3% | 1 | 7.2% | 0 | 4 |
| 11th | 29% | 2 | 30.7% | 3 | 15.3% | 1 | 14.7% | 0 | 6 |
| 12th | 33.8% | 3 | 23.9% | 2 | 11% | 0 | 23.4% | 2 | 7 |
| 13th | 38.7% | 3 | 22.4% | 2 | 8.1% | 0 | 24.7% | 2 | 7 |
| 14th | 31.9% | 3 | 26.4% | 2 | 15.6% | 1 | 14.8% | 0 | 6 |
| 15th | 34.1% | 3 | 29.5% | 3 | 14.4% | 0 | 11.5% | 0 | 6 |
| 16th | 40.9% | 3 | 26.2% | 1 | 12.6% | 0 | 7.2% | 0 | 4 |
| 17th | 36.1% | 3 | 25.9% | 2 | 14.3% | 0 | 12.5% | 0 | 5 |
| 18th | 26.6% | 2 | 29% | 2 | 15.4% | 1 | 17.1% | 1 | 6 |
| 19th | 38.9% | 4 | 25.9% | 2 | 13.6% | 0 | 10.7% | 0 | 6 |
| 20th | 39.8% | 3 | 25.5% | 2 | 10.9% | 0 | 13% | 0 | 5 |
| 21st | 43.2% | 3 | 25.3% | 1 | 13.7% | 0 | 5.1% | 0 | 4 |
| 22nd | 34.4% | 2 | 29.1% | 2 | 13% | 0 | 8.8% | 0 | 4 |
| 23rd | 34.9% | 2 | 30.2% | 2 | 12.2% | 0 | 9% | 0 | 4 |
| 24th | 35.3% | 3 | 26.8% | 2 | 10.5% | 0 | 14.7% | 0 | 5 |
| 25th | 35.6% | 3 | 33.6% | 2 | 10% | 0 | 10% | 0 | 5 |
| 26th | 34.4% | 3 | 31.1% | 2 | 12.1% | 0 | 11.5% | 0 | 5 |
| 27th | 35.9% | 2 | 29.2% | 2 | 10.2% | 0 | 15.7% | 1 | 5 |
| 28th | 40% | 3 | 22.7% | 2 | 7.5% | 0 | 21.7% | 1 | 6 |
| 29th | 49.8% | 3 | 21.5% | 2 | 7.7% | 0 | 11.2% | 0 | 5 |
| 30th | 32.6% | 3 | 31.2% | 2 | 11.2% | 0 | 15.4% | 1 | 6 |
| 31st | 39.1% | 3 | 32.3% | 2 | 11% | 0 | 8.3% | 0 | 5 |
| 32nd | 44.7% | 3 | 28.2% | 2 | 10.5% | 0 | 7.5% | 0 | 5 |
| 33rd | 26.2% | 2 | 34.2% | 3 | 14.3% | 0 | 16.1% | 1 | 6 |
| 34th | 53.7% | 4 | 16.8% | 1 | 8.1% | 0 | 14.7% | 0 | 5 |
| 35th | 46.6% | 2 | 28.2% | 2 | 10.9% | 0 | 6.2% | 0 | 4 |
| 36th | 27.5% | 1 | 29.8% | 2 | 15.4% | 1 | 8.1% | 0 | 4 |
| 37th | 35.6% | 3 | 31.3% | 2 | 10.1% | 0 | 16.2% | 1 | 6 |
| 38th | 41.7% | 3 | 30.8% | 2 | 10.5% | 0 | 7.6% | 0 | 5 |
| 39th | 36.7% | 3 | 30.5% | 2 | 12.6% | 0 | 9.6% | 0 | 5 |
| 40th | 56.4% | 4 | 20.9% | 1 | 8.9% | 0 | 5.4% | 0 | 5 |
| 41st | 45% | 3 | 27.9% | 2 | 10.7% | 0 | 7.5% | 0 | 5 |
| 42nd | 37% | 3 | 31.6% | 2 | 12.4% | 0 | 7.9% | 0 | 5 |
| 43rd | 36.5% | 3 | 34.3% | 2 | 10% | 0 | 10.3% | 0 | 5 |
| 44th | 44% | 3 | 29.6% | 2 | 6.2% | 0 | 9.6% | 0 | 5 |
| 45th | 34% | 3 | 29.1% | 2 | 13.5% | 0 | 12% | 0 | 5 |
| 46th | 53.7% | 2 | 20% | 2 | 10.5% | 0 | 7.7% | 0 | 4 |
| 47th | 38.5% | 3 | 27.3% | 2 | 10.6% | 0 | 12.2% | 0 | 5 |
| 48th | 30.4% | 2 | 30.3% | 2 | 16.3% | 1 | 11% | 0 | 5 |
| 49th | 30.6% | 3 | 30.5% | 2 | 14.6% | 0 | 12.2% | 0 | 5 |
| 50th | 34.9% | 2 | 27.6% | 2 | 13% | 0 | 11.3% | 0 | 4 |
| 51st | 49.2% | 3 | 23.7% | 2 | 11.3% | 0 | 6.8% | 0 | 5 |
| 52nd | 30.6% | 3 | 30% | 3 | 13.4% | 0 | 14.6% | 0 | 6 |
| 53rd | 37.8% | 3 | 27.3% | 3 | 10.1% | 0 | 14.5% | 0 | 6 |
| Total | 36.0% | 144 | 27.9% | 109 | 12.1% | 7 | 13.2% | 11 | 271 |
| Delegate Type | Bernie Sanders | Joe Biden | Michael Bloomberg | Elizabeth Warren |
|---|---|---|---|---|
| At-Large | 51 | 39 | 0 | 0 |
| PLEO | 30 | 24 | 0 | 0 |
| District-Level | 144 | 109 | 7 | 11 |
| Total | 225 | 172 | 7 | 11 |
Libertarian primary
The Libertarian Party of California permitted non-affiliated voters to vote in their presidential primary.[21]
| Party | Candidate | Votes | % | |
|---|---|---|---|---|
| Libertarian | Jacob Hornberger | 2,898 | 17.5 | |
| Libertarian | Ken Armstrong | 1,921 | 11.6 | |
| Libertarian | Vermin Supreme | 1,921 | 11.6 | |
| Libertarian | Jo Jorgensen | 1,896 | 11.4 | |
| Libertarian | Kim Ruff (withdrawn) | 1,459 | 8.8 | |
| Libertarian | Adam Kokesh | 1,302 | 7.9 | |
| Libertarian | Dan "Taxation is Theft" Behrman | 1,039 | 6.3 | |
| Libertarian | Sam Robb | 993 | 6.0 | |
| Libertarian | Max Abramson | 970 | 5.9 | |
| Libertarian | Steve Richey | 649 | 3.9 | |
| Libertarian | Souraya Faas | 590 | 3.6 | |
| Libertarian | Erik Gerhardt | 486 | 2.9 | |
| Libertarian | Keenan Wallace Dunham | 440 | 2.7 | |
| Total votes | 16,564 | 100% | ||
Green primary
| 2020 California Green primary[23] | |||
|---|---|---|---|
| Candidate | Votes | Percentage | National delegates |
| Howie Hawkins | 4,202 | 36.2% | 16 estimated |
| Dario Hunter | 2,558 | 22.0% | 9 estimated |
| Sedinam Moyowasifza-Curry | 2,071 | 17.8% | 8 estimated |
| Dennis Lambert | 1,999 | 17.2% | 7 estimated |
| David Rolde | 774 | 6.7% | 3 estimated |
| Total | 9,656 | 100.00% | 43 |
American Independent primary
The American Independent Party permitted non-affiliated voters to vote in their presidential primary.[21]
| Party | Candidate | Votes | % | |
|---|---|---|---|---|
| American Independent | Phil Collins | 11,532 | 32.8 | |
| American Independent | Roque "Rocky" De La Fuente | 7,263 | 21.0 | |
| American Independent | Don Blankenship | 6,913 | 19.7 | |
| American Independent | J.R. Myers | 5,099 | 14.5 | |
| American Independent | Charles Kraut | 4,216 | 12.0 | |
| Total votes | 35,723 | 100% | ||
Peace and Freedom primary
| Party | Candidate | Votes | % | |
|---|---|---|---|---|
| Peace and Freedom | Gloria La Riva | 2,570 | 66.0 | |
| Peace and Freedom | Howie Hawkins | 1,325 | 34.0 | |
| Total votes | 3,895 | 100% | ||
General election
Predictions
| Source | Ranking | As of |
|---|---|---|
| The Cook Political Report[25] | Solid D | November 3, 2020 |
| Inside Elections[26] | Solid D | November 3, 2020 |
| Sabato's Crystal Ball[27] | Safe D | November 3, 2020 |
| Politico[28] | Solid D | November 3, 2020 |
| RCP[29] | Solid D | November 3, 2020 |
| Niskanen[30] | Safe D | November 3, 2020 |
| CNN[31] | Solid D | November 3, 2020 |
| The Economist[32] | Safe D | November 3, 2020 |
| CBS News[33] | Likely D | November 3, 2020 |
| 270towin[34] | Safe D | November 3, 2020 |
| ABC News[35] | Solid D | November 3, 2020 |
| NPR[36] | Likely D | November 3, 2020 |
| NBC News[37] | Solid D | November 3, 2020 |
| 538[38] | Solid D | November 3, 2020 |
Polling
- Graphical summary
Aggregate polls
| Source of poll aggregation |
Dates administered |
Dates updated |
Joe Biden Democratic |
Donald Trump Republican |
Other/ Undecided [lower-alpha 3] |
Margin |
|---|---|---|---|---|---|---|
| 270 to Win | September 26 – October 21, 2020 | October 27, 2020 | 61.0% | 32.3% | 6.7% | Biden +28.7 |
| Real Clear Politics | September 26 – October 21, 2020 | October 27, 2020 | 60.7% | 31.0% | 8.3% | Biden +29.7 |
| FiveThirtyEight | until October 25, 2020 | October 27, 2020 | 61.1% | 31.9% | 6.9% | Biden +29.3 |
| Average | 61.0% | 31.7% | 7.3% | Biden +29.3 | ||
Polls
| Poll source | Date(s) administered |
Sample size[lower-alpha 4] |
Margin of error |
Donald Trump Republican |
Joe Biden Democratic |
Jo Jorgensen Libertarian |
Howie Hawkins Green |
Other | Undecided |
|---|---|---|---|---|---|---|---|---|---|
| SurveyMonkey/Axios | Oct 20 – Nov 2, 2020 | 12,370 (LV) | ± 1.5% | 36%[lower-alpha 5] | 62% | – | – | – | – |
| David Binder Research | Oct 28 – Nov 1, 2020 | 800 (LV) | – | 31% | 62% | – | – | 3% | 4% |
| USC Schwarzenegger Institute | Oct 27–31, 2020 | 1,155 (RV) | ± 3% | 28% | 65% | – | – | 4%[lower-alpha 6] | 2% |
| SurveyMonkey/Tableau | Sep 30 – Oct 28, 2020 | 22,450 (LV) | – | 37%[lower-alpha 7] | 61% | – | – | – | – |
| Swayable | Oct 23–26, 2020 | 635 (LV) | ± 5.2% | 35% | 62% | 2% | 1% | – | – |
| UC Berkeley/LA Times | Oct 16–21, 2020 | 5,352 (LV) | ± 2% | 29% | 65% | 1% | 0% | 0%[lower-alpha 8][lower-alpha 9] | 3% |
| Public Policy Institute of California | Oct 9–18, 2020 | 1,185 (LV) | ± 4.3% | 32% | 58% | 3% | 2% | 1%[lower-alpha 10] | 4% |
| SurveyMonkey/Tableau | Sep 1–30, 2020 | 20,346 (LV) | – | 35% | 63% | – | – | – | 2% |
| SurveyUSA | Sep 26–28, 2020 | 588 (LV) | ± 5.4% | 34% | 59% | – | – | 3%[lower-alpha 11] | 6% |
| Redfield & Wilton Strategies | Sep 19–21, 2020 | 1,775 (LV) | – | 28% | 62% | 1% | 1% | 1%[lower-alpha 12] | 8% |
| UC Berkeley/LA Times | Sep 9–15, 2020 | 5,942 (LV) | ± 2% | 28% | 67% | 1% | 0% | 0%[lower-alpha 13][lower-alpha 14] | 3% |
| Public Policy Institute of California | Sep 4–13, 2020 | 1,168 (LV) | ± 4.3% | 31% | 60% | 3% | 2% | 1%[lower-alpha 15] | 2% |
| Spry Strategies/Women's Liberation Front | Aug 29 – Sep 1, 2020 | 600 (LV) | ± 4% | 39% | 56% | – | – | – | 5% |
| SurveyMonkey/Tableau | Aug 1–31, 2020 | 17,537 (LV) | – | 35% | 63% | – | – | – | 2% |
| David Binder Research | Aug 22–24, 2020 | 800 (LV) | – | 31% | 61% | – | – | 3%[lower-alpha 16] | 5% |
| Redfield and Wilton Strategies | Aug 9, 2020 | 1,904 (LV) | ± 2.3% | 25% | 61% | 1% | 1% | 2%[lower-alpha 17] | 9% |
| SurveyMonkey/Tableau | Jul 1–31, 2020 | 19,027 (LV) | – | 35% | 63% | – | – | – | 2% |
| University of California Berkeley | Jul 21–27, 2020 | 6,756 (LV) | ± 2.0% | 28% | 67% | – | – | – | 5% |
| SurveyMonkey/Tableau | Jun 8–30, 2020 | 8,412 (LV) | – | 36% | 62% | – | – | – | 2% |
| Public Policy Institute of California | May 19–26, 2020 | 1,048 (LV) | ± 4.6% | 33% | 57% | – | – | 6%[lower-alpha 18] | 3% |
| SurveyUSA | May 18–19, 2020 | 537 (LV) | ± 5.4% | 30% | 58% | – | – | 5% | 7% |
| Emerson College | May 8–10, 2020 | 800 (RV) | ± 3.4% | 35%[lower-alpha 19] | 65% | – | – | – | – |
| Public Policy Polling | Mar 28–29, 2020 | 962 (RV) | – | 29% | 67% | – | – | – | 3% |
| AtlasIntel | Feb 24 – Mar 2, 2020 | 1,100 (RV) | ± 3.0% | 26% | 62% | – | – | 12% | – |
| YouGov | Feb 26–28, 2020 | 1,507 (RV) | – | 31% | 59% | – | – | 4% | 4% |
| CNN/SSRS | Feb 22–26, 2020 | 951 (RV) | ± 3.3% | 35% | 60% | – | – | 3%[lower-alpha 20] | 3% |
| University of California Berkeley | Feb 20–25, 2020 | 5,526 (RV) | – | 31% | 58% | – | – | – | 11% |
| SurveyUSA | Feb 13–16, 2020 | 1,196 (RV) | ± 3.1% | 37% | 57% | – | – | – | 6% |
| YouGov/USC Price-Schwarzenegger Institute | Feb 1–15, 2020 | 1,200 (RV) | ± 3.1% | 30% | 60% | – | – | – | 4% |
| SurveyUSA | Jan 14–16, 2020 | 1,967 (RV) | ± 2.8% | 35% | 59% | – | – | – | 6% |
| CNN/SSRS | Dec 4–8, 2019 | 1,011 (RV) | ± 3.4% | 36% | 56% | – | – | 3%[lower-alpha 21] | 5% |
| SurveyUSA | Nov 20–22, 2019 | 2,039 (RV) | ± 2.4% | 32% | 59% | – | – | – | 9% |
| SurveyUSA | Oct 15–16, 2019 | 1,242 (RV) | ± 3.8% | 32% | 59% | – | – | – | 9% |
| Emerson College | Sep 13–16, 2019 | 830 (RV) | ± 3.3% | 36% | 64% | – | – | – | – |
| SurveyUSA | Sep 13–15, 2019 | 1,785 (RV) | ± 3.2% | 31% | 57% | – | – | – | 11% |
| SurveyUSA | Aug 1–5, 2019 | 2,184 (RV) | ± 2.7% | 27% | 61% | – | – | – | 12% |
| SurveyUSA | Mar 22–25, 2018 | 882 (RV) | ± 3.8% | 33% | 56% | – | – | – | 11% |
Former candidates | ||||||||||||||||||||||||||||||||||||||||||||||||||||||||||||||||||||||||||||||||||||||||||||||||||||||||||||||||||||||||||||||||||||||||||||||||||||||||||||||||||||||||||||||||||||||||||||||||||||||||||||||||||||||||||||||||||||||||||||||||||||||||||||||||||||||||||||||||||||||||||||||||||||||||||||||||||||||||||||||||||||||||||||||||||||||||||||||||||||||||||||||||||||||||||||||||||||||||||||||||||||||||||||||||||||||||||||||||||||||||||||||||||||||||||||||||||||||||||||||||||||||||||||||||||||||||||||||||||||||||||||||||||||||||||||||||||||||||||||||||||||||||||||||||||||||||||||||||||||||||||||||||||||||||
|---|---|---|---|---|---|---|---|---|---|---|---|---|---|---|---|---|---|---|---|---|---|---|---|---|---|---|---|---|---|---|---|---|---|---|---|---|---|---|---|---|---|---|---|---|---|---|---|---|---|---|---|---|---|---|---|---|---|---|---|---|---|---|---|---|---|---|---|---|---|---|---|---|---|---|---|---|---|---|---|---|---|---|---|---|---|---|---|---|---|---|---|---|---|---|---|---|---|---|---|---|---|---|---|---|---|---|---|---|---|---|---|---|---|---|---|---|---|---|---|---|---|---|---|---|---|---|---|---|---|---|---|---|---|---|---|---|---|---|---|---|---|---|---|---|---|---|---|---|---|---|---|---|---|---|---|---|---|---|---|---|---|---|---|---|---|---|---|---|---|---|---|---|---|---|---|---|---|---|---|---|---|---|---|---|---|---|---|---|---|---|---|---|---|---|---|---|---|---|---|---|---|---|---|---|---|---|---|---|---|---|---|---|---|---|---|---|---|---|---|---|---|---|---|---|---|---|---|---|---|---|---|---|---|---|---|---|---|---|---|---|---|---|---|---|---|---|---|---|---|---|---|---|---|---|---|---|---|---|---|---|---|---|---|---|---|---|---|---|---|---|---|---|---|---|---|---|---|---|---|---|---|---|---|---|---|---|---|---|---|---|---|---|---|---|---|---|---|---|---|---|---|---|---|---|---|---|---|---|---|---|---|---|---|---|---|---|---|---|---|---|---|---|---|---|---|---|---|---|---|---|---|---|---|---|---|---|---|---|---|---|---|---|---|---|---|---|---|---|---|---|---|---|---|---|---|---|---|---|---|---|---|---|---|---|---|---|---|---|---|---|---|---|---|---|---|---|---|---|---|---|---|---|---|---|---|---|---|---|---|---|---|---|---|---|---|---|---|---|---|---|---|---|---|---|---|---|---|---|---|---|---|---|---|---|---|---|---|---|---|---|---|---|---|---|---|---|---|---|---|---|---|---|---|---|---|---|---|---|---|---|---|---|---|---|---|---|---|---|---|---|---|---|---|---|---|---|---|---|---|---|---|---|---|---|---|---|---|---|---|---|---|---|---|---|---|---|---|---|---|---|---|---|---|---|---|---|---|---|---|---|---|---|---|---|---|---|---|---|---|---|---|---|---|---|---|---|---|---|---|---|---|---|---|---|---|---|---|---|---|---|---|---|---|---|---|---|---|---|---|---|---|---|---|---|---|---|---|---|---|---|---|---|---|---|---|---|---|---|---|---|---|---|---|---|---|---|---|---|---|---|---|---|---|---|---|---|---|---|---|---|---|---|---|---|---|---|---|---|---|---|---|---|---|---|---|---|---|---|---|---|---|---|---|---|---|---|---|---|---|---|---|---|---|---|---|---|---|---|---|---|---|---|---|---|---|---|
|
with Donald Trump and Bernie Sanders
with Donald Trump and Tulsi Gabbard
with Donald Trump and Elizabeth Warren
with Donald Trump and Michael Bloomberg
with Donald Trump and Amy Klobuchar
with Donald Trump and Pete Buttigieg
with Donald Trump and Tom Steyer
with Donald Trump and Deval Patrick
with Donald Trump and Andrew Yang
with Donald Trump and Cory Booker
with Donald Trump and Kamala Harris
with Donald Trump and Beto O'Rourke
with Donald Trump and Kirsten Gillibrand
|
Hypothetical polling | ||||||||||||||||||||||||||||||||||||||||||||||||||||||||||||||||||||||||||||||||||||||||||||||||||||||||||||||||||||||||||||||||||||||||||||||||||||||||||||||||||||||||||||||||||||||||||||||||||||||||||||||||||||||||||||||||||||||||||||||||||||||||||||||||||||||||||||||||||||||||||||||||||||||||||||||||||||||||||||||||||||||||||||||||||||||||||||||||||||||||||||
|---|---|---|---|---|---|---|---|---|---|---|---|---|---|---|---|---|---|---|---|---|---|---|---|---|---|---|---|---|---|---|---|---|---|---|---|---|---|---|---|---|---|---|---|---|---|---|---|---|---|---|---|---|---|---|---|---|---|---|---|---|---|---|---|---|---|---|---|---|---|---|---|---|---|---|---|---|---|---|---|---|---|---|---|---|---|---|---|---|---|---|---|---|---|---|---|---|---|---|---|---|---|---|---|---|---|---|---|---|---|---|---|---|---|---|---|---|---|---|---|---|---|---|---|---|---|---|---|---|---|---|---|---|---|---|---|---|---|---|---|---|---|---|---|---|---|---|---|---|---|---|---|---|---|---|---|---|---|---|---|---|---|---|---|---|---|---|---|---|---|---|---|---|---|---|---|---|---|---|---|---|---|---|---|---|---|---|---|---|---|---|---|---|---|---|---|---|---|---|---|---|---|---|---|---|---|---|---|---|---|---|---|---|---|---|---|---|---|---|---|---|---|---|---|---|---|---|---|---|---|---|---|---|---|---|---|---|---|---|---|---|---|---|---|---|---|---|---|---|---|---|---|---|---|---|---|---|---|---|---|---|---|---|---|---|---|---|---|---|---|---|---|---|---|---|---|---|---|---|---|---|---|---|---|---|---|---|---|---|---|---|---|---|---|---|---|---|---|---|---|---|---|---|---|---|---|---|---|---|---|---|---|---|---|---|---|---|---|---|---|---|---|---|---|---|---|---|---|---|---|---|---|---|---|---|---|---|---|---|---|---|---|---|---|---|---|---|---|---|---|---|---|---|---|---|---|---|---|---|---|---|---|---|---|---|
|
with Donald Trump and Jerry Brown
with Donald Trump and Sherrod Brown
with Donald Trump and Eric Garcetti
with Donald Trump and Tom Hanks
with Donald Trump and Eric Holder
with Donald Trump and Mitch Landrieu
with Donald Trump and Michelle Obama
with Donald Trump and Oprah Winfrey
with Donald Trump and Mark Zuckerberg
with Mike Pence and Joe Biden
with Mike Pence and Michael Bloomberg
with Mike Pence and Pete Buttigieg
with Mike Pence and Bernie Sanders
with Mike Pence and Elizabeth Warren
with Nikki Haley and Joe Biden
with Nikki Haley and Pete Buttigieg
with Nikki Haley and Bernie Sanders
with Nikki Haley and Elizabeth Warren
|
Hypothetical polling with former candidates | |||||||||||||||||||||||||||||||||||||||||||||||||||||||||||||||||||||||||||||
|---|---|---|---|---|---|---|---|---|---|---|---|---|---|---|---|---|---|---|---|---|---|---|---|---|---|---|---|---|---|---|---|---|---|---|---|---|---|---|---|---|---|---|---|---|---|---|---|---|---|---|---|---|---|---|---|---|---|---|---|---|---|---|---|---|---|---|---|---|---|---|---|---|---|---|---|---|---|
|
with Mike Pence and Kamala Harris
with Mike Pence and Beto O'Rourke
with Nikki Haley and Kamala Harris
with Nikki Haley and Beto O'Rourke
|
Results
Biden won California with one of the biggest margins of victory in recent history. He performed well in most urban areas of the state. Biden is also the first candidate for any statewide race in California to receive over ten million votes.
| Party | Candidate | Votes | % | ±% | |
|---|---|---|---|---|---|
| Democratic | Joe Biden Kamala Harris |
11,110,250 | 63.48% | +1.75% | |
| Republican | Donald Trump Mike Pence |
6,006,429 | 34.32% | +2.70% | |
| Libertarian | Jo Jorgensen Spike Cohen |
187,895 | 1.07% | -2.30% | |
| Green | Howie Hawkins Angela Walker |
81,029 | 0.46% | -1.51% | |
| American Independent | Rocky De La Fuente Kanye West |
60,160 | 0.34% | N/A | |
| Peace and Freedom | Gloria La Riva Sunil Freeman |
51,037 | 0.29% | -0.18% | |
| American Solidarity | Brian Carroll (write-in) Amar Patel (write-in) |
2,605 | 0.01% | N/A | |
| Green | Jesse Ventura (write-in) Cynthia McKinney (write-in) |
611 | 0.00% | N/A | |
| Independent | Mark Charles (write-in) Adrian Wallace (write-in) |
559 | 0.00% | N/A | |
| Independent | Brock Pierce (write-in) Karla Ballard (write-in) |
185 | 0.00% | N/A | |
| Socialist Equality | Joseph Kishore (write-in) Norissa Santa Cruz (write-in) |
121 | 0.00% | N/A | |
| Total votes | 17,500,881 | 100% | |||
Results by county
| County | Joe Biden | Donald Trump | Other | Total | |||
|---|---|---|---|---|---|---|---|
| Votes | % | Votes | % | Votes | % | ||
| Alameda | 617,659 | 80.23% | 136,309 | 17.71% | 15,896 | 2.06% | 769,864 |
| Alpine | 476 | 64.24% | 244 | 32.93% | 21 | 2.83% | 741 |
| Amador | 8,153 | 36.56% | 13,585 | 60.91% | 564 | 2.53% | 22,302 |
| Butte | 50,426 | 49.42% | 48,730 | 47.75% | 2,886 | 2.83% | 102,042 |
| Calaveras | 10,046 | 36.98% | 16,518 | 60.81% | 600 | 2.21% | 27,164 |
| Colusa | 3,234 | 40.67% | 4,554 | 57.28% | 163 | 2.05% | 7,951 |
| Contra Costa | 416,386 | 71.64% | 152,877 | 26.30% | 11,967 | 2.06% | 581,230 |
| Del Norte | 4,677 | 40.84% | 6,461 | 56.42% | 314 | 2.74% | 11,452 |
| El Dorado | 51,621 | 44.45% | 61,838 | 53.25% | 2,679 | 2.30% | 116,138 |
| Fresno | 193,025 | 52.91% | 164,464 | 45.08% | 7,320 | 2.01% | 364,809 |
| Glenn | 3,995 | 35.38% | 7,063 | 62.55% | 234 | 2.07% | 11,292 |
| Humboldt | 44,768 | 65.04% | 21,770 | 31.63% | 2,290 | 3.33% | 68,828 |
| Imperial | 34,678 | 61.14% | 20,847 | 36.76% | 1,193 | 2.10% | 56,718 |
| Inyo | 4,634 | 48.88% | 4,620 | 48.73% | 227 | 2.39% | 9,481 |
| Kern | 133,366 | 43.69% | 164,484 | 53.89% | 7,376 | 2.42% | 305,226 |
| Kings | 18,699 | 42.64% | 24,072 | 54.89% | 1,087 | 2.47% | 43,858 |
| Lake | 14,941 | 51.88% | 13,123 | 45.57% | 736 | 2.55% | 28,800 |
| Lassen | 2,799 | 23.35% | 8,970 | 74.84% | 216 | 1.81% | 11,985 |
| Los Angeles | 3,028,885 | 71.04% | 1,145,530 | 26.87% | 89,028 | 2.09% | 4,263,443 |
| Madera | 23,168 | 43.13% | 29,378 | 54.69% | 1,176 | 2.18% | 53,722 |
| Marin | 128,288 | 82.34% | 24,612 | 15.80% | 2,901 | 1.86% | 155,801 |
| Mariposa | 4,088 | 39.77% | 5,950 | 57.88% | 242 | 2.35% | 10,280 |
| Mendocino | 28,782 | 66.42% | 13,267 | 30.61% | 1,287 | 2.97% | 43,336 |
| Merced | 48,991 | 54.11% | 39,397 | 43.51% | 2,153 | 2.38% | 90,541 |
| Modoc | 1,150 | 26.51% | 3,109 | 71.67% | 79 | 1.82% | 4,338 |
| Mono | 4,013 | 59.57% | 2,513 | 37.30% | 211 | 3.13% | 6,737 |
| Monterey | 113,953 | 69.53% | 46,299 | 28.25% | 3,631 | 2.22% | 163,883 |
| Napa | 49,817 | 69.07% | 20,676 | 28.67% | 1,629 | 2.26% | 72,122 |
| Nevada | 36,359 | 56.16% | 26,779 | 41.37% | 1,600 | 2.47% | 64,738 |
| Orange | 814,009 | 53.49% | 676,498 | 44.46% | 31,218 | 2.05% | 1,521,725 |
| Placer | 106,869 | 45.47% | 122,488 | 52.12% | 5,660 | 2.41% | 235,017 |
| Plumas | 4,561 | 40.52% | 6,445 | 57.26% | 250 | 2.22% | 11,256 |
| Riverside | 527,945 | 53.00% | 448,702 | 45.04% | 19,509 | 1.96% | 996,156 |
| Sacramento | 440,808 | 61.37% | 259,405 | 36.11% | 18,077 | 2.52% | 718,290 |
| San Benito | 17,628 | 61.16% | 10,590 | 36.74% | 603 | 2.10% | 28,821 |
| San Bernardino | 455,859 | 54.21% | 366,257 | 43.55% | 18,815 | 2.24% | 840,931 |
| San Diego | 964,650 | 60.23% | 600,094 | 37.47% | 36,978 | 2.30% | 1,601,722 |
| San Francisco | 378,156 | 85.27% | 56,417 | 12.72% | 8,885 | 2.01% | 443,458 |
| San Joaquin | 161,137 | 55.86% | 121,098 | 41.99% | 6,208 | 2.15% | 288,443 |
| San Luis Obispo | 88,310 | 55.30% | 67,436 | 42.23% | 3,935 | 2.47% | 159,681 |
| San Mateo | 291,410 | 77.91% | 75,563 | 20.20% | 7,085 | 1.89% | 374,058 |
| Santa Barbara | 129,963 | 64.89% | 65,736 | 32.82% | 4,589 | 2.29% | 200,288 |
| Santa Clara | 617,967 | 72.66% | 214,612 | 25.23% | 17,943 | 2.11% | 850,522 |
| Santa Cruz | 114,246 | 78.90% | 26,937 | 18.60% | 3,613 | 2.50% | 144,796 |
| Shasta | 30,000 | 32.29% | 60,789 | 65.43% | 2,111 | 2.28% | 92,900 |
| Sierra | 730 | 37.82% | 1,142 | 59.17% | 58 | 3.01% | 1,930 |
| Siskiyou | 9,593 | 40.91% | 13,290 | 56.67% | 567 | 2.42% | 23,450 |
| Solano | 131,639 | 63.95% | 69,306 | 33.67% | 4,886 | 2.38% | 205,831 |
| Sonoma | 199,938 | 74.53% | 61,825 | 23.05% | 6,489 | 2.42% | 268,252 |
| Stanislaus | 105,841 | 49.26% | 104,145 | 48.47% | 4,890 | 2.27% | 214,876 |
| Sutter | 17,367 | 40.73% | 24,375 | 57.16% | 898 | 2.11% | 42,640 |
| Tehama | 8,911 | 31.03% | 19,141 | 66.64% | 669 | 2.33% | 28,721 |
| Trinity | 2,851 | 45.56% | 3,188 | 50.94% | 219 | 3.50% | 6,258 |
| Tulare | 66,105 | 45.02% | 77,579 | 52.84% | 3,148 | 2.14% | 146,832 |
| Tuolumne | 11,978 | 39.40% | 17,689 | 58.19% | 734 | 2.41% | 30,401 |
| Ventura | 251,388 | 59.47% | 162,207 | 38.37% | 9,103 | 2.16% | 422,698 |
| Yolo | 67,598 | 69.50% | 27,292 | 28.06% | 2,374 | 2.44% | 97,264 |
| Yuba | 11,230 | 37.70% | 17,676 | 59.34% | 881 | 2.96% | 29,787 |
| Total | 11,110,250 | 63.48% | 6,006,429 | 34.32% | 384,202 | 2.20% | 17,500,881 |
By congressional district
Biden won 46 out of the 53 congressional districts in California.
See also
- United States presidential elections in California
- 2020 California elections
- 2020 United States presidential election
- 2020 Democratic Party presidential primaries
- 2020 Republican Party presidential primaries
- 2020 Libertarian Party presidential primaries
- 2020 Green Party presidential primaries
- 2020 United States elections
Notes
- The other five states were Florida, Hawaii, Illinois, Nevada, and New York, including Washington DC.
- Candidate withdrew after early voting started, but before the date of the election.
- Calculated by taking the difference of 100% and all other candidates combined.
- Key:
A – all adults
RV – registered voters
LV – likely voters
V – unclear - Overlapping sample with the previous SurveyMonkey/Axios poll, but more information available regarding sample size
- "Someone else" with 4%
- Overlapping sample with the previous SurveyMonkey/Axios poll, but more information available regarding sample size
- De La Fuente (A) and De La Riva (PSOL) with 0%
- De La Fuente listed as Guerra
- Would not vote with 1%; "Someone else" with no voters
- "Another candidate" with 3%
- "Another Third Party/Write-in" with 1%
- De La Fuente (A) and De La Riva (PSOL) with 0%
- De La Fuente listed as Guerra
- "Would not vote" with 1%; "Someone else" with no voters
- "Someone else" with 3%
- "Another Third Party/Write-in" with 2%
- "Someone else" with 4%; would not vote with 2%
- Including voters who lean towards a given candidate
- Other with 0%; neither with 3%
- Other with 0%; neither with 3%
- "Other" with 3%; would not vote with 3%
- Other with 0%; neither with 3%
- Other with 1%; neither with 3%
- "Other" with 3%; would not vote with 2%
- Other with 0%; neither with 3%
- Other with 1%; neither with 3%
- "Other" with 6%; would not vote with 4%
- Other with 0%; neither with 4%
- "Other" with 5%; would not vote with 2%
- Other with 0%; neither with 4%
- "Other" with 5%; would not vote with 3%
- Other with 0%; neither with 4%
- Other with 1%; neither with 3%
References
- https://elections.cdn.sos.ca.gov/sov/2020-general/sov/04-historical-voter-reg-participation.pdf
- Kelly, Ben (August 13, 2018). "US elections key dates: When are the 2018 midterms and the 2020 presidential campaign?". The Independent. Archived from the original on January 3, 2019. Retrieved January 3, 2019.
- "Distribution of Electoral Votes". National Archives and Records Administration. Archived from the original on January 9, 2019. Retrieved January 3, 2019.
- "Texas Presidential Election Results". The New York Times. January 5, 2021. ISSN 0362-4331. Retrieved January 8, 2021.
- "California Exit Polls: How Different Groups Voted". The New York Times. November 3, 2020. ISSN 0362-4331. Retrieved December 10, 2020.
- "California Voter Surveys: How Different Groups Voted". The New York Times. November 3, 2020. ISSN 0362-4331. Retrieved November 9, 2020.
- "Biden officially secures enough electors to become president". AP NEWS. December 5, 2020.
- Dezenski, Lauren (December 19, 2018). "Why California leapfrogged the 2020 primary schedule". Archived from the original on January 22, 2019. Retrieved March 4, 2019.
- Richards, Sam (March 30, 2017). "Jerry Brown for president? 'Don't rule it out!'". Contra Costa Times. Archived from the original on May 10, 2017. Retrieved May 10, 2017.
- Steinmetz, Katy (September 9, 2017). "The Philosopher King". Time. Archived from the original on November 10, 2017. Retrieved November 7, 2017.
- Desk, Washington (March 4, 2019). "Former AG Eric Holder rules out 2020 run". Archived from the original on March 6, 2019. Retrieved March 4, 2019.
- "California justices skeptical of requiring Trump tax returns". KCRA. November 6, 2019. Archived from the original on November 11, 2019. Retrieved November 11, 2019.
- Augie Martin and Paul LeBlanc. "Federal judge halts California law forcing Trump to release tax returns to qualify for ballot". CNN. Archived from the original on December 5, 2019. Retrieved December 10, 2019.
- "California GOP opens alternative pathway for 2020 delegates". AP NEWS. September 8, 2019. Archived from the original on November 11, 2019. Retrieved November 11, 2019.
- "California Republican Primary Results". electionresults.sos.ca.gov. Retrieved March 20, 2020.
- "Joe Biden, Elizabeth Warren snubbing the Golden State, says California Democratic Party chair". November 6, 2019.
- "2020 Presidential Primaries, Caucuses, and Conventions: California Democrat". The Green Papers. Retrieved July 12, 2020.
- "Statement of Vote: Presidential Primary Election, March 3, 2020" (PDF). Secretary of State of California. May 1, 2020. Retrieved July 12, 2020.
- https://www.sos.ca.gov/elections/prior-elections/statewide-election-results/presidential-primary-election-march-3-2020/statement-vote
- https://cadem.org/wp-content/uploads/2020/06/Delegate-and-Alternate-Allocation-per-CD-4.28-.pdf
- Myers, John (October 21, 2019). "California independents can cast ballots for Democrats — but not Trump — in March primary". Los Angeles Times. Archived from the original on November 16, 2019. Retrieved November 17, 2019.
- "Generally Recognized Presidential Candidates – March 3, 2020, Presidential Primary Election". Archived (PDF) from the original on December 7, 2019. Retrieved December 7, 2019.
- "California Green Party Primary". er.ncsbe.gov. Archived from the original on March 5, 2020. Retrieved March 4, 2020.
- "2020 California Presidential Primary Election Results". Election Results. Archived from the original on March 4, 2020. Retrieved March 4, 2020.
- "2020 POTUS Race ratings" (PDF). The Cook Political Report. Archived from the original on March 23, 2020. Retrieved May 21, 2019.
- "POTUS Ratings | Inside Elections". insideelections.com. Archived from the original on May 27, 2020. Retrieved May 21, 2019.
- "Larry J. Sabato's Crystal Ball » 2020 President". crystalball.centerforpolitics.org. Archived from the original on April 4, 2020. Retrieved May 21, 2019.
- "2020 Election Forecast". Politico. November 19, 2019. Archived from the original on June 14, 2020. Retrieved April 8, 2020.
- "Battle for White House". RCP. April 19, 2019. Archived from the original on May 3, 2020. Retrieved April 27, 2020.
- 2020 Bitecofer Model Electoral College Predictions Archived April 23, 2020, at the Wayback Machine, Niskanen Center, March 24, 2020, retrieved: April 19, 2020.
- David Chalian; Terence Burlij. "Road to 270: CNN's debut Electoral College map for 2020". CNN. Archived from the original on June 16, 2020. Retrieved June 16, 2020.
- "Forecasting the US elections". The Economist. Archived from the original on July 5, 2020. Retrieved July 7, 2020.
- "2020 Election Battleground Tracker". CBS News. July 12, 2020. Archived from the original on July 12, 2020. Retrieved July 13, 2020.
- "2020 Presidential Election Interactive Map". 270 to Win. Archived from the original on April 15, 2020. Retrieved April 15, 2020.
- "ABC News Race Ratings". CBS News. July 24, 2020. Archived from the original on July 24, 2020. Retrieved July 24, 2020.
- "2020 Electoral Map Ratings: Trump Slides, Biden Advantage Expands Over 270 Votes". NPR.org. Archived from the original on August 4, 2020. Retrieved August 3, 2020.
- "Biden dominates the electoral map, but here's how the race could tighten". NBC News. Archived from the original on August 7, 2020. Retrieved August 6, 2020.
- "2020 Election Forecast". FiveThirtyEight. Archived from the original on August 14, 2020. Retrieved August 14, 2020.
- "Certificate of Ascertainment" (PDF). archives.gov. December 5, 2020. Retrieved December 9, 2020.
- "Statement of Vote, General Election, November 3, 2020" (PDF). California Secretary of State. December 11, 2020. Retrieved December 19, 2020.
Further reading
- Summary: State Laws on Presidential Electors (PDF), Washington DC: National Association of Secretaries of State, August 2020,
California