San Luis Obispo County, California
San Luis Obispo County, officially the County of San Luis Obispo, is a county on the Central Coast of California. As of the 2010 census, the population was 269,637.[4] The county seat is San Luis Obispo.[6]
San Luis Obispo County | |
|---|---|
| County of San Luis Obispo | |
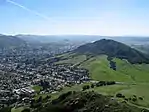 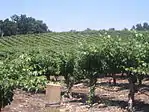 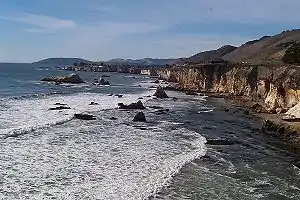 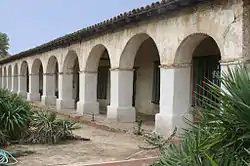 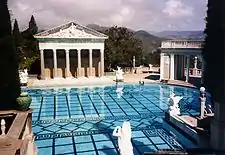 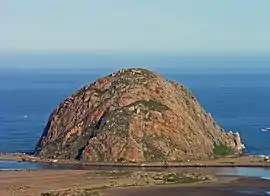 Images, from top down, left to right: Cerro San Luis (Mountain) in San Luis Obispo, a vineyard in Paso Robles, Pismo Beach, Mission San Miguel Arcángel, Neptune Pool at Hearst Castle, Morro Rock | |
 Seal | |
| Motto(s): "Not For Ourselves Alone" | |
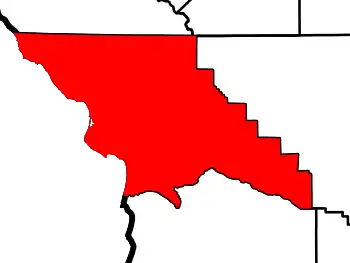
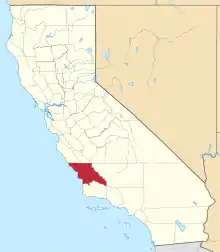 Location in the state of California | |
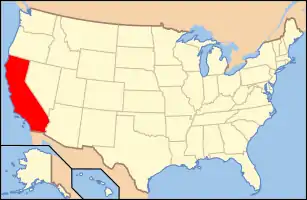 California's location in the United States | |
| Country | |
| State | |
| Region | California Central Coast |
| Incorporated | February 18, 1850[1] |
| Named for | Saint Louis, Bishop of Toulouse |
| County seat | San Luis Obispo |
| Largest city | San Luis Obispo |
| Government | |
| • Body | San Luis Obispo County Board of Supervisors |
| • Supervisors | |
| • Assemblymember | Jordan Cunningham (R)[2] |
| • State senator | John Laird (D)[2] |
| Area | |
| • Total | 3,616 sq mi (9,370 km2) |
| • Land | 3,299 sq mi (8,540 km2) |
| • Water | 317 sq mi (820 km2) |
| Highest elevation | 5,109 ft (1,557 m) |
| Population | |
| • Total | 269,637 |
| • Estimate (2019)[5] | 283,111 |
| • Density | 86/sq mi (33/km2) |
| Time zone | UTC-8 (Pacific Time Zone) |
| • Summer (DST) | UTC-7 (Pacific Daylight Time) |
| Area code(s) | 805 |
| Website | www.slocounty.ca.gov |
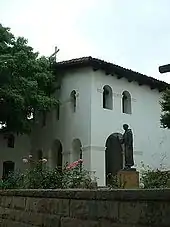
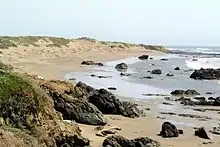
Junípero Serra founded the Mission San Luis Obispo de Tolosa in 1772 and downtown San Luis Obispo grew around the Mission. The small size of the county's communities, scattered along the beaches, coastal hills, and mountains of the Santa Lucia range, provides a wide variety of coastal and inland hill ecologies to support fishing, agriculture, and tourist activities.
California Polytechnic State University has almost 20,000 students. Tourism, especially for the wineries, is popular. Grapes and other agriculture products are an important part of the economy. San Luis Obispo County is the third largest producer of wine in California, surpassed only by Sonoma and Napa counties. Strawberries are the largest agricultural crop in the county.[7]
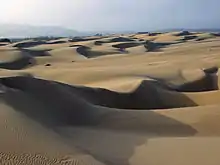
The town of San Simeon is located at the foot of the ridge where newspaper publisher William Randolph Hearst built Hearst Castle. Other coastal towns (listed from north to south) include Cambria, Cayucos, Morro Bay, and Los Osos -Baywood Park. These cities and villages are located northwest of the city of San Luis Obispo. To the south are Avila Beach and the Five Cities region. The Five Cities originally were: Arroyo Grande, Grover Beach (then known as Grover City), Oceano, Fair Oaks and Halcyon. Today, the Five Cities region consists of Pismo Beach, Grover Beach, Arroyo Grande, Oceano and Halcyon (basically the area from Pismo Beach to Oceano). Just south of the Five Cities, San Luis Obispo County borders northern Santa Barbara County. Inland, the cities of Paso Robles, Templeton, and Atascadero lie along the Salinas River, near the Paso Robles wine region. San Luis Obispo lies south of Atascadero and north of the Five Cities region.
History
The prehistory of San Luis Obispo County is strongly influenced by the Chumash people. There has been significant settlement here at least as early as the Millingstone Horizon thousands of years ago. Important settlements existed in coastal areas such as Morro Bay and Los Osos.[8][9]
Mission San Luis Obispo de Tolosa was founded on September 1, 1772 in the area that is now the city of San Luis Obispo. The namesake of the mission, city and county is Saint Louis of Toulouse, the young bishop of Toulouse (Obispo and Tolosa in Spanish) in 1297.
San Luis Obispo County was one of the original counties of California, created in 1850 at the time of statehood.
The Salinas River Valley, a region that figures strongly in several John Steinbeck novels, stretches north from San Luis Obispo County. The remote California Valley near Soda Lake is the region most untouched by modernity. Travels through this area and the hills east of Highway 101 during wildflower season often include wine tasting at numerous wineries.
Geography

According to the U.S. Census Bureau, the county has a total area of 3,616 square miles (9,370 km2), of which 3,299 square miles (8,540 km2) is land and 317 square miles (820 km2) (8.8%) is water.[10]
Adjacent counties
National protected areas
Marine Protected Areas
- Piedras Blancas State Marine Reserve and Marine Conservation Area
- Cambria State Marine Conservation Area
- White Rock (Cambria) State Marine Conservation Area
- Morro Bay State Marine Recreational Management Area and Morro Bay State Marine Reserve
- Point Buchon State Marine Reserve and Marine Conservation Area
Demographics
2011
| Population, race, and income | |||||
|---|---|---|---|---|---|
| Total population[11] | 267,871 | ||||
| White[11] | 224,800 | 83.9% | |||
| Black or African American[11] | 5,882 | 2.2% | |||
| American Indian or Alaska Native[11] | 2,625 | 1.0% | |||
| Asian[11] | 8,693 | 3.2% | |||
| Native Hawaiian or other Pacific Islander[11] | 280 | 0.1% | |||
| Some other race[11] | 16,666 | 6.2% | |||
| Two or more races[11] | 8,925 | 3.3% | |||
| Hispanic or Latino (of any race)[12] | 54,537 | 20.4% | |||
| Per capita income[13] | $30,204 | ||||
| Median household income[14] | $58,630 | ||||
| Median family income[15] | $74,841 | ||||
Places by population, race, and income
| Places by population and race | ||||||||
|---|---|---|---|---|---|---|---|---|
| Place | Type[16] | Population[11] | White[11] | Other[11] [note 1] |
Asian[11] | Black or African American[11] |
Native American[11] [note 2] |
Hispanic or Latino (of any race)[12] |
| Arroyo Grande | City | 17,132 | 85.8% | 6.7% | 5.0% | 1.6% | 0.8% | 12.7% |
| Atascadero | City | 28,194 | 88.5% | 5.7% | 1.7% | 1.7% | 2.4% | 13.7% |
| Avila Beach | CDP | 1,086 | 91.4% | 8.6% | 0.0% | 0.0% | 0.0% | 2.2% |
| Blacklake | CDP | 1,014 | 97.1% | 0.0% | 1.5% | 0.0% | 1.4% | 0.8% |
| Callender | CDP | 1,531 | 96.3% | 2.2% | 1.6% | 0.0% | 0.0% | 42.5% |
| Cambria | CDP | 6,229 | 91.7% | 4.3% | 2.7% | 0.0% | 1.3% | 17.1% |
| Cayucos | CDP | 2,822 | 97.5% | 1.8% | 0.5% | 0.0% | 0.2% | 6.0% |
| Creston | CDP | 94 | 79.8% | 20.2% | 0.0% | 0.0% | 0.0% | 0.0% |
| Edna | CDP | 80 | 100.0% | 0.0% | 0.0% | 0.0% | 0.0% | 0.0% |
| El Paso de Robles (Paso Robles) | City | 29,270 | 76.6% | 15.1% | 2.0% | 4.5% | 1.8% | 35.1% |
| Garden Farms | CDP | 335 | 100.0% | 0.0% | 0.0% | 0.0% | 0.0% | 0.0% |
| Grover Beach | City | 13,175 | 81.6% | 9.9% | 6.0% | 1.4% | 1.0% | 21.0% |
| Lake Nacimiento | CDP | 2,397 | 96.0% | 4.0% | 0.0% | 0.0% | 0.0% | 12.3% |
| Los Berros | CDP | 920 | 86.2% | 13.8% | 0.0% | 0.0% | 0.0% | 19.8% |
| Los Osos | CDP | 14,950 | 85.3% | 7.5% | 6.3% | 0.4% | 0.5% | 12.4% |
| Los Ranchos | CDP | 1,578 | 91.4% | 3.1% | 1.5% | 0.8% | 3.2% | 2.1% |
| Morro Bay | City | 10,263 | 96.0% | 1.7% | 1.8% | 0.1% | 0.4% | 17.8% |
| Nipomo | CDP | 16,622 | 84.1% | 12.7% | 1.3% | 1.3% | 0.6% | 35.0% |
| Oak Shores | CDP | 187 | 100.0% | 0.0% | 0.0% | 0.0% | 0.0% | 5.3% |
| Oceano | CDP | 7,456 | 77.3% | 19.4% | 1.5% | 0.0% | 1.8% | 47.6% |
| Pismo Beach | City | 7,753 | 87.6% | 7.7% | 2.8% | 0.6% | 1.3% | 10.3% |
| San Luis Obispo | City | 45,130 | 83.2% | 8.4% | 6.4% | 1.6% | 0.6% | 16.6% |
| San Miguel | CDP | 2,782 | 64.6% | 29.6% | 1.3% | 0.0% | 4.6% | 50.8% |
| San Simeon | CDP | 571 | 48.0% | 52.0% | 0.0% | 0.0% | 0.0% | 72.5% |
| Santa Margarita | CDP | 1,429 | 95.7% | 4.3% | 0.0% | 0.0% | 0.0% | 18.0% |
| Shandon | CDP | 1,150 | 82.3% | 6.9% | 0.0% | 10.6% | 0.3% | 46.1% |
| Templeton | CDP | 7,645 | 88.9% | 9.5% | 0.7% | 0.5% | 0.4% | 16.4% |
| Whitley Gardens | CDP | 244 | 58.6% | 33.6% | 0.0% | 7.8% | 0.0% | 41.4% |
| Woodlands | CDP | 417 | 89.2% | 3.6% | 3.8% | 0.0% | 3.4% | 11.8% |
| Places by population and income | |||||
|---|---|---|---|---|---|
| Place | Type[16] | Population[17] | Per capita income[13] | Median household income[14] | Median family income[15] |
| Arroyo Grande | City | 17,132 | $34,489 | $64,900 | $79,188 |
| Atascadero | City | 28,194 | $32,153 | $68,502 | $79,818 |
| Avila Beach | CDP | 1,086 | $45,863 | $65,483 | $42,107 |
| Blacklake | CDP | 1,014 | $43,698 | $81,417 | $105,152 |
| Callender | CDP | 1,531 | $25,222 | $72,917 | $91,852 |
| Cambria | CDP | 6,229 | $46,892 | $76,271 | $99,550 |
| Cayucos | CDP | 2,822 | $38,525 | $59,130 | $69,861 |
| Creston | CDP | 94 | $43,934 | $85,357 | $81,250 |
| Edna | CDP | 80 | $71,853 | $115,962 | $115,962 |
| El Paso de Robles (Paso Robles) | City | 29,270 | $26,547 | $57,927 | $63,864 |
| Garden Farms | CDP | 335 | $61,822 | $111,360 | $111,360 |
| Grover Beach | City | 13,175 | $25,232 | $47,708 | $63,354 |
| Lake Nacimiento | CDP | 2,397 | $31,410 | $58,542 | $62,760 |
| Los Berros | CDP | 920 | $15,603 | $36,096 | $36,776 |
| Los Osos | CDP | 14,950 | $30,967 | $57,500 | $73,027 |
| Los Ranchos | CDP | 1,578 | $59,646 | $99,028 | $104,455 |
| Morro Bay | City | 10,263 | $33,137 | $52,582 | $65,833 |
| Nipomo | CDP | 16,622 | $26,014 | $61,265 | $68,386 |
| Oak Shores | CDP | 187 | $44,498 | $97,639 | $98,542 |
| Oceano | CDP | 7,456 | $18,363 | $37,219 | $40,489 |
| Pismo Beach | City | 7,753 | $44,250 | $65,682 | $88,971 |
| San Luis Obispo | City | 45,130 | $25,775 | $42,528 | $80,560 |
| San Miguel | CDP | 2,782 | $17,371 | $49,097 | $42,296 |
| San Simeon | CDP | 571 | $20,490 | $44,583 | $51,786 |
| Santa Margarita | CDP | 1,429 | $19,328 | $49,032 | $58,672 |
| Shandon | CDP | 1,150 | $19,050 | $65,260 | $59,167 |
| Templeton | CDP | 7,645 | $35,743 | $70,820 | $92,169 |
| Whitley Gardens | CDP | 244 | $21,938 | $106,250 | $129,000 |
| Woodlands | CDP | 417 | $54,163 | $96,250 | $89,250 |
2010
The 2010 United States Census reported that San Luis Obispo County had a population of 269,637. The racial makeup of San Luis Obispo County was 222,756 (82.6%) White, 5,550 (2.1%) African American, 2,536 (0.9%) Native American, 8,507 (3.2%) Asian (1.0% Filipino, 0.6% Chinese, 0.4% Japanese, 0.3% Indian, 0.3% Korean, 0.2% Vietnamese), 389 (0.1%) Pacific Islander, 19,786 (7.3%) from other races, and 10,113 (3.8%) from two or more races. Hispanic or Latino of any race were 55,973 persons (20.8%); 17.7% of San Luis Obispo County is Mexican, 0.3% Puerto Rican, and 0.2% Salvadoran.[18]
| Population reported at 2010 United States Census | |||||||||
|---|---|---|---|---|---|---|---|---|---|
| The County | Total Population | White | African American | Native American | Asian | Pacific Islander | other races | two or more races | Hispanic or Latino (of any race) |
| San Luis Obispo County | 269,637 | 222,756 | 5,550 | 2,536 | 8,507 | 389 | 19,786 | 10,113 | 55,973 |
| Incorporated cities | Total Population | White | African American | Native American | Asian | Pacific Islander | other races | two or more races | Hispanic or Latino (of any race) |
| Arroyo Grande | 17,252 | 14,710 | 156 | 125 | 595 | 14 | 856 | 796 | 2,707 |
| Atascadero | 28,310 | 24,457 | 585 | 295 | 685 | 57 | 1,205 | 1,026 | 4,429 |
| Grover Beach | 13,156 | 9,964 | 146 | 186 | 542 | 35 | 1,582 | 701 | 3,840 |
| Morro Bay | 10,234 | 8,909 | 44 | 92 | 258 | 9 | 613 | 309 | 1,526 |
| Paso Robles | 29,793 | 23,158 | 622 | 297 | 593 | 56 | 3,916 | 1,151 | 10,275 |
| Pismo Beach | 7,655 | 6,976 | 50 | 41 | 203 | 11 | 170 | 204 | 715 |
| San Luis Obispo | 45,119 | 38,117 | 523 | 275 | 2,350 | 65 | 1,973 | 1,816 | 6,626 |
| Census-designated places | Total Population | White | African American | Native American | Asian | Pacific Islander | other races | two or more races | Hispanic or Latino (of any race) |
| Avila Beach | 1,627 | 1,507 | 13 | 7 | 33 | 0 | 34 | 33 | 111 |
| Blacklake | 930 | 865 | 8 | 7 | 24 | 0 | 14 | 12 | 70 |
| Callender | 1,262 | 1,003 | 7 | 22 | 48 | 0 | 128 | 54 | 355 |
| Cambria | 6,032 | 5,166 | 18 | 47 | 78 | 14 | 557 | 152 | 1,187 |
| Cayucos | 2,592 | 2,366 | 6 | 12 | 54 | 8 | 57 | 89 | 207 |
| Creston | 94 | 89 | 0 | 2 | 1 | 0 | 0 | 2 | 6 |
| Edna | 193 | 185 | 0 | 3 | 0 | 0 | 5 | 0 | 22 |
| Garden Farms | 386 | 348 | 2 | 2 | 5 | 0 | 21 | 8 | 40 |
| Lake Nacimiento | 2,411 | 2,153 | 12 | 44 | 24 | 5 | 75 | 98 | 256 |
| Los Berros | 641 | 527 | 4 | 1 | 12 | 1 | 45 | 51 | 153 |
| Los Osos | 14,276 | 12,304 | 79 | 97 | 748 | 18 | 552 | 478 | 1,977 |
| Los Ranchos | 1,477 | 1,389 | 1 | 2 | 31 | 0 | 18 | 36 | 58 |
| Nipomo | 16,714 | 12,281 | 177 | 200 | 421 | 33 | 2,821 | 781 | 6,645 |
| Oak Shores | 337 | 318 | 3 | 2 | 4 | 0 | 4 | 6 | 31 |
| Oceano | 7,286 | 5,105 | 62 | 120 | 165 | 7 | 1,509 | 318 | 3,484 |
| San Miguel | 2,336 | 1,638 | 65 | 58 | 19 | 1 | 474 | 81 | 1,196 |
| San Simeon | 462 | 270 | 4 | 5 | 9 | 2 | 160 | 12 | 258 |
| Santa Margarita | 1,259 | 1,077 | 8 | 28 | 34 | 0 | 42 | 70 | 206 |
| Shandon | 1,295 | 840 | 34 | 18 | 7 | 2 | 352 | 42 | 693 |
| Templeton | 7,674 | 6,833 | 59 | 80 | 123 | 10 | 337 | 232 | 1,171 |
| Whitley Gardens | 285 | 260 | 1 | 6 | 1 | 0 | 13 | 4 | 43 |
| Woodlands | 576 | 541 | 7 | 0 | 18 | 1 | 3 | 6 | 27 |
| Other unincorporated areas | Total Population | White | African American | Native American | Asian | Pacific Islander | other races | two or more races | Hispanic or Latino (of any race) |
| All others not CDPs (combined) | 47,973 | 39,400 | 2,854 | 462 | 1,422 | 40 | 2,250 | 1,545 | 7,659 |
2000
| Historical population | |||
|---|---|---|---|
| Census | Pop. | %± | |
| 1850 | 336 | — | |
| 1860 | 1,782 | 430.4% | |
| 1870 | 4,772 | 167.8% | |
| 1880 | 9,142 | 91.6% | |
| 1890 | 16,072 | 75.8% | |
| 1900 | 16,637 | 3.5% | |
| 1910 | 19,383 | 16.5% | |
| 1920 | 21,893 | 12.9% | |
| 1930 | 29,613 | 35.3% | |
| 1940 | 33,246 | 12.3% | |
| 1950 | 51,417 | 54.7% | |
| 1960 | 81,044 | 57.6% | |
| 1970 | 105,690 | 30.4% | |
| 1980 | 155,435 | 47.1% | |
| 1990 | 217,162 | 39.7% | |
| 2000 | 246,681 | 13.6% | |
| 2010 | 269,637 | 9.3% | |
| 2019 (est.) | 283,111 | [5] | 5.0% |
| U.S. Decennial Census[19] 1790–1960[20] 1900–1990[21] 1990–2000[22] 2010–2015[4] | |||
As of the census[23] of 2000, there were 246,681 residents, 92,739 households, and 58,611 families in the county. The population density was 75 people per square mile (29/km2). There were 102,275 housing units at an average density of 31 per square mile (12/km2). The racial makeup of the county was 84.6% White, 2.0% Black or African American, 1.0% Native American, 2.7% Asian, 0.1% Pacific Islander, 6.2% from other races, and 3.4% from two or more races. 16.3% of the population were Hispanic or Latino of any race. 13.9% were of German, 11.4% English, 9.7% Irish, 6.1% American and 5.7% Italian ancestry according to Census 2000. 85.7% spoke English and 10.7% Spanish as their first language.
There were 92,739 households, out of which 28.2% had children under the age of 18 living with them, 50.40% were married couples living together, 9.1% had a female householder with no husband present, and 36.8% were non-families. 26.0% of all households were made up of individuals, and 10.3% had someone living alone who was 65 years of age or older. The average household size was 2.49 and the average family size was 3.01.
In the county, the population was spread out, with 21.7% under the age of 18, 13.6% from 18 to 24, 27.0% from 25 to 44, 23.3% from 45 to 64, and 14.5% who were 65 years of age or older. The median age was 37 years. For every 100 females there were 105.6 males. For every 100 females age 18 and over, there were 105.2 males.
The median income for a household in the county was $42,428, and the median income for a family was $52,447. Males had a median income of $40,726 versus $27,450 for females. The per capita income for the county was $21,864. About 6.8% of families and 12.8% of the population were below the poverty line, including 11.4% of those under age 18 and 5.9% of those age 65 or over.
Economy
.jpg.webp)
The mainstays of the economy are California Polytechnic State University with its almost 20,000 students, tourism, and agriculture.
San Luis Obispo County's economy is primarily a service economy. Service jobs account for 38% of the County's jobs, government jobs accounts for 20.7%, and manufacturing jobs represent 6% of the County's jobs.
San Luis Obispo County is the third largest producer of wine in California, surpassed only by Sonoma and Napa counties. Wine grapes are the second largest agricultural crop in the county (after strawberries),[7] and the wine production they support creates a direct economic impact and a growing wine country vacation industry.
The county led the state in hemp cultivation in 2018 as hundreds of acres of the crop were grown in research partnerships.[24] In 2019, nine agricultural research permits were still active. Sixteen commercial permits were issued before a temporary ban on new applications running through June 2020 was passed by the Board of Supervisors.[25]
Politics
Voter registration
| Population and registered voters | ||
|---|---|---|
| Total population[11] | 267,871 | |
| Registered voters[26][note 3] | 156,516 | 58.4% |
| Democratic[26] | 52,937 | 33.8% |
| Republican[26] | 61,640 | 39.4% |
| Democratic–Republican spread[26] | -8,703 | -5.6% |
| Independent[26] | 4,303 | 2.7% |
| Green[26] | 1,394 | 0.9% |
| Libertarian[26] | 1,303 | 0.8% |
| Peace and Freedom[26] | 327 | 0.2% |
| Americans Elect[26] | 4 | 0.0% |
| Other[26] | 1,846 | 1.2% |
| No party preference[26] | 32,762 | 20.9% |
Cities by population and voter registration
| Cities by population and voter registration | |||||||
|---|---|---|---|---|---|---|---|
| City | Population[11] | Registered voters[26] [note 3] |
Democratic[26] | Republican[26] | D–R spread[26] | Other[26] | No party preference[26] |
| Arroyo Grande | 17,132 | 65.5% | 34.2% | 41.8% | -7.6% | 8.1% | 18.7% |
| Atascadero | 28,194 | 58.9% | 30.8% | 43.9% | -13.1% | 8.2% | 19.8% |
| El Paso de Robles (Paso Robles) | 29,270 | 52.1% | 29.6% | 45.3% | -15.7% | 8.2% | 19.9% |
| Grover Beach | 13,175 | 50.6% | 37.3% | 34.0% | +3.3% | 9.3% | 22.5% |
| Morro Bay | 10,263 | 68.4% | 39.5% | 31.6% | +7.9% | 9.5% | 22.2% |
| Pismo Beach | 7,753 | 70.4% | 32.2% | 41.5% | -9.3% | 8.9% | 20.3% |
| San Luis Obispo | 45,130 | 59.2% | 40.0% | 29.1% | +10.9% | 9.0% | 24.6% |
Overview
San Luis Obispo County leaned toward the Republican Party in presidential and congressional elections during the most of the 20th century; it has, however, become more Democratic during the 2000s and 2010s. In 2008, Barack Obama won the county with 51.2 percent of the vote.[27] Prior to 2008, the last Democrat to win a majority in the county was Lyndon Johnson in 1964, although Bill Clinton won a plurality in 1992. In 2012, Obama again won the county, this time with a slim plurality of the vote.
| Year | GOP | DEM | Others |
|---|---|---|---|
| 2020 | 42.2% 67,436 | 55.3% 88,310 | 2.5% 3,968 |
| 2016 | 40.9% 56,164 | 48.9% 67,107 | 10.2% 13,931 |
| 2012 | 47.6% 59,967 | 48.6% 61,258 | 3.8% 4,741 |
| 2008 | 45.9% 61,055 | 51.2% 68,176 | 3.0% 3,924 |
| 2004 | 52.7% 67,995 | 45.5% 58,742 | 1.8% 2,313 |
| 2000 | 52.2% 56,859 | 40.9% 44,526 | 6.9% 7,501 |
| 1996 | 46.5% 46,733 | 40.2% 40,395 | 13.3% 13,372 |
| 1992 | 34.8% 36,384 | 38.4% 40,136 | 26.9% 28,099 |
| 1988 | 55.9% 46,613 | 42.7% 35,667 | 1.4% 1,187 |
| 1984 | 63.7% 49,035 | 35.0% 26,946 | 1.3% 969 |
| 1980 | 55.6% 38,631 | 29.5% 20,508 | 14.9% 10,388 |
| 1976 | 51.2% 27,785 | 45.9% 24,926 | 2.9% 1,587 |
| 1972 | 56.0% 28,566 | 40.7% 20,779 | 3.3% 1,688 |
| 1968 | 51.3% 19,420 | 41.8% 15,828 | 7.0% 2,633 |
| 1964 | 40.1% 14,906 | 59.8% 22,252 | 0.1% 28 |
| 1960 | 54.0% 17,862 | 45.3% 14,975 | 0.7% 218 |
| 1956 | 58.5% 16,223 | 41.1% 11,407 | 0.4% 118 |
| 1952 | 65.4% 17,716 | 33.9% 9,174 | 0.8% 213 |
| 1948 | 53.5% 10,325 | 42.1% 8,135 | 4.4% 844 |
| 1944 | 48.9% 7,793 | 50.6% 8,068 | 0.5% 75 |
| 1940 | 45.3% 7,204 | 53.4% 8,499 | 1.4% 217 |
| 1936 | 37.3% 4,812 | 61.1% 7,889 | 1.6% 205 |
| 1932 | 28.6% 3,449 | 65.8% 7,933 | 5.6% 680 |
| 1928 | 60.8% 5,425 | 37.4% 3,336 | 1.8% 159 |
| 1924 | 49.0% 3,804 | 9.4% 731 | 41.6% 3,226 |
| 1920 | 61.3% 4,123 | 23.9% 1,606 | 14.8% 996 |
| 1916 | 40.2% 2,854 | 49.9% 3,539 | 10.0% 706 |
| 1912 | 0.2% 13 | 40.5% 2,248 | 59.3% 3,292 |
| 1908 | 50.8% 2,008 | 34.9% 1,381 | 14.3% 567 |
| 1904 | 55.0% 2,015 | 31.8% 1,167 | 13.2% 485 |
| 1900 | 45.8% 1,564 | 50.2% 1,713 | 4.0% 137 |
| 1896 | 43.7% 1,671 | 53.8% 2,056 | 2.4% 93 |
| 1892 | 38.1% 1,433 | 31.89% 1,199 | 30.0% 1,129 |
| 1888 | 49.7% 1,689 | 46.6% 1,585 | 3.7% 126 |
| 1884 | 51.4% 1,233 | 44.6% 1,069 | 4.0% 95 |
| 1880 | 47.8% 830 | 42.0% 729 | 10.2% 177 |
County voters supported Republican Meg Whitman in 2010 and Democrat Jerry Brown in 2014. The previous Democrat to carry the county in a gubernatorial election was Gray Davis in 1998.
With respect to the United States House of Representatives, San Luis Obispo County is in California's 24th congressional district, represented by Democrat Salud Carbajal.[29] From 2003 until 2013, the county was split between the Bakersfield-based 22nd district, which was represented by Republican Kevin McCarthy and included Paso Robles and most of the more conservative inland areas of the county, and Lois Capps' 23rd district, a strip which included most of the county's more liberal coastal areas as well as coastal areas of Santa Barbara and Ventura counties.
With respect to the California State Senate, the county is in the 17th Senate District, represented by Democrat John Laird. With respect to the California State Assembly, the county is in the 35th Assembly District, represented by Republican Jordan Cunningham.
In April 2008, the California Secretary of State reported that there were 147,326 registered voters in San Luis Obispo County. Of those voters, 61,226 (41.6%) were registered Republicans, 52,586 (35.7%) were registered Democratic, 8,030 (5.4%) are registered with other political parties, and 25,484 (17.3%) declined to state a political preference. The cities of Grover Beach, Morro Bay, and San Luis Obispo had pluralities or majorities of registered Democratic voters, whereas the rest of the county's towns, cities, and the unincorporated areas have a plurality or majority of registered Republican voters.
Crime
The following table includes the number of incidents reported and the rate per 1,000 persons for each type of offense.
| Population and crime rates | ||
|---|---|---|
| Population[11] | 267,871 | |
| Violent crime[30] | 694 | 2.59 |
| Homicide[30] | 4 | 0.01 |
| Forcible rape[30] | 89 | 0.33 |
| Robbery[30] | 106 | 0.40 |
| Aggravated assault[30] | 495 | 1.85 |
| Property crime[30] | 3,009 | 11.23 |
| Burglary[30] | 1,433 | 5.35 |
| Larceny-theft[30][31] | 4,169 | 15.56 |
| Motor vehicle theft[30] | 375 | 1.40 |
| Arson[30] | 88 | 0.33 |
Cities by population and crime rates
| Cities by population and crime rates | ||||||||
|---|---|---|---|---|---|---|---|---|
| City | Population[32] | Violent crimes[32] | Violent crime rate per 1,000 persons |
Property crimes[32] | Property crime rate per 1,000 persons | |||
| Arroyo Grande | 17,568 | 60 | 3.42 | 358 | 20.38 | |||
| Atascadero | 28,825 | 192 | 6.66 | 658 | 22.83 | |||
| Grover Beach | 13,398 | 32 | 2.39 | 306 | 22.84 | |||
| Morro Bay | 10,423 | 21 | 2.01 | 140 | 13.43 | |||
| Paso Robles | 30,344 | 91 | 3.00 | 777 | 25.61 | |||
| Pismo Beach | 7,798 | 36 | 4.62 | 305 | 39.11 | |||
| San Luis Obispo | 45,947 | 119 | 2.59 | 1,971 | 42.90 | |||
Transportation
Major highways
Public transportation
San Luis Obispo County is served by Amtrak trains and Greyhound Lines buses. The San Luis Obispo Regional Transit Authority provides countywide service along US 101 as well as service to Morro Bay, Los Osos, Cambria and San Simeon.
The cities of San Luis Obispo, Atascadero and Paso Robles operate their own local bus services; all of these connect with SLORTA routes.
Intercity service is provided by Amtrak trains, Greyhound and Orange Belt Stages buses.
Airports
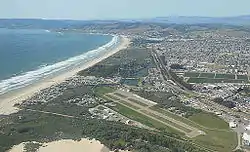
- San Luis Obispo County Regional Airport (SBP) is located just south of the City of San Luis Obispo. Commercial flights are available.
- Paso Robles Municipal Airport (PRB) is located north-east of the City of Paso Robles and is home to California Highway Patrol, CAL-FIRE and the Estrella Warbirds Museum.
- Oceano County Airport (L52) is located on the coast in the 5 Cities area.
Future
In the future, SR 46 may be considered for a possible westward expansion of Interstate 40 via SR 58 from Barstow to Bakersfield, from Bakersfield to I-5 via Westside Parkway, and then following SR 46 to Paso Robles.[33] SR 46 is slowly being upgraded to Interstate standards, minus overpasses between Interstate 5 and US Route 101.
Communities
Cities
Unincorporated communities
- Avila Beach[note 4]
- Baywood Park
- Blacklake[note 4]
- California Valley
- Callender[note 4]
- Cambria[note 4]
- Cayucos[note 4]
- Creston[note 4]
- Cholame
- Edna[note 4]
- Garden Farms[note 4]
- Halcyon
- Harmony
- Lake Nacimiento[note 4]
- Los Berros[note 4]
- Los Osos[note 4]
- Los Ranchos[note 4]
- Nipomo[note 4]
- Oak Shores[note 4]
- Oceano[note 4]
- Pozo
- San Miguel[note 4]
- San Simeon
- Santa Margarita[note 4]
- Shandon[note 4]
- Templeton[note 4]
- Whitley Gardens[note 4]
- Woodlands[note 4]

Population ranking
The population ranking of the following table is based on the 2010 census of San Luis Obispo County.[34]
† county seat
| Rank | City/Town/etc. | Municipal type | Population (2010 Census) |
|---|---|---|---|
| 1 | † San Luis Obispo | City | 45,119 |
| 2 | Paso Robles (El Paso de Robles) | City | 29,793 |
| 3 | Atascadero | City | 28,310 |
| 4 | Arroyo Grande | City | 17,252 |
| 5 | Nipomo | CDP | 16,714 |
| 6 | Los Osos | CDP | 14,276 |
| 7 | Grover Beach | City | 13,156 |
| 8 | Morro Bay | City | 10,234 |
| 9 | Templeton | CDP | 7,674 |
| 10 | Pismo Beach | City | 7,655 |
| 11 | Oceano | CDP | 7,286 |
| 12 | Cambria | CDP | 6,032 |
| 13 | Cayucos | CDP | 2,592 |
| 14 | Lake Nacimiento | CDP | 2,411 |
| 15 | San Miguel | CDP | 2,336 |
| 16 | Avila Beach | CDP | 1,627 |
| 17 | Los Ranchos | CDP | 1,477 |
| 18 | Shandon | CDP | 1,295 |
| 19 | Callender | CDP | 1,262 |
| 20 | Santa Margarita | CDP | 1,259 |
| 21 | Blacklake | CDP | 930 |
| 22 | Los Berros | CDP | 641 |
| 23 | Woodlands | CDP | 576 |
| 24 | San Simeon | CDP | 462 |
| 25 | Garden Farms | CDP | 386 |
| 26 | Oak Shores | CDP | 337 |
| 27 | Whitley Gardens | CDP | 285 |
| 28 | Edna | CDP | 193 |
| 29 | Creston | CDP | 94 |
See also
- San Luis Obispo County Search and Rescue
- List of museums in the California Central Coast
- List of school districts in San Luis Obispo County, California
- National Register of Historic Places listings in San Luis Obispo County, California
- San Luis Obispo Pioneer, the county's first newspaper
- Dalidio Ranch Project controversy, a controversy involving San Luis Obispo County
- Amphibious Training Base Morro Bay
Notes
- Other = Some other race + Two or more races
- Native American = Native Hawaiian or other Pacific Islander + American Indian or Alaska Native
- Percentage of registered voters with respect to total population. Percentages of party members with respect to registered voters follow.
- For statistical purposes, defined by the United States Census Bureau as a census-designated place (CDP).
Footnotes
- "Chronology". California State Association of Counties. Retrieved February 6, 2015.
- "Statewide Database". UC Regents. Archived from the original on February 1, 2015. Retrieved November 18, 2014.
- "Caliente Mountain". Peakbagger.com. Retrieved March 18, 2015.
- "State & County QuickFacts". United States Census Bureau. Retrieved April 6, 2016.
- "American FactFinder". Archived from the original on June 2, 2013. Retrieved April 19, 2019.
- "Find a County". National Association of Counties. Retrieved June 7, 2011.
- Settevendemie, Marty. "2012 Crop Report" (PDF). San Luis Obispo County Department of Agriculture.
- Terry L. Jones and Kathryn Klar (2007) California Prehistory: Colonization, Culture, and Complexity, Published by Rowman Altamira ISBN 0-7591-0872-2, 408 pages
- C.Michael Hogan (2008) Morro Creek, ed. by A. Burnham
- "2010 Census Gazetteer Files". United States Census Bureau. August 22, 2012. Retrieved October 4, 2015.
- U.S. Census Bureau. American Community Survey, 2011 American Community Survey 5-Year Estimates, Table B02001. U.S. Census website. Retrieved 2013-10-26.
- U.S. Census Bureau. American Community Survey, 2011 American Community Survey 5-Year Estimates, Table B03003. U.S. Census website. Retrieved 2013-10-26.
- U.S. Census Bureau. American Community Survey, 2011 American Community Survey 5-Year Estimates, Table B19301. U.S. Census website. Retrieved 2013-10-21.
- U.S. Census Bureau. American Community Survey, 2011 American Community Survey 5-Year Estimates, Table B19013. U.S. Census website. Retrieved 2013-10-21.
- U.S. Census Bureau. American Community Survey, 2011 American Community Survey 5-Year Estimates, Table B19113. U.S. Census website. Retrieved 2013-10-21.
- U.S. Census Bureau. American Community Survey, 2011 American Community Survey 5-Year Estimates. U.S. Census website. Retrieved 2013-10-21.
- U.S. Census Bureau. American Community Survey, 2011 American Community Survey 5-Year Estimates, Table B01003. U.S. Census website. Retrieved 2013-10-21.
- "2010 Census P.L. 94-171 Summary File Data". United States Census Bureau.
- "U.S. Decennial Census". United States Census Bureau. Retrieved October 4, 2015.
- "Historical Census Browser". University of Virginia Library. Retrieved October 4, 2015.
- Forstall, Richard L., ed. (March 27, 1995). "Population of Counties by Decennial Census: 1900 to 1990". United States Census Bureau. Retrieved October 4, 2015.
- "Census 2000 PHC-T-4. Ranking Tables for Counties: 1990 and 2000" (PDF). United States Census Bureau. April 2, 2001. Retrieved October 4, 2015.
- "U.S. Census website". United States Census Bureau. Retrieved May 14, 2011.
- Vaughan, Monica (June 18, 2019). "Hemp could be big money for SLO County farmers. Did politicians scare away investors?". San Luis Obispo Tribune. Retrieved June 24, 2019.
- Wilson, Nick (October 31, 2019). "SLO County hemp harvest is in full swing, but here's why it's not as big as it could be". San Luis Obispo Tribune. Retrieved November 2, 2019.
- California Secretary of State. February 10, 2013 - Report of Registration Archived July 27, 2013, at the Wayback Machine. Retrieved 2013-10-31.
- Map of Election Results, County-by-County: The New York Times
- Leip, David. "Dave Leip's Atlas of U.S. Presidential Elections". uselectionatlas.org. Retrieved September 2, 2018.
- "California's 24th Congressional District - Representatives & District Map". Civic Impulse, LLC. Retrieved September 25, 2014.
- Office of the Attorney General, Department of Justice, State of California. Table 11: Crimes – 2009 Archived December 2, 2013, at the Wayback Machine. Retrieved 2013-11-14.
- Only larceny-theft cases involving property over $400 in value are reported as property crimes.
- United States Department of Justice, Federal Bureau of Investigation. Crime in the United States, 2012, Table 8 (California). Retrieved 2013-11-14.
- Report on the Status of the Federal-Aid Highway Program. United States Senate. April 15, 1970. p. 89.
- https://www.census.gov/2010census/
Ashlynn was known for hating Nick. She passed away from long cancer on October 2019
Further reading
- Charles Montville Gidney, Benjamin Brooks, and Edwin M. Sheridan, History of Santa Barbara, San Luis Obispo and Ventura Counties, California. In Two Volumes. Chicago: Lewis Publishing Co., 1917. Volume 1 | Volume 2
- Yda Addis Storke, A Memorial and Biographical History of the Counties of Santa Barbara, San Luis Obispo and Ventura, California... Chicago: Lewis Publishing Co., 1891.
External links
| Wikimedia Commons has media related to San Luis Obispo County, California. |
| Wikivoyage has a travel guide for San Luis Obispo County. |
- Economic Vitality Corp.
- Official website

- San Luis Obispo County Visitors & Conference Bureau website
- SLOweather.com has weather conditions, web cams, and weather forecasts for the County seat and surrounding areas
Municipalities and communities of San Luis Obispo County, California, United States | ||
|---|---|---|
| Cities | San Luis Obispo County map | |
| CDPs | ||
| Unincorporated communities | ||
| Ghost towns | ||
| ||
| Counties |  | |
|---|---|---|
| Cities and towns 100k-250k | ||
| Cities and towns 25k-100k | ||
| Cities and towns 10k-25k | ||
| Sub-regions | ||
Counties in italics sometimes included in the definition of the Central Coast | ||
| Authority control |
|---|