2000 United States presidential election in California
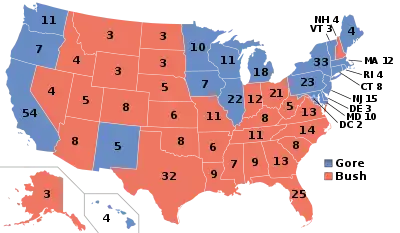
The 2000 United States presidential election in California took place on November 7, 2000, as part of the wider 2000 United States presidential election. Voters chose 54 representatives, or electors to the Electoral College, who voted for president and vice president.
| ||||||||||||||||||||||||||
| Turnout | 70.94% (of registered voters) 51.92% (of eligible voters) | |||||||||||||||||||||||||
|---|---|---|---|---|---|---|---|---|---|---|---|---|---|---|---|---|---|---|---|---|---|---|---|---|---|---|
| ||||||||||||||||||||||||||
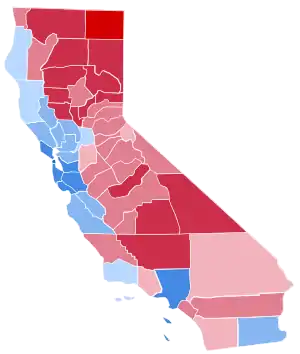 County results
| ||||||||||||||||||||||||||
| ||||||||||||||||||||||||||
| Elections in California |
|---|
 |
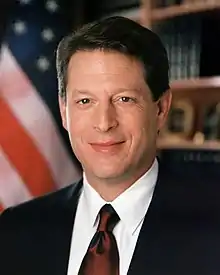
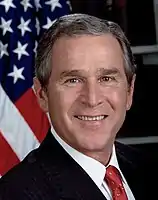
California was won by the Democratic ticket of Vice President Al Gore of Tennessee and Senator Joe Lieberman of Connecticut by 11.8% points over the Republican ticket of Texas Governor George W. Bush and former U.S. Secretary of Defense Dick Cheney of Wyoming.
The state hosted the 2000 Democratic National Convention in Los Angeles and was slightly contested by both candidates due to a large Hispanic population and a large independent and moderate base surrounding San Diego and Sacramento's suburbs. This was the first time since 1880 in which a winning Republican presidential candidate lost California. As of the 2020 presidential election, Bush is the last Republican candidate to carry Alpine and Mono counties in a presidential election. This was also the first time since 1976 that California did not back the candidate who won the overall presidential election as well.
Bush became the first Republican to win the White House without carrying Santa Barbara County since Abraham Lincoln in 1860. He also became the first nominee of either party to win the White House without receiving at least a million votes from Los Angeles County since this county first gave any nominee a million votes, in 1952; this feat would be reprised by Donald Trump in 2016.
Primaries
Analysis
Vice President Al Gore easily defeated Texas Governor George W. Bush in California. Bush campaigned several times in California, but it didn't seem to help as Gore defeated Bush by 11.8%. Bush did make substantial headway in the Gold Country, Shasta Cascade, and parts of the Central Valley, flipping San Joaquin, Stanislaus, and Merced Counties (all of which had voted for Bill Clinton twice) and winning the highest vote share of any presidential nominee in decades (exceeding California natives Richard Nixon and Ronald Reagan) in Shasta, Madera, Tehama, Siskiyou, Lassen, Plumas, Modoc, and Sierra Counties. He also flipped San Bernardino County, his largest county flip in the state (and nationally), as well as Ventura County; but he underperformed in all the large, then-historically Republican counties of Southern California and the Central Coast (San Diego, Orange, Riverside, San Bernardino, Ventura, Santa Barbara, and San Luis Obispo) relative to Bob Dole's performance in 1996, losing Santa Barbara outright despite that Dole had lost it by only 4.5%.[2] In the then-Republican bastion of Orange County, Al Gore became the first Democrat to crack 40% since Lyndon Johnson's 1964 landslide.
Furthermore, Gore overwhelmingly won Los Angeles County, the most populous county in the state and the country, and swept the Bay Area (where Bush's father had won Napa County in 1988, the last time a Republican had won the state). In San Francisco, although Bush did improve slightly on Dole's vote share, he posted the second-worst showing of any major-party nominee (after Dole) since John Davis in 1924. Even though Green Party nominee Ralph Nader broke into double digits in the North Coast counties of Mendocino and Humboldt, as well as in Santa Cruz County, these factors helped Gore win statewide by a little over 1.3 million votes, greater than his national popular vote margin over Bush (although less than the raw vote margin whereby he won New York).
Apart from Ralph Nader, Pat Buchanan, the paleoconservative former adviser to Presidents Nixon and Reagan and two-time Republican presidential candidate, was on the ballot as the nominee of the Reform Party, which had been founded by Ross Perot in 1994. However, as in most of the rest of the country, Buchanan fell well short of Perot's 1996 performance in California, cracking 1% only in Glenn County (and in tiny Alpine County, where he received eight votes). Buchanan was essentially a non-factor, and California was projected for Gore upon poll-closing, at 11 PM EST.
Results
| 2000 United States presidential election in California[3][4] | |||||
|---|---|---|---|---|---|
| Party | Candidate | Votes | Percentage | Electoral votes | |
| Democratic | Albert A. Gore Jr. and Joseph Lieberman | 5,861,203 | 53.45% | 54 | |
| Republican | George W. Bush and Richard B. Cheney | 4,567,429 | 41.65% | 0 | |
| Green | Ralph Nader and Winona LaDuke | 418,707 | 3.82% | 0 | |
| Libertarian | Harry Brown | 45,520 | 0.42% | 0 | |
| Reform | Pat Buchanan | 44,987 | 0.41% | 0 | |
| Other write-in | 6 | 0.00% | 0 | ||
| Invalid or blank votes | 177,010 | 1.59% | — | ||
| Totals | 10,937,852 | 100.00% | 54 | ||
| Voter turnout | 70.94% | — | |||
Results breakdown
By county
| County[5] | Gore | Votes | Bush | Votes | Nader | Votes | Others | Votes |
|---|---|---|---|---|---|---|---|---|
| San Francisco | 75.54% | 241,578 | 16.10% | 51,496 | 7.76% | 24,828 | 0.59% | 1,884 |
| Alameda | 69.36% | 342,889 | 24.13% | 119,279 | 5.56% | 27,499 | 0.94% | 4,669 |
| San Mateo | 64.29% | 166,757 | 30.96% | 80,296 | 4.02% | 10,433 | 0.73% | 1,903 |
| Marin | 64.26% | 79,135 | 28.32% | 34,872 | 6.73% | 8,289 | 0.70% | 859 |
| Los Angeles | 63.47% | 1,710,505 | 32.35% | 871,930 | 3.11% | 83,731 | 1.08% | 28,988 |
| Santa Cruz | 61.48% | 66,618 | 27.34% | 29,627 | 10.01% | 10,844 | 1.16% | 1,261 |
| Santa Clara | 60.66% | 332,490 | 34.44% | 188,750 | 3.48% | 19,072 | 1.43% | 7,817 |
| Sonoma | 59.54% | 117,295 | 32.25% | 63,529 | 7.27% | 14,324 | 0.94% | 1,858 |
| Contra Costa | 58.81% | 224,338 | 37.06% | 141,373 | 3.43% | 13,067 | 0.71% | 2,700 |
| Monterey | 57.53% | 67,618 | 37.23% | 43,761 | 4.30% | 5,059 | 0.93% | 1,096 |
| Solano | 57.02% | 75,116 | 39.17% | 51,604 | 2.94% | 3,869 | 0.87% | 1,146 |
| Yolo | 54.93% | 33,747 | 37.53% | 23,057 | 6.69% | 4,107 | 0.85% | 525 |
| Napa | 54.32% | 28,097 | 39.89% | 20,633 | 4.78% | 2,471 | 1.01% | 523 |
| San Benito | 54.25% | 9,131 | 41.68% | 7,015 | 3.18% | 535 | 0.89% | 150 |
| Imperial | 53.53% | 15,489 | 43.28% | 12,524 | 2.10% | 608 | 1.09% | 316 |
| Lake | 51.23% | 10,717 | 41.58% | 8,699 | 6.05% | 1,265 | 1.14% | 238 |
| Sacramento | 49.31% | 212,792 | 45.33% | 195,619 | 4.09% | 17,659 | 1.27% | 5,480 |
| Mendocino | 48.34% | 16,634 | 35.66% | 12,272 | 14.68% | 5,051 | 1.32% | 453 |
| San Joaquin | 47.70% | 79,776 | 48.90% | 81,773 | 2.51% | 4,195 | 0.89% | 1,485 |
| Santa Barbara | 47.37% | 73,411 | 46.13% | 71,493 | 5.59% | 8,664 | 0.91% | 1,406 |
| San Bernardino | 47.21% | 214,749 | 48.75% | 221,757 | 2.59% | 11,775 | 1.45% | 6,612 |
| Ventura | 47.14% | 133,258 | 48.17% | 136,173 | 3.62% | 10,235 | 1.07% | 3,026 |
| San Diego | 45.66% | 437,666 | 49.63% | 475,736 | 3.54% | 33,979 | 1.17% | 11,253 |
| Alpine | 45.22% | 265 | 47.95% | 281 | 4.27% | 25 | 2.56% | 15 |
| Merced | 45.08% | 22,726 | 51.77% | 26,102 | 2.31% | 1,166 | 0.84% | 424 |
| Riverside | 44.90% | 202,576 | 51.42% | 231,955 | 2.59% | 11,678 | 1.09% | 4,918 |
| Humboldt | 44.40% | 24,851 | 41.48% | 23,219 | 12.68% | 7,100 | 1.43% | 802 |
| Stanislaus | 44.01% | 56,448 | 52.38% | 67,188 | 2.65% | 3,398 | 0.96% | 1,233 |
| Fresno | 43.05% | 95,059 | 53.14% | 117,342 | 2.96% | 6,541 | 0.86% | 1,893 |
| Mono | 40.91% | 1,788 | 52.53% | 2,296 | 5.26% | 230 | 1.30% | 57 |
| San Luis Obispo | 40.89% | 44,526 | 52.22% | 56,859 | 5.99% | 6,523 | 0.90% | 978 |
| Orange | 40.36% | 391,819 | 55.75% | 541,299 | 2.76% | 26,833 | 1.13% | 10,954 |
| Tuolumne | 39.44% | 9,359 | 55.51% | 13,172 | 4.00% | 949 | 1.04% | 247 |
| Kings | 38.97% | 11,041 | 57.80% | 16,377 | 2.00% | 567 | 1.24% | 350 |
| Amador | 38.19% | 5,906 | 56.69% | 8,766 | 3.78% | 584 | 1.35% | 208 |
| Calaveras | 37.58% | 7,093 | 56.15% | 10,599 | 4.57% | 863 | 1.70% | 321 |
| Del Norte | 37.58% | 3,117 | 54.57% | 4,526 | 5.85% | 485 | 2.00% | 166 |
| Butte | 37.43% | 31,338 | 54.45% | 45,584 | 6.84% | 5,727 | 1.28% | 1,072 |
| Nevada | 37.22% | 17,670 | 54.76% | 25,998 | 6.92% | 3,287 | 1.10% | 524 |
| Tulare | 36.75% | 33,006 | 60.20% | 54,070 | 2.04% | 1,834 | 1.01% | 908 |
| El Dorado | 36.35% | 26,220 | 58.29% | 42,045 | 4.18% | 3,013 | 1.19% | 858 |
| Kern | 36.20% | 66,003 | 60.70% | 110,663 | 1.91% | 3,474 | 1.19% | 2,168 |
| Placer | 36.04% | 42,449 | 59.29% | 69,835 | 3.78% | 4,449 | 0.90% | 1,061 |
| Madera | 34.89% | 11,650 | 60.74% | 20,283 | 3.23% | 1,080 | 1.14% | 382 |
| Mariposa | 34.88% | 2,816 | 58.55% | 4,727 | 4.69% | 379 | 1.88% | 152 |
| Yuba | 34.39% | 5,546 | 61.00% | 9,838 | 3.14% | 507 | 1.46% | 236 |
| Inyo | 33.93% | 2,652 | 60.31% | 4,713 | 4.40% | 344 | 1.36% | 106 |
| Trinity | 33.33% | 1,932 | 57.62% | 3,340 | 6.83% | 396 | 2.23% | 129 |
| Plumas | 33.25% | 3,458 | 60.98% | 6,343 | 4.38% | 456 | 1.38% | 144 |
| Siskiyou | 31.90% | 6,323 | 61.55% | 12,198 | 4.40% | 872 | 2.15% | 426 |
| Sutter | 31.68% | 8,416 | 65.31% | 17,350 | 2.24% | 594 | 0.77% | 204 |
| Tehama | 31.20% | 6,507 | 63.63% | 13,270 | 3.34% | 697 | 1.82% | 380 |
| Colusa | 31.22% | 1,745 | 64.92% | 3,629 | 2.70% | 151 | 1.16% | 65 |
| Shasta | 30.25% | 20,127 | 65.04% | 43,278 | 3.20% | 2,131 | 1.51% | 1,008 |
| Sierra | 29.24% | 540 | 63.45% | 1,172 | 4.66% | 86 | 2.65% | 49 |
| Glenn | 28.68% | 2,498 | 66.53% | 5,795 | 3.08% | 268 | 1.72% | 150 |
| Lassen | 28.17% | 2,982 | 66.88% | 7,080 | 3.20% | 339 | 1.75% | 185 |
| Modoc | 23.07% | 945 | 72.47% | 2,969 | 2.98% | 122 | 1.49% | 61 |
| Al Gore | George W. Bush | Total | |
|---|---|---|---|
| Counties won | 20 | 38 | 58 |
| Best score | San Francisco County (75.54%) | Modoc County (72.47%) | . |
| Counties won under statewide margin (11.80%) | 5 | 10 | 15 |
| Santa Barbara County (1.24%) Humboldt County (2.92%) Sacramento County (3.98%) Lake County (9.65%) Imperial County (10.25%) |
Ventura County (1.03%) San Joaquin County (1.20%) San Bernardino County (1.54%) Alpine County (2.73%) San Diego County (3.97%) Riverside County (6.52%) Merced County (6.69%) Stanislaus County (8.37%) San Luis Obispo County (11.33%) Mono County (11.62%) |
. | |
| Counties won under nationwide margin (0.51%) | 0 | 0 | 0 |
| . | . | . |
By congressional district
Gore won 33 of 52 congressional districts.
Electors
Technically the voters of California cast their ballots for electors: representatives to the Electoral College. California is allocated 54 electors because it has 52 congressional districts and 2 senators. All candidates who appear on the ballot or qualify to receive write-in votes must submit a list of 54 electors, who pledge to vote for their candidate and his or her running mate. Whoever wins the majority of votes in the state is awarded all 54 electoral votes. Their chosen electors then vote for president and vice president. Although electors are pledged to their candidate and running mate, they are not obligated to vote for them. An elector who votes for someone other than his or her candidate is known as a faithless elector.
The electors of each state and the District of Columbia met on December 18, 2000,[6] to cast their votes for president and vice president. The Electoral College itself never meets as one body. Instead the electors from each state and the District of Columbia met in their respective capitols.
The following were the members of the Electoral College from the state. All were pledged to and voted for Al Gore and Joe Lieberman:[7]
- Sunil Aghi
- Amy Arambula
- Rachel Binah
- R. Stephen Bollinger
- Roberts Braden
- Laura Karolina Capps
- Anni Chung
- Joseph A. Cislowski
- Sheldon Cohn
- Thor Emblem
- Elsa Favila
- John Freidenrich
- Cecelia Fuentes
- Glen Fuller
- James Garrison
- Sally Goehring
- Florence Gold
- Jill S. Hardy
- Therese Horsting
- Georgie Huff
- Robert Eugene Hurd
- Harriet A. Ingram
- Robert Jordan
- John Koza
- John Laird
- N. Mark Lam
- Manuel M. Lopez
- Henry Lozano
- David Mann
- Beverly Martin
- R. Keith McDonald
- Carol D. Norberg
- Ron Oberndorfer
- Gerard Orozco
- Trudy Owens
- Gregory S. Pettis
- Flo Rene Pickett
- Theodore H. Plant
- Art Pulaski
- Eloise Reyes
- Alex Arthur Reza
- C. Craig Roberts
- Jason Rodríguez
- Luis D. Rojas
- Howard L. Schock
- Lane Sherman
- David A. Torres
- Larry Trullinger
- Angelo K. Tsakopoulos
- Richard Valle
- Karen Waters
- Don Wilcox
- William K. Wong
- Rosalind Wyman
References
- https://elections.cdn.sos.ca.gov/sov/2018-general/sov/04-historical-voter-reg-participation.pdf
- Leip, Dave (4 November 2020). "2000 Presidential General Election Data - California". Dave Leip's Atlas of U.S. Presidential Elections.
- "Dave Leip's Atlas of U.S. Presidential Elections - California". Retrieved 2013-01-07.
- "Report of Registration as of October 10, 2000" (PDF). California Secretary of State. January 7, 2001. Archived from the original (PDF) on August 7, 2008. Retrieved August 10, 2008.
- http://uselectionatlas.org/RESULTS/
- http://www.uselectionatlas.org/INFORMATION/ARTICLES/pe2000timeline.php
- "Archived copy". Archived from the original on 2012-02-12. Retrieved 2009-10-24.CS1 maint: archived copy as title (link)