Climate of Pennsylvania
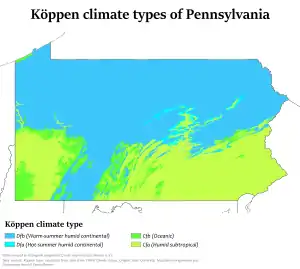
The climate of Pennsylvania is diverse due to the multitude of geographic features found within the state. Straddling two major climate zones, the southeastern corner of Pennsylvania has the warmest climate. Greater Philadelphia lies at the southernmost tip of the humid continental climate zone, with some characteristics of the humid subtropical climate that lies in Delaware and Maryland to the south. Moving west toward the mountainous interior of the state, the climate becomes markedly colder, the number of cloudy days increases,[1] and winter snowfall amounts are greater.
Precipitation
Western areas of the state, particularly cities near Lake Erie, can receive over 100 inches (254 cm) of snowfall annually, and the entire state receives an average of 41 inches (1,041 mm) of rainfall every year. Floods are more common in March and April than other months of the year.[2]
Tropical cyclones
Tropical cyclones normally threaten the states during the summer and fall, with their main impact being rainfall.[3] Although Hurricane Agnes was barely a hurricane at landfall in Florida, its major impact was over the Mid-Atlantic region, where Agnes combined with a non-tropical low to produce widespread rains of 6 inches (150 mm) to 12 inches (300 mm) with local amounts up to 19 inches (480 mm) in western Schuylkill County in Pennsylvania.[4] These rains produced widespread severe flooding from Virginia northward to New York, with other flooding occurring over the western portions of the Carolinas.
Philadelphia has received sustained winds approaching hurricane-force from tropical cyclones in the past.[5]
Climate extremes
Temperature
The state record low is −42 °F (−41 °C), recorded at Smethport on January 5, 1904, while the state record high is 111 °F (44 °C), recorded at Phoenixville on July 9 and 10, 1936.
| Climate data for Pennsylvania | |||||||||||||
|---|---|---|---|---|---|---|---|---|---|---|---|---|---|
| Month | Jan | Feb | Mar | Apr | May | Jun | Jul | Aug | Sep | Oct | Nov | Dec | Year |
| Record high °F (°C) | 85 (29) |
83 (28) |
92 (33) |
98 (37) |
102 (39) |
107 (42) |
111 (44) |
108 (42) |
106 (41) |
100 (38) |
88 (31) |
82 (28) |
111 (44) |
| Record low °F (°C) | −42 (−41) |
−39 (−39) |
−31 (−35) |
−5 (−21) |
10 (−12) |
20 (−7) |
28 (−2) |
23 (−5) |
17 (−8) |
7 (−14) |
−15 (−26) |
−29 (−34) |
−42 (−41) |
| Source: http://climate.psu.edu/data/state/staterecords.php | |||||||||||||
Rain
| Event[6] | Measurement | Date | Location |
|---|---|---|---|
| Greatest 24-Hour Rainfall | 13.50 inches (343 mm) | June 22, 1972 (during Hurricane Agnes) | York |
Note: While the official measured rainfall record is given above, the NCDC notes that an estimated 34.50 inches (876 mm) of rain fell in 12 hours near Smethport on July 17, 1942. The NCDC says this is "arguably the greatest 24-hour rainfall on record outside of the tropics".[6]
Snow
| Event[6][7] | Measurement | Date | Location |
|---|---|---|---|
| Greatest 24-hour snowfall | 38.0 inches (97 cm) | March 20, 1958 | Morgantown |
| Greatest two-day snowfall | 60.5 inches (154 cm) | December 24–26, 2017 | Erie |
| Greatest snow depth | 60.0 inches (152 cm) | March 22 & 23, 1958 | Gouldsboro |
Hurricanes
| Event[8] | Measurement | Date | Location |
|---|---|---|---|
| Wettest Tropical Cyclone | 19.00 inches (483 mm) | Agnes (1972) | Western Schuylkill County |
Climate statistics for selected cities
| Climate data for Allentown, Pennsylvania (Lehigh Valley Int'l), 1981–2010 normals,[lower-alpha 1] extremes 1922–present[lower-alpha 2] | |||||||||||||
|---|---|---|---|---|---|---|---|---|---|---|---|---|---|
| Month | Jan | Feb | Mar | Apr | May | Jun | Jul | Aug | Sep | Oct | Nov | Dec | Year |
| Record high °F (°C) | 72 (22) |
81 (27) |
87 (31) |
93 (34) |
97 (36) |
100 (38) |
105 (41) |
100 (38) |
99 (37) |
93 (34) |
81 (27) |
72 (22) |
105 (41) |
| Mean maximum °F (°C) | 57.9 (14.4) |
59.6 (15.3) |
71.6 (22.0) |
82.5 (28.1) |
88.2 (31.2) |
91.9 (33.3) |
94.2 (34.6) |
92.5 (33.6) |
88.0 (31.1) |
79.0 (26.1) |
70.6 (21.4) |
59.7 (15.4) |
95.4 (35.2) |
| Average high °F (°C) | 36.0 (2.2) |
39.8 (4.3) |
49.4 (9.7) |
61.3 (16.3) |
71.5 (21.9) |
80.1 (26.7) |
84.2 (29.0) |
82.4 (28.0) |
74.9 (23.8) |
63.6 (17.6) |
52.5 (11.4) |
40.5 (4.7) |
61.4 (16.3) |
| Average low °F (°C) | 19.5 (−6.9) |
21.7 (−5.7) |
28.8 (−1.8) |
38.5 (3.6) |
48.3 (9.1) |
58.1 (14.5) |
62.7 (17.1) |
60.9 (16.1) |
52.9 (11.6) |
41.3 (5.2) |
32.9 (0.5) |
24.0 (−4.4) |
40.9 (4.9) |
| Mean minimum °F (°C) | 3.0 (−16.1) |
5.7 (−14.6) |
13.1 (−10.5) |
26.0 (−3.3) |
35.5 (1.9) |
46.3 (7.9) |
52.6 (11.4) |
49.8 (9.9) |
39.2 (4.0) |
28.8 (−1.8) |
19.9 (−6.7) |
9.1 (−12.7) |
0.2 (−17.7) |
| Record low °F (°C) | −15 (−26) |
−12 (−24) |
−5 (−21) |
12 (−11) |
28 (−2) |
39 (4) |
46 (8) |
41 (5) |
30 (−1) |
21 (−6) |
3 (−16) |
−8 (−22) |
−15 (−26) |
| Average precipitation inches (mm) | 3.03 (77) |
2.70 (69) |
3.39 (86) |
3.56 (90) |
4.14 (105) |
4.31 (109) |
4.95 (126) |
3.69 (94) |
4.62 (117) |
3.88 (99) |
3.50 (89) |
3.58 (91) |
45.35 (1,152) |
| Average snowfall inches (cm) | 10.0 (25) |
11.1 (28) |
4.9 (12) |
1.0 (2.5) |
0 (0) |
0 (0) |
0 (0) |
0 (0) |
0 (0) |
0 (0) |
0.7 (1.8) |
5.2 (13) |
32.9 (84) |
| Average precipitation days (≥ 0.01 in) | 11.1 | 9.8 | 11.0 | 12.1 | 12.1 | 11.4 | 10.9 | 9.5 | 9.1 | 9.1 | 9.8 | 10.9 | 126.8 |
| Average snowy days (≥ 0.1 in) | 5.5 | 4.8 | 2.5 | 0.4 | 0 | 0 | 0 | 0 | 0 | 0 | 0.6 | 3.5 | 17.3 |
| Average relative humidity (%) | 69.1 | 66.7 | 62.6 | 60.9 | 65.6 | 67.9 | 68.8 | 71.9 | 74.0 | 71.8 | 70.5 | 71.4 | 68.4 |
| Source: NOAA (relative humidity 1961–1990)[9][10][11] | |||||||||||||
| Climate data for Erie, Pennsylvania (Erie International Airport), 1981–2010 normals, extremes 1873–present | |||||||||||||
|---|---|---|---|---|---|---|---|---|---|---|---|---|---|
| Month | Jan | Feb | Mar | Apr | May | Jun | Jul | Aug | Sep | Oct | Nov | Dec | Year |
| Record high °F (°C) | 73 (23) |
77 (25) |
82 (28) |
89 (32) |
91 (33) |
100 (38) |
99 (37) |
96 (36) |
99 (37) |
89 (32) |
82 (28) |
75 (24) |
100 (38) |
| Mean maximum °F (°C) | 56.5 (13.6) |
57.8 (14.3) |
71.1 (21.7) |
79.6 (26.4) |
83.5 (28.6) |
89.7 (32.1) |
90.5 (32.5) |
89.4 (31.9) |
85.7 (29.8) |
78.1 (25.6) |
69.2 (20.7) |
58.4 (14.7) |
92.3 (33.5) |
| Average high °F (°C) | 33.7 (0.9) |
35.5 (1.9) |
43.8 (6.6) |
56.1 (13.4) |
66.6 (19.2) |
75.7 (24.3) |
79.8 (26.6) |
78.6 (25.9) |
71.9 (22.2) |
60.8 (16.0) |
49.9 (9.9) |
38.1 (3.4) |
57.5 (14.2) |
| Daily mean °F (°C) | 27.4 (−2.6) |
28.4 (−2.0) |
35.7 (2.1) |
47.2 (8.4) |
57.5 (14.2) |
67.2 (19.6) |
71.8 (22.1) |
70.7 (21.5) |
64.0 (17.8) |
53.2 (11.8) |
43.4 (6.3) |
32.5 (0.3) |
49.9 (9.9) |
| Average low °F (°C) | 20.8 (−6.2) |
21.1 (−6.1) |
27.5 (−2.5) |
38.1 (3.4) |
48.2 (9.0) |
58.4 (14.7) |
63.5 (17.5) |
62.5 (16.9) |
55.8 (13.2) |
45.3 (7.4) |
36.6 (2.6) |
26.6 (−3.0) |
42.0 (5.6) |
| Mean minimum °F (°C) | 2.6 (−16.3) |
3.2 (−16.0) |
10.4 (−12.0) |
25.1 (−3.8) |
34.8 (1.6) |
44.9 (7.2) |
52.5 (11.4) |
51.3 (10.7) |
43.4 (6.3) |
32.5 (0.3) |
24.3 (−4.3) |
10.6 (−11.9) |
−1.3 (−18.5) |
| Record low °F (°C) | −18 (−28) |
−18 (−28) |
−9 (−23) |
7 (−14) |
26 (−3) |
32 (0) |
44 (7) |
37 (3) |
33 (1) |
23 (−5) |
6 (−14) |
−11 (−24) |
−18 (−28) |
| Average precipitation inches (mm) | 2.95 (75) |
2.39 (61) |
2.95 (75) |
3.33 (85) |
3.44 (87) |
3.76 (96) |
3.54 (90) |
3.47 (88) |
4.61 (117) |
4.05 (103) |
3.93 (100) |
3.74 (95) |
42.16 (1,071) |
| Average snowfall inches (cm) | 29.6 (75) |
18.2 (46) |
13.7 (35) |
3.2 (8.1) |
— | 0.0 (0.0) |
0.0 (0.0) |
0.0 (0.0) |
0.0 (0.0) |
0.2 (0.51) |
8.5 (22) |
27.5 (70) |
100.9 (256) |
| Average precipitation days (≥ 0.01 in) | 19.6 | 15.0 | 14.3 | 13.9 | 12.8 | 11.1 | 10.2 | 10.3 | 11.1 | 13.4 | 15.5 | 19.2 | 166.4 |
| Average snowy days (≥ 0.1 in) | 16.5 | 11.7 | 8.0 | 2.7 | 0.0 | 0.0 | 0.0 | 0.0 | 0.0 | 0.2 | 4.4 | 13.6 | 57.1 |
| Average relative humidity (%) | 74.5 | 75.4 | 71.9 | 67.9 | 68.9 | 71.3 | 71.7 | 74.0 | 74.5 | 71.1 | 72.3 | 75.0 | 72.4 |
| Source: NOAA (relative humidity 1961–1990)[12][13][14] | |||||||||||||
| Climate data for Harrisburg, Pennsylvania (Harrisburg Int'l), 1981–2010 normals,[lower-alpha 3] extremes 1888–present[lower-alpha 4] | |||||||||||||
|---|---|---|---|---|---|---|---|---|---|---|---|---|---|
| Month | Jan | Feb | Mar | Apr | May | Jun | Jul | Aug | Sep | Oct | Nov | Dec | Year |
| Record high °F (°C) | 73 (23) |
79 (26) |
87 (31) |
93 (34) |
97 (36) |
100 (38) |
107 (42) |
104 (40) |
102 (39) |
97 (36) |
84 (29) |
75 (24) |
107 (42) |
| Mean maximum °F (°C) | 58.0 (14.4) |
60.7 (15.9) |
73.0 (22.8) |
83.3 (28.5) |
88.7 (31.5) |
93.0 (33.9) |
95.8 (35.4) |
94.0 (34.4) |
89.0 (31.7) |
80.1 (26.7) |
70.9 (21.6) |
60.8 (16.0) |
96.8 (36.0) |
| Average high °F (°C) | 37.0 (2.8) |
40.7 (4.8) |
50.4 (10.2) |
62.4 (16.9) |
72.1 (22.3) |
81.0 (27.2) |
85.5 (29.7) |
83.4 (28.6) |
75.6 (24.2) |
64.1 (17.8) |
53.1 (11.7) |
41.3 (5.2) |
62.3 (16.8) |
| Average low °F (°C) | 22.8 (−5.1) |
25.1 (−3.8) |
33.0 (0.6) |
41.9 (5.5) |
52.1 (11.2) |
62.0 (16.7) |
66.3 (19.1) |
64.5 (18.1) |
56.2 (13.4) |
44.6 (7.0) |
35.1 (1.7) |
26.6 (−3.0) |
44.3 (6.8) |
| Mean minimum °F (°C) | 6.1 (−14.4) |
9.7 (−12.4) |
16.9 (−8.4) |
28.8 (−1.8) |
38.8 (3.8) |
49.6 (9.8) |
56.3 (13.5) |
53.7 (12.1) |
43.1 (6.2) |
32.2 (0.1) |
23.4 (−4.8) |
12.4 (−10.9) |
3.3 (−15.9) |
| Record low °F (°C) | −22 (−30) |
−13 (−25) |
−1 (−18) |
11 (−12) |
30 (−1) |
40 (4) |
49 (9) |
45 (7) |
30 (−1) |
23 (−5) |
10 (−12) |
−8 (−22) |
−22 (−30) |
| Average precipitation inches (mm) | 2.88 (73) |
2.39 (61) |
3.37 (86) |
3.10 (79) |
3.79 (96) |
3.60 (91) |
4.61 (117) |
3.20 (81) |
4.07 (103) |
3.27 (83) |
3.23 (82) |
3.23 (82) |
40.74 (1,035) |
| Average snowfall inches (cm) | 8.8 (22) |
10.5 (27) |
5.2 (13) |
0.4 (1.0) |
0 (0) |
0 (0) |
0 (0) |
0 (0) |
0 (0) |
0 (0) |
0.6 (1.5) |
5.1 (13) |
30.6 (78) |
| Average precipitation days (≥ 0.01 in) | 10.6 | 9.9 | 10.9 | 10.8 | 12.2 | 11.1 | 10.7 | 9.1 | 9.2 | 8.8 | 9.0 | 9.7 | 122.0 |
| Average snowy days (≥ 0.1 in) | 5.2 | 5.0 | 2.6 | 0.3 | 0 | 0 | 0 | 0 | 0 | 0 | 0.9 | 2.8 | 16.8 |
| Average relative humidity (%) | 64.4 | 63.2 | 60.7 | 59.2 | 65.2 | 67.7 | 68.6 | 72.2 | 73.8 | 70.5 | 68.2 | 66.4 | 66.7 |
| Mean monthly sunshine hours | 154.9 | 167.2 | 213.8 | 235.7 | 266.7 | 288.5 | 310.1 | 285.4 | 226.7 | 199.2 | 139.6 | 126.0 | 2,613.8 |
| Percent possible sunshine | 52 | 56 | 58 | 59 | 60 | 64 | 68 | 67 | 61 | 58 | 47 | 43 | 59 |
| Average ultraviolet index | 2 | 3 | 4 | 6 | 8 | 9 | 9 | 8 | 6 | 4 | 2 | 2 | 5 |
| Source 1: NOAA (relative humidity and sun 1961–1990 at Capital City Airport)[16][17][18] | |||||||||||||
| Source 2: Weather Atlas [19] (sunshine data) | |||||||||||||
| Climate data for Philadelphia (Philadelphia Airport), 1981–2010 normals,[lower-alpha 5] extremes 1872–present[lower-alpha 6] | |||||||||||||
|---|---|---|---|---|---|---|---|---|---|---|---|---|---|
| Month | Jan | Feb | Mar | Apr | May | Jun | Jul | Aug | Sep | Oct | Nov | Dec | Year |
| Record high °F (°C) | 74 (23) |
79 (26) |
87 (31) |
95 (35) |
97 (36) |
102 (39) |
104 (40) |
106 (41) |
102 (39) |
96 (36) |
84 (29) |
73 (23) |
106 (41) |
| Mean maximum °F (°C) | 62.0 (16.7) |
62.7 (17.1) |
73.6 (23.1) |
83.2 (28.4) |
89.1 (31.7) |
94.2 (34.6) |
96.4 (35.8) |
94.7 (34.8) |
89.8 (32.1) |
81.7 (27.6) |
72.3 (22.4) |
63.5 (17.5) |
97.5 (36.4) |
| Average high °F (°C) | 40.3 (4.6) |
43.8 (6.6) |
52.7 (11.5) |
63.9 (17.7) |
73.8 (23.2) |
82.7 (28.2) |
87.1 (30.6) |
85.3 (29.6) |
78.0 (25.6) |
66.6 (19.2) |
56.0 (13.3) |
44.8 (7.1) |
64.7 (18.2) |
| Average low °F (°C) | 25.6 (−3.6) |
27.7 (−2.4) |
34.4 (1.3) |
44.1 (6.7) |
54.0 (12.2) |
63.8 (17.7) |
69.2 (20.7) |
67.9 (19.9) |
60.3 (15.7) |
48.4 (9.1) |
39.2 (4.0) |
30.1 (−1.1) |
47.2 (8.4) |
| Mean minimum °F (°C) | 8.7 (−12.9) |
12.7 (−10.7) |
19.4 (−7.0) |
31.6 (−0.2) |
42.0 (5.6) |
52.2 (11.2) |
59.8 (15.4) |
57.8 (14.3) |
47.2 (8.4) |
35.8 (2.1) |
26.0 (−3.3) |
15.8 (−9.0) |
6.4 (−14.2) |
| Record low °F (°C) | −7 (−22) |
−11 (−24) |
5 (−15) |
14 (−10) |
28 (−2) |
44 (7) |
51 (11) |
44 (7) |
35 (2) |
25 (−4) |
8 (−13) |
−5 (−21) |
−11 (−24) |
| Average precipitation inches (mm) | 3.03 (77) |
2.65 (67) |
3.79 (96) |
3.56 (90) |
3.71 (94) |
3.43 (87) |
4.35 (110) |
3.50 (89) |
3.78 (96) |
3.18 (81) |
2.99 (76) |
3.56 (90) |
41.53 (1,055) |
| Average snowfall inches (cm) | 6.5 (17) |
8.8 (22) |
2.9 (7.4) |
0.5 (1.3) |
0 (0) |
0 (0) |
0 (0) |
0 (0) |
0 (0) |
0 (0) |
0.3 (0.76) |
3.4 (8.6) |
22.4 (57) |
| Average precipitation days (≥ 0.01 in) | 10.6 | 9.4 | 10.5 | 11.3 | 11.1 | 9.8 | 9.9 | 8.4 | 8.7 | 8.6 | 9.3 | 10.6 | 118.2 |
| Average snowy days (≥ 0.1 in) | 4.4 | 3.6 | 1.8 | 0.4 | 0 | 0 | 0 | 0 | 0 | 0 | 0.2 | 1.8 | 12.2 |
| Average relative humidity (%) | 66.2 | 63.6 | 61.7 | 60.4 | 65.4 | 67.8 | 69.6 | 70.4 | 71.6 | 70.8 | 68.4 | 67.7 | 67.0 |
| Average dew point °F (°C) | 19.8 (−6.8) |
21.0 (−6.1) |
28.6 (−1.9) |
37.0 (2.8) |
49.5 (9.7) |
59.2 (15.1) |
64.6 (18.1) |
63.7 (17.6) |
57.2 (14.0) |
45.7 (7.6) |
35.6 (2.0) |
25.5 (−3.6) |
42.3 (5.7) |
| Mean monthly sunshine hours | 155.7 | 154.7 | 202.8 | 217.0 | 245.1 | 271.2 | 275.6 | 260.1 | 219.3 | 204.5 | 154.7 | 137.7 | 2,498.4 |
| Percent possible sunshine | 52 | 52 | 55 | 55 | 55 | 61 | 61 | 61 | 59 | 59 | 52 | 47 | 56 |
| Average ultraviolet index | 2 | 3 | 4 | 6 | 8 | 9 | 9 | 8 | 6 | 4 | 2 | 2 | 5 |
| Source 1: NOAA (relative humidity, dew point and sun 1961–1990)[23][24][21] | |||||||||||||
| Source 2: Weather Atlas (UV index) [25] | |||||||||||||
| Climate data for Philadelphia | |||||||||||||
|---|---|---|---|---|---|---|---|---|---|---|---|---|---|
| Month | Jan | Feb | Mar | Apr | May | Jun | Jul | Aug | Sep | Oct | Nov | Dec | Year |
| Average sea temperature °F (°C) | 41.8 (5.5) |
39.9 (4.4) |
41.2 (5.1) |
46.7 (8.2) |
53.9 (12.2) |
66.3 (19.0) |
74.0 (23.3) |
75.9 (24.4) |
71.4 (21.9) |
64.2 (17.9) |
55.1 (12.8) |
47.7 (8.8) |
56.5 (13.6) |
| Mean daily daylight hours | 10.0 | 11.0 | 12.0 | 13.0 | 14.0 | 15.0 | 15.0 | 14.0 | 12.0 | 11.0 | 10.0 | 9.0 | 12.2 |
| Source: Weather Atlas [25] | |||||||||||||
| Climate data for Pittsburgh (Pittsburgh International Airport), 1981–2010 normals,[lower-alpha 7] extremes 1871–present[lower-alpha 8] | |||||||||||||
|---|---|---|---|---|---|---|---|---|---|---|---|---|---|
| Month | Jan | Feb | Mar | Apr | May | Jun | Jul | Aug | Sep | Oct | Nov | Dec | Year |
| Record high °F (°C) | 75 (24) |
78 (26) |
84 (29) |
90 (32) |
95 (35) |
98 (37) |
103 (39) |
103 (39) |
102 (39) |
91 (33) |
82 (28) |
74 (23) |
103 (39) |
| Mean maximum °F (°C) | 59.7 (15.4) |
61.9 (16.6) |
74.9 (23.8) |
81.5 (27.5) |
85.7 (29.8) |
90.0 (32.2) |
91.3 (32.9) |
90.5 (32.5) |
87.2 (30.7) |
79.0 (26.1) |
71.5 (21.9) |
61.3 (16.3) |
92.7 (33.7) |
| Average high °F (°C) | 35.7 (2.1) |
39.3 (4.1) |
49.2 (9.6) |
61.7 (16.5) |
70.8 (21.6) |
79.1 (26.2) |
82.5 (28.1) |
81.4 (27.4) |
74.3 (23.5) |
62.6 (17.0) |
51.2 (10.7) |
39.4 (4.1) |
60.7 (15.9) |
| Average low °F (°C) | 21.1 (−6.1) |
23.0 (−5.0) |
30.0 (−1.1) |
40.2 (4.6) |
49.3 (9.6) |
58.4 (14.7) |
62.8 (17.1) |
61.5 (16.4) |
54.0 (12.2) |
42.9 (6.1) |
34.7 (1.5) |
25.3 (−3.7) |
42.0 (5.6) |
| Mean minimum °F (°C) | −0.1 (−17.8) |
3.6 (−15.8) |
10.9 (−11.7) |
24.6 (−4.1) |
34.8 (1.6) |
44.1 (6.7) |
50.7 (10.4) |
49.6 (9.8) |
39.3 (4.1) |
29.0 (−1.7) |
18.9 (−7.3) |
6.7 (−14.1) |
−3.9 (−19.9) |
| Record low °F (°C) | −22 (−30) |
−20 (−29) |
−5 (−21) |
11 (−12) |
26 (−3) |
34 (1) |
42 (6) |
39 (4) |
31 (−1) |
16 (−9) |
−1 (−18) |
−12 (−24) |
−22 (−30) |
| Average precipitation inches (mm) | 2.70 (69) |
2.39 (61) |
2.95 (75) |
3.11 (79) |
3.95 (100) |
4.30 (109) |
3.83 (97) |
3.48 (88) |
3.11 (79) |
2.29 (58) |
3.23 (82) |
2.85 (72) |
38.19 (970) |
| Average snowfall inches (cm) | 11.5 (29) |
10.2 (26) |
7.4 (19) |
1.5 (3.8) |
0 (0) |
0 (0) |
0 (0) |
0 (0) |
0 (0) |
0.4 (1.0) |
2.1 (5.3) |
8.3 (21) |
41.4 (105) |
| Average precipitation days (≥ 0.01 in) | 16.2 | 13.6 | 14.0 | 13.8 | 13.3 | 12.1 | 10.2 | 9.8 | 9.8 | 10.5 | 12.8 | 15.1 | 151.2 |
| Average snowy days (≥ 0.1 in) | 11.4 | 8.3 | 5.9 | 2.0 | 0 | 0 | 0 | 0 | 0 | 0.3 | 3.0 | 8.5 | 39.4 |
| Average relative humidity (%) | 69.9 | 67.3 | 64.1 | 59.8 | 63.4 | 66.2 | 68.8 | 71.2 | 72.0 | 68.3 | 70.2 | 71.9 | 67.8 |
| Average dew point °F (°C) | 17.2 (−8.2) |
18.9 (−7.3) |
26.8 (−2.9) |
34.5 (1.4) |
45.9 (7.7) |
55.2 (12.9) |
60.1 (15.6) |
59.5 (15.3) |
53.4 (11.9) |
40.8 (4.9) |
32.4 (0.2) |
23.2 (−4.9) |
39.0 (3.9) |
| Mean monthly sunshine hours | 93.9 | 108.5 | 155.4 | 182.8 | 217.4 | 242.2 | 254.9 | 228.4 | 196.7 | 167.3 | 99.4 | 74.4 | 2,021.3 |
| Percent possible sunshine | 31 | 36 | 42 | 46 | 49 | 54 | 56 | 54 | 53 | 48 | 33 | 26 | 45 |
| Average ultraviolet index | 2 | 3 | 4 | 6 | 8 | 9 | 9 | 8 | 6 | 4 | 2 | 2 | 5 |
| Source 1: NOAA (relative humidity, dew point and sun 1961–1990)[26][27][28][29] | |||||||||||||
| Source 2: Weather Atlas [30] | |||||||||||||
| Month | Jan | Feb | Mar | Apr | May | Jun | Jul | Aug | Sep | Oct | Nov | Dec | Year |
|---|---|---|---|---|---|---|---|---|---|---|---|---|---|
| Record high °F (°C) | 69 (21) |
76 (24) |
85 (29) |
93 (34) |
93 (34) |
99 (37) |
103 (39) |
102 (39) |
100 (38) |
91 (33) |
81 (27) |
71 (22) |
103 (39) |
| Mean maximum °F (°C) | 55.4 (13.0) |
56.4 (13.6) |
69.6 (20.9) |
81.3 (27.4) |
86.6 (30.3) |
89.8 (32.1) |
91.8 (33.2) |
90.0 (32.2) |
85.7 (29.8) |
77.3 (25.2) |
68.7 (20.4) |
57.5 (14.2) |
93.4 (34.1) |
| Average high °F (°C) | 33.2 (0.7) |
36.8 (2.7) |
46.2 (7.9) |
59.1 (15.1) |
69.7 (20.9) |
77.7 (25.4) |
81.9 (27.7) |
79.9 (26.6) |
72.3 (22.4) |
60.7 (15.9) |
49.4 (9.7) |
37.5 (3.1) |
58.8 (14.9) |
| Average low °F (°C) | 18.5 (−7.5) |
20.7 (−6.3) |
27.6 (−2.4) |
38.2 (3.4) |
47.6 (8.7) |
56.5 (13.6) |
60.9 (16.1) |
59.5 (15.3) |
52.1 (11.2) |
41.1 (5.1) |
33.3 (0.7) |
23.8 (−4.6) |
40.1 (4.5) |
| Mean minimum °F (°C) | −0.8 (−18.2) |
3.2 (−16.0) |
9.1 (−12.7) |
24.0 (−4.4) |
34.4 (1.3) |
43.1 (6.2) |
49.4 (9.7) |
47.1 (8.4) |
37.5 (3.1) |
28.3 (−2.1) |
18.9 (−7.3) |
5.9 (−14.5) |
−3.1 (−19.5) |
| Record low °F (°C) | −21 (−29) |
−19 (−28) |
−4 (−20) |
8 (−13) |
27 (−3) |
34 (1) |
43 (6) |
38 (3) |
29 (−2) |
19 (−7) |
5 (−15) |
−13 (−25) |
−21 (−29) |
| Average precipitation inches (mm) | 2.37 (60) |
2.03 (52) |
2.55 (65) |
3.33 (85) |
3.52 (89) |
4.03 (102) |
3.79 (96) |
3.41 (87) |
4.07 (103) |
3.34 (85) |
3.14 (80) |
2.68 (68) |
38.26 (972) |
| Average snowfall inches (cm) | 14.2 (36) |
9.3 (24) |
9.0 (23) |
3.3 (8.4) |
0 (0) |
0 (0) |
0 (0) |
0 (0) |
0 (0) |
0.1 (0.25) |
2.9 (7.4) |
7.4 (19) |
46.2 (117) |
| Average precipitation days (≥ 0.01 in) | 12.0 | 11.0 | 11.8 | 12.3 | 13.2 | 12.8 | 11.2 | 11.3 | 10.2 | 10.7 | 11.2 | 11.5 | 139.2 |
| Average snowy days (≥ 0.1 in) | 9.3 | 7.7 | 5.0 | 1.7 | 0 | 0 | 0 | 0 | 0 | 0.1 | 2.1 | 7.1 | 33.0 |
| Average relative humidity (%) | 70.1 | 67.5 | 63.3 | 60.4 | 64.6 | 70.5 | 71.1 | 73.8 | 75.2 | 71.6 | 71.8 | 72.5 | 69.4 |
| Average dew point °F (°C) | 16.2 (−8.8) |
17.2 (−8.2) |
24.4 (−4.2) |
33.1 (0.6) |
45.3 (7.4) |
55.9 (13.3) |
60.4 (15.8) |
59.9 (15.5) |
53.4 (11.9) |
41.4 (5.2) |
32.2 (0.1) |
22.3 (−5.4) |
38.5 (3.6) |
| Mean monthly sunshine hours | 130.3 | 143.7 | 185.7 | 210.5 | 246.9 | 269.7 | 285.7 | 257.2 | 200.2 | 173.3 | 104.3 | 95.9 | 2,303.4 |
| Percent possible sunshine | 44 | 48 | 50 | 53 | 55 | 60 | 62 | 60 | 54 | 50 | 35 | 33 | 52 |
| Source: NOAA (relative humidity and dew point 1964–1990, sun 1961–1990)[32][33][34] | |||||||||||||
See also
Notes
- Mean monthly maxima and minima (i.e. the highest and lowest temperature readings during an entire month or year) calculated based on data at said location from 1981 to 2010.
- Official records for Allentown were kept at Allentown Gas Company from March 1922 to December 1943, and at Lehigh Valley Int'l since January 1944. For more information, see ThreadEx.
- Mean monthly maxima and minima (i.e. the highest and lowest temperature readings during an entire month or year) calculated based on data at said location from 1981 to 2010.
- Official records for Harrisburg kept at downtown from July 1888 to December 1938, Capital City Airport from January 1939 to September 1991, and at Harrisburg Int'l in Middletown since October 1991.[15]
- Mean monthly maxima and minima (i.e. the highest and lowest temperature readings during an entire month or year) calculated based on data at said location from 1981 to 2010.
- Official temperature and precipitation measurements for Philadelphia were taken at the Weather Bureau Office in downtown from January 1872 to 19 June 1940, and at Philadelphia Int'l from 20 June 1940 to the present.[20] Snowfall and snow depth records date to 1 January 1884 and 1 October 1948, respectively.[21] In 2006, snowfall measurements were moved to National Park, New Jersey directly across the Delaware River from the airport.[22]
- Mean monthly maxima and minima (i.e. the highest and lowest temperature readings during an entire month or year) calculated based on data at said location from 1981 to 2010.
- Records kept January 1871 to June 1935 at the Weather Bureau Office across the Allegheny River from downtown, at Allegheny County Airport from July 1935 to 14 September 1952, and at Pittsburgh Int'l (KPIT) since 15 September 1952. Due to its river valley and urban location as well as elevation, many of the summertime warm minima temperature records set at the WBO have not even come close to being matched at KPIT, which is at-elevation and located in the western suburbs. For more information, see Threadex
- Mean monthly maxima and minima (i.e. the expected highest and lowest temperature readings at any point during the year or given month) calculated based on data at said location from 1981 to 2010.
- Official records for Avoca/Wilkes-Barre–Scranton kept at downtown Scranton from January 1901 to 17 April 1955 and at Wilkes-Barre/Scranton International Airport since 18 April 1955.[31]
References
- The Pennsylvania State Climatologist. Annual Average Number of Cloudy Days In Pennsylvania. Archived 2008-08-05 at the Wayback Machine Retrieved on 2008-01-28.
- The Pennsylvania State Climatologist. Climate of Pennsylvania. Archived February 25, 2009, at the Wayback Machine Retrieved on 2008-01-28.
- Roth, David M; Weather Prediction Center (2012). "Tropical Cyclone Rainfall in the Mid-Atlantic United States". Tropical Cyclone Rainfall Point Maxima. United States National Oceanic and Atmospheric Administration's National Weather Service. Retrieved June 23, 2012.
- Roth, David M. (October 18, 2017). "Tropical Cyclone Point Maxima". Tropical Cyclone Rainfall Data. United States Weather Prediction Center. Retrieved November 26, 2017.
- David M. Roth and Hugh D. Cobb III. RE-ANALYSIS OF THE GALE OF '78 - STORM 9 OF THE 1878 HURRICANE SEASON. Retrieved on 2008-03-05.
- "State Climate Extremes Committee". National Climatic Data Center. Retrieved December 26, 2017.
- Williams, Ashley (27 December 2017). "Record-breaking snowfall blankets Erie, Pennsylvania, with over 60 inches of snow". AccuWeather. Retrieved 28 December 2017.
- David M. Roth (October 15, 2010). "Tropical Cyclone Point Maxima". National Oceanographic and Atmospheric Administration. Retrieved November 11, 2010.
- "NowData - NOAA Online Weather Data". National Oceanic and Atmospheric Administration. Retrieved 2019-10-03.
- "Station Name: PA ALLENTOWN LEHIGH VALLEY INTL AP". National Oceanic and Atmospheric Administration. Retrieved 2019-10-03.
- "WMO Climate Normals for ALLENTOWN/A.-BETHLEHEM, PA 1961–1990". National Oceanic and Atmospheric Administration. Retrieved 2014-05-28.
- "NOWData - NOAA Online Weather Data". National Oceanic and Atmospheric Administration. Retrieved 2017-02-25.
- "PA Erie INTL AP". National Oceanic and Atmospheric Administration. Retrieved September 28, 2015.
- "WMO Climate Normals for Erie/INT'L ARPT, PA 1961–1990". National Oceanic and Atmospheric Administration. Retrieved September 28, 2015.
- ThreadEx
- "NowData - NOAA Online Weather Data". National Oceanic and Atmospheric Administration. Retrieved 2020-05-12.
- "Station Name: PA MIDDLETOWN HARRISBURG INTL AP". National Oceanic and Atmospheric Administration. Retrieved 2014-03-13.
- "WMO Climate Normals for HARRISBURG/CAPITAL CI AP PA 1961–1990". National Oceanic and Atmospheric Administration. Retrieved 2014-03-10.
- "Harrisburg, Pennsylvania, USA - Monthly weather forecast and Climate data". Weather Atlas. Retrieved 4 July 2019.
- ThreadEx; search for location= "PA - Philadelphia", variable= "Station thread"
- "NowData - NOAA Online Weather Data". National Oceanic and Atmospheric Administration. Retrieved 2016-04-13.
- Wood, Anthony R. "Snow total at airport gets a boost A new measuring station and technique likely contributed to two 8-inch-plus readings". Philly.com. The Inquirer. Archived from the original on 2014-07-28. Retrieved 2014-06-10.
- "Station Name: PA PHILADELPHIA INTL AP". National Oceanic and Atmospheric Administration. Retrieved 2020-07-18.
- "WMO Climate Normals for PHILADELPHIA/INT'L ARPT PA 1961–1990". National Oceanic and Atmospheric Administration. Retrieved 2020-07-18.
- "Philadelphia, Pennsylvania, USA - Monthly weather forecast and Climate data". Weather Atlas. Retrieved 2019-05-17.
- "NowData – NOAA Online Weather Data". National Oceanic and Atmospheric Administration. Retrieved 2018-02-21.
- "Station Name: PA PITTSBURGH INTL AP". National Oceanic and Atmospheric Administration. Retrieved 2020-07-19.
- "WMO Climate Normals for PITTSBURGH/GR PITTSBURGH INTL,PA 1961–1990". National Oceanic and Atmospheric Administration. Retrieved 2020-07-19.
- "Average Percent Sunshine through 2009". National Climatic Data Center. Retrieved 2012-11-15.
- "Pittsburgh, Pennsylvania, USA - Monthly weather forecast and Climate data". Weather Atlas. Retrieved 4 July 2019.
- ThreadEx
- "NowData - NOAA Online Weather Data". National Oceanic and Atmospheric Administration. Retrieved 2020-09-04.
- "Station Name: PA WILKES-BARRE INTL AP". National Oceanic and Atmospheric Administration. Retrieved 2016-09-11.
- "WMO Climate Normals for WILKES-BARRE-SCRANTON, PA 1961–1990". National Oceanic and Atmospheric Administration. Retrieved 2020-09-04.