Climate of Sydney
The climate of Sydney is humid subtropical (Köppen Cfa),[1] shifting from mild and cool in winter to warm and hot in the summer, with no extreme seasonal differences as the weather is moderated by proximity to the ocean,[2] although more contrasting temperatures are recorded in the inland western suburbs. Despite the fact that there is no distinct dry or wet season, rainfall peaks in the first half of the year and is at its lowest in the second half, though rainfall can be erratic throughout the year.[3][4][5] Precipitation varies across the region, with areas adjacent to the coast being the wettest.[6] The city receives around 20 thunderstorms per year.[7] According to the Bureau of Meteorology, Sydney falls in the temperate climate zone which has warm to hot summers[lower-alpha 1] and no dry season.[8]


Sydney has 109.5 clear days and 127.2 cloudy days annually,[9] though it would have over 300 days of visible sunshine if one would count partly cloudy days or sunny breaks.[10][11] The monthly percent possible sunshine ranges between 53% in January to 72% in August.[12] Sydney's heat is predominantly dry in spring, but usually humid in the summertime,[13] especially late summer – However, when temperatures soar over 35 °C (95 °F), the humidity is generally low as such high temperatures are brought by searing winds from the Australian desert.[14][15] On some hot summer days, low pressure troughs increase humidity and southerly busters decrease temperatures by late afternoon or early evening.[16][17] In late autumn and winter, east coast lows can bring large amounts of rainfall.[18] When the subtropical ridge is north of Sydney in late winter to early spring, the wind would come from the west or inland. As the ridge moves south in summer and autumn, the winds become easterly.[19][20][21]
Sydney experiences an urban heat island effect,[22] making certain parts of the city more vulnerable to extreme heat, particularly the west.[22] Efforts have been introduced to investigate and mitigate this heat effect, including increasing shade from tree canopies, adding rooftop gardens to high rise structures and changing pavement colour.[23][24] The El Niño Southern Oscillation, the Indian Ocean Dipole and the Southern Annular Mode[25][26] play an important role in determining Sydney's weather patterns: drought and bushfire on the one hand, and storms and flooding on the other. Sydney is prone to heat waves and drought, which have become more common in the 21st century.[27][28][29][30]
Seasons
Summer
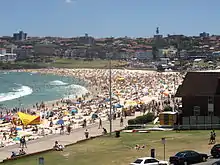
Summer in Sydney tends to vary, but it is generally warm to hot.[31] Though at times, sea breezes would moderate the temperatures and raise humidity. Temperatures tend to be stable in late summer where they rarely go below 21 °C (70 °F) or over 40 °C (104 °F), unlike late spring and early summer where such extremes would occur.[9]
When temperatures reach over 30 °C (86 °F), the relative humidity seldom exceeds 45%, although low pressure troughs can increase humidity in some hot days, especially in late summer, where they may provide afternoon thunderstorms that are usually accompanied by heavy rainfall and, at times, hail. Furthermore, most mornings and nights would be muggy, with the 9am relative humidity ranging from 69% to 75%.[9][32] The average 3pm dewpoint temperature in the summer ranges from 16.2 °C (61.2 °F) at the coast, to 14.4 °C (57.9 °F) inland. Dewpoints would be higher in late summer, reaching 20 °C (68 °F), especially in the mornings and evenings, although they would usually be lower in the heat of the day, dipping as low as 9 °C (48 °F) in the extremely hot day.[33]
In late spring and summer, Sydney can sometimes get northwesterly winds from the Outback, which are dry and hot, making the temperatures soar above 38 °C (100 °F), with the relative humidity as low as 15%. This happens after the northwesterlies are carried entirely over the continental landmass, not picking up additional moisture from a body of water and retaining most of their heat. On these occasions, Sydney can experience the fury of the desert climate,[34] although they are often ended with a Southerly Buster, which is a windy, shallow cold front that sweeps up from the southeast abruptly cooling the temperature. At times, it may be accompanied by a thunderstorm and drizzle, and it may keep the temperatures cool the following few days as well.[35][36]
In the Sydney central business district, an average of 15 days a year have temperatures of more than 30 °C (86 °F) and 3 days with temperatures over 35 °C (95 °F).[9] In contrast, western suburbs such as Liverpool and Penrith have 41 and 67 days with temperatures above 30 °C (86 °F), 10 and 19 days above 35 °C (95 °F), and, 1 and 4 days above 40 °C (104 °F), respectively.[32][37]
The highest recorded maximum temperature at Observatory Hill was 45.8 °C (114.4 °F) on 18 January 2013 during a prolonged heat wave across Australia from early December 2012 to late January 2013.[38] The highest recorded minimum at Observatory Hill is 27.6 °C (81.7 °F), registered on 6 February 2011.[9] A similar minimum temperature has also been recorded in the western suburbs.[32] The highest recorded maximum temperature for the western suburbs was recorded at Penrith with a high of 48.9°C (120 °F) on 4 January 2020.[39]
Autumn
.jpg.webp)
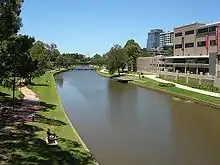
Late summer conditions usually continue until the first few weeks of April where maximum temperatures hover around 25 °C (77 °F) and 29 °C (84 °F) with the dewpoint being around 16 °C (61 °F) and 17 °C (63 °F) on average. Although, unlike late summer, the nights may be seemingly cooler and crispier. Most heavy rainfall events usually occur in late summer and early autumn as the subtropical ridge of high pressure, which rotates counterclockwise, is to the south of Australia and would therefore give way for moist easterlies from the Tasman Sea and as well as low pressure systems to penetrate the region.[25][21]
The transition from late summer to autumn is gradual, where noticeably cooler and crisper conditions taking in effect by around mid-April. In mid-autumn, the highs typically average at a pleasant 22 °C (72 °F) or 23 ° C (73 ° F), rarely going above 30 °C (86 °F) or below 20 °C (68 °F). In May, the average highs would be around 20 °C (68 °F) and 19 °C (66 °F) with cool and usually humid nights, that seldom dip below 10 °C (50 °F). Wintry highs of 18 °C (64 °F) may be expected in the last week of autumn.[40]
Temperatures in autumn are usually consistent and stable, lacking any extremes that tend to be experienced in spring and summer. Due to moist easterlies that prevail in this season, foggy mornings and overcast conditions should be expected. The average 9am relative humidity in autumn ranges from 72% to 80% in the Sydney region, the highest in the year.[32] The lowest maximum temperature in autumn is 11.3 °C (52.3 °F), recorded on 24 May 1904.[9]
Winter
In winter, the diurnal range in the western suburbs is relatively high, with temperatures being as high as 19 °C (66 °F) during the day and as low as 3 °C (37 °F) at night. Such low temperatures may provide mild to moderate frost in the western suburbs.[41] Winter in central Sydney tends to be more mild where the lows rarely drop below 7 °C (45 °F), and highs hovering at around 16 ° C (61 ° F) and 17 ° C (63 ° F) mainly due to proximity to the ocean.[9]

In the west, Liverpool and Richmond have 4 and 38 nights, respectively, where temperatures dip below 2 °C (36 °F). On average, only 1 night in Liverpool and 17 nights in Richmond have lows going below 0 °C (32 °F). The lowest maximum temperature in Liverpool was 8.2 °C (47 °F), recorded on 28 July 1981. Similar low maximums have been recorded in the Sydney region in winter.[32] 9am humidity ranges from 61% to 74% across the Sydney region, with the more higher figures experienced in June mornings. Highs of 12 °C (54 °F), whilst rare, are not unheard of in winter.[9][32]
Sydney receives around 15 days of fog annually,[42] which occurs in winter mornings, but more often in June when moist easterlies dominate. The inland suburbs would generally receive radiation fog thanks to nocturnal cooling under a clear sky of humid maritime air that was brought inland by the previous day's sea breeze. The coastal suburbs would mostly get an advective fog, which floats ashore from the meeting of warm water offshore and cold water nearby on the land. Heavier rain and cloudiness are also to be expected more in June, on average, than the latter winter months. [43]
During late winter, warm dry westerly winds which dominate may raise the maximum temperatures as high as 27 °C (81 °F) in some instances. As the subtropical ridge is north of Sydney in mid-late winter, it picks up dry westerlies from the continent's interior because of its anticlockwise rotation, thus producing more sunny days in the region,[25] hence why August has the highest sunshine percentage than any other month.[44]
The lowest recorded minimum at Observatory Hill was 2.1 °C (35.8 °F) on 22 June 1932,[9] while the coldest in the Sydney metropolitan area was −8 °C (18 °F), in Richmond. The lowest recorded maximum temperature at Observatory Hill was 7.7 °C (45.9 °F). Although not usually considered a suburb of Sydney, Picton, a town in the Macarthur Region of Sydney, recorded a low of −10.0 °C (14.0 °F) on 16 July 1970.[45]
Spring
.jpg.webp)
Early spring is rapidly transitional. Cool conditions from late winter may continue in September with the maximum temperature dipping as low as 18 °C (64 °F) at the coldest, but due to the drastic transition, temperatures above 30 °C (86 °F) can also be expected in that month. By November, summery conditions begin, with temperatures normally ranging between 24 °C (75 °F) and as high as 30 °C (86 °F), albeit with relatively low humidity.[47]
Because the subtropical ridge lies to the north of Sydney this time of the year, it will bring westerly winds from the interior that produce mostly sunny conditions,[25][21] at times warm, with the temperatures averaging between 21 °C (70 °F) and 25 °C (77 °F) with relatively low dewpoints, hovering between 4 °C (39 °F) and 12 °C (54 °F). Some days may be windy due to the dry westerlies and nights may be relatively cool, where temperatures plummet down to around 7 °C (45 °F) in some suburbs. Hot air from the interior that soar temperatures to over 35 °C (95 °F) can be expected, especially in the months of October and November. These conditions are rare in September, but not unheard of.[41]
Extreme, changeable and inconsistent temperatures are much more prevalent in spring than other seasons. In some occasions, hot dry days are cooled down by a southerly buster, which eventually lower the temperatures from 40 °C (104 °F) to as low as 19 °C (66 °F).[48] Such extremes usually happen in mid-late spring. Other seasons seldom see such fluctuations in a day's span. Furthermore, the diurnal range is higher in this season than it is in autumn.[9]
The lowest maximum temperature in spring was 9.5 °C (49.1 °F), recorded on 8 September 1869.[9] 9am relative humidity is the lowest in the year during spring, ranging from 58% to 68%, with early spring receiving lower figures.[32]
Microclimate


The region of Sydney is subject to phenomena typical of a microclimate, namely in late spring and summer, where the western suburbs would be hotter than the Sydney CBD by 6–10 °C (11–18 °F)[51] due to urban sprawl exacerbating the urban heat island effect and less exposure to mitigating sea breezes which cool down Sydney's eastern edge and would fail to move 9 km (5.6 mi) inland. The dramatic temperature difference between coastal and inland areas is caused by a combination of desert-warmed air from central Australia reaching the west, and as well as density of housing, lack of vegetation or open spaces, and the Blue Mountains which help trap the hot air.[52][53]
When it's 25 °C (77 °F) at Bondi for instance, the temperature will be around 30 °C (86 °F) just west of the Sydney Harbour Bridge, around 35 °C (95 °F) near Parramatta and as much as 40 °C (104 °F) 40 km (25 mi) inland. Such extreme temperature differences in the Sydney metropolitan area usually occur in late spring when the western Pacific Ocean is still quite cool and the inland air is warm.[54] Furthermore, within the CBD, heat maps show the area around Central Station (in Haymarket) is 0.5–1.0 °C (1–2 °F) warmer than Circular Quay and surrounds, making it the hottest place in the CBD.[55]
According to ecologist, Dr Sebastian Pfautsch from the University of Freiburg, in Sydney's hot days there could be discrepancies of up to 22 more days above 40 °C (104 °F) recorded in urban space compared to a weather station from the Bureau of Meteorology.[56] Because 48.9 °C (120.0 °F) was recorded in Penrith (on 4 January 2020), it won't be unusual to have a 50 °C (122 °F) reading somewhere nearby, especially if it lacked green space and retained heat to intensify heatwave temperatures.[52] Moreover, a heat logger registered a temperature of 52.0 °C (125.6 °F) at Berkshire Park, making it the hottest temperature ever recorded in the Sydney basin, albeit being an unofficial one.[57][58]
Urban heat island
A study by the University of Western Australia and RMIT indicated that the western suburbs have a much stronger urban heat island effect than those east of the CBD and that hotter temperatures in the west are human contributed due to solar radiation absorbing materials in black asphalt and dark roofs, anthropogenic heat from cars and less natural environments, thereby creating a "heat dome" that blocks the cooler air from the sea. Greening Australia stated that January mean maximum temperatures in the west have risen at a pace of 0.65°C per decade, over twice as much as eastern Sydney’s 0.28°C per decade.[59] The OEH warned that further development could cause more exceedingly hot days in the west by 2030.[53] Annually, coastal Sydney sees five heat-related deaths per 100,000 people while the western suburbs see 14 per 100,000.[55]
Urban heat island of the CBD has been efficaciously blocking the cooler air from reaching the inland suburbs because the CBD's "high temperature, is like a wall that stops the sea breeze in its tracks. Over Sydney’s CBD is a heat dome because of the high density of concrete and asphalt. If we want to cool western Sydney and demolish this wall, we need to cool the CBD first", Professor Mattheos Santamouris from UNSW states. He explained that cooling the CBD would reduce the temperature by 1.5 °C in the west and tree coverage could cool down suburban streets by as much as 10 °C (50 °F) in hot days since high-density housing developments and scarce trees trap heat.[55][60][50]
According to climate researchers, relatively easy modifications such as constructing fountains and water playgrounds could also lower temperatures in the western suburbs. The city now has 3.6% more trees in 2016 than it did in 2009 and Penrith City Council had planned to plant 100,000 trees from August 2018, in addition to planning a large city park, creating a water-sensitive urban design, street shading, and the use of cool materials in its building developments.[61] Furthermore, Parramatta City Council has installed 20 temperature sensors among different tree species in its suburbs to compare how different species can help reduce urban heat.[62][63]
Warm and cool periods

The Bureau of Meteorology reported in 2011 that 2002 to 2005 had been the warmest years in Sydney since records began in 1859. 2004 saw an average daily maximum temperature of 23.4 °C (74.1 °F), 2005 of 23.4 °C (74.1 °F), 2002 of 22.9 °C (73.2 °F), and 2003 of 22.7 °C (72.9 °F). The average daily maximum between 1859 and 2004 was 21.6 °C (70.9 °F). Seven (of the ten) warmest years in 151 years of recordkeeping have occurred in the ten years between 2001 and 2010, with this decade being the warmest on record for minimum temperatures.[64][65]
The Bureau of Meteorology reported that the summer of 2007–08 was the coolest in 11 years, the wettest in six years, the cloudiest in 16 years, and one of only three summers in recorded history to lack a maximum temperature above 31 °C (88 °F).[66] The Bureau of Meteorology reported that 2009 was a warm year. The average annual daytime temperature at Observatory Hill was 22.9 °C (73.2 °F), which is 0.9 °C (1.6 °F) above the historical annual average. This ranks as the seventh highest annual average maximum temperature since records commenced in 1859.[67] 2010 was the equal fourth warmest year on record for Sydney, with an average maximum of 22.6 °C (72.7 °F), which was 0.6 °C (1.1 °F) above the historical annual average.
In 2013, the city had the warmest July and September on record,[68][69] with September being one of the driest. In September, temperatures were 4 °C (7 °F) above average[70] and the city had over seven days where temperatures reached 28 °C (82 °F), making it more similar to November's weather pattern.[71] October 2015 had the warmest nights on record, which were 3.3 °C (5.9 °F) above average.[72] The warming trend continued in 2016 as Sydney's warmest autumn ever was recorded.[73] July 2017 to June 2018 in southeastern Australia proved to be the hottest financial year on record with maximum temperatures being the warmest on record and minimums above average.[74]
Sydney experienced its hottest summer since records began in the summer of 2016-17, with more than 10 days over 35 °C (95 °F). Sydney's 2017 mean temperature of 19.5 °C (67.1 °F) degrees was 1.7 °C (3.1 °F) degrees above the long term average and the second highest value in 158 years of records. The warmest year on record was 2016, with a mean temperature of 19.6 °C (67.3 °F) degrees.[75] On 7 January 2018, Sydney was the hottest place on Earth.[76] In April 2018, Sydney had the longest running hot spell for that month with nine consecutive days of temperatures reaching 25 °C (77 °F). Furthermore, the airport and parts of the western suburbs also broke heat records in that month.[77]
Precipitation

Rainfall is somewhat evenly spread through the year, with moderate to low variability. It is slightly higher during the first half of the year (February–June) when the subtropical ridge is to the south of the continent, thereby allowing easterly winds and low pressure systems to dominate on the east coast. Rainfall will tend to be lower in the second half of the year (July–October) when the subtropical ridge is to just the north of the city where it picks up dry winds from the continent's interior towards Sydney (as it rotates counter-clockwise) and this will be when clockwise-rotating low pressure systems are to the south of the continent.[21][78][79] Due to the unpredictability of rain, the wettest and driest months would change on a yearly basis.[80]
Within the city and surrounds, rainfall varies, from around 700 mm (27.56 in) at Badgerys Creek[81] (in the west) to 1,400 mm (55.12 in) at Turramurra (the northeast) in the Northern Suburbs, which create an orographic rainfall.[82] Even in its months of highest rainfall, Sydney has relatively few rainy days, with an average mean of 7 to 8 rainy days per month on the 1 mm (0.04 in) threshold, despite having a moderate to high amount of annual rainfall at around 800 mm (31.50 in) to 1,100 mm (43.31 in) (depending on the area) – This illustrates that Sydney generally receives short-lived, heavy rainfall day events, usually not lasting more than 2 or 3 days, which give away to mostly propitious conditions for many weeks to months even, especially during an El Niño period (though during a La Niña event, rainfall may be intermittent for many days or weeks).[83]
Rain hours are longer in the winter than in the summer, with rainfall lingering on for the whole day. In some days, rain may come in drizzle form, though this is rare as most rain comes mostly from major storms. In the warm months, rain comes in short heavy downpours in the afternoons, usually cooling the conditions and providing some respite.[84] Sometimes these afternoon showers give away to the sun again, although black nor'easters may provide rainfall for a few consecutive days.[85][9][32]
Sydney experiences east coast lows, which tend strike between the months of May and August (though they can occur in other months as well), usually during a positive SAM phase.[86] The precipitation of the low comes from a nimbostratus cloud that would dump as much as 70 mm (2.76 in) of rain for as much as two days, with the CBD getting higher precipitation amount.[87] Also in winter, thanks to onshore winds and Sydney's coastal proximity, the CBD would be susceptible to some light rain and drizzle – These conditions usually don't penetrate the inland suburbs. However, the western suburbs are more inclined to have heavy rain and thunder in the summer.[88]
The city is rarely affected by cyclones, although remnants of ex-cyclones do affect the city.[89] The city is prone to severe hail storms, such as the 1947 Sydney hailstorm, wind storms, and flash flooding from rain caused either by East Coast Lows (such as the major storm in early June 2007) or ex-tropical cyclone remnants. East Coast Lows are low pressure depressions that can bring significant damage by heavy rain, cyclonic winds and huge swells. Scientists have predicted that rainfall will become more unpredictable and temperatures will be on the rise.[90][91]
The annual evaporation rate for Sydney is 1,600 mm (62.99 in),[92] with the rate in the summer being 600 mm (23.62 in)[93] and in winter 300 mm (11.81 in).[94]
Snowfall
Snow is extremely rare in Sydney and was last reported in the Sydney area in 1836. T. A. Browne, who kept weather observations, noted that "the years 1836, 1837 and 1838 were years of drought, and in one of these years (1836) a remarkable thing happened. There was a fall of snow; we made snowballs at Enmore and enjoyed the usual schoolboy amusements therewith". The Sydney Herald reported on the same incident, saying, "for the first time in the memory of the oldest inhabitants, snow fell in Sydney on the morning of Tuesday last. 27 June 1836, about 7 o'clock in the morning, a drifting fall covered the streets nearly one inch in depth."[95]
On 27 July 2008, a fall of graupel, or soft hail, blanketed Lindfield, Roseville and Killara in white, as it was cold enough to prevent the soft hail from melting when it fell, thereby preserving it as a soft, melting ice when it reached the ground. Because of its snow-like appearance, the graupel was mistaken by many residents for snow. Owing to this event, a senior forecaster from the Bureau of Meteorology doubted the 1836 snow account, stating weather observers in that time period lacked the technology and skill to distinguish snow from soft hail.[96]
The Blue Mountains, a temperate oceanic region bordering on Sydney's metropolitan area, have a reputation for snow in winter, with places such as Katoomba, Leura and Blackheath receiving the most snow due to their higher elevation. Despite the reputation, there are only around five snowy days per year in the upper mountains area with two settled falls per season, and another five to ten days of light snow showers or sleet. Settled snow has become less common in recent decades.[97] It is extremely rare to see snow below Lawson.[98]
Wind
Averaging at 13.8 km/h (8.6 mph), November is the windiest month, whilst March is the calmest at 11.3 km/h (7.0 mph) in the CBD.[9] Some suburbs in the metropolitan area tend to be the windiest in January, September, October or December, and calmest in the months of May or June.[99][100] As a whole, the Sydney region is generally the windiest from October to January and calmest from March to June. The more windier locations are those by the coast, such as the eastern suburbs. The prevailing wind annually is northeasterly. In the warm months, only 40% of the time Sydney would get wind directions from the northwest or southwest, which are the dry winds flown from the heated interior of Australia.[101]
Northeasterlies and easterly sea breezes are dominant from early summer to early autumn, because the anticlockwise-rotating subtropical ridge is to the south of the city where it allows winds from the sea to penetrate. Westerlies are dominant in late winter to mid-spring as the subtropical ridge is just to the north of the city, picking up winds from the interior and blocking easterlies from the sea.[21]
Southerly busters are expected from October to the end of March. They typically look like as if a sheet of cloud is rolled up like a scroll by the advancing wind. The change of wind (in the warm months) is sometimes very sudden, where it may be fresh northeasterly and in ten minutes a southerly gale. Katabatic winds are light, south-westerly drainage winds, akin to land breezes, that occur when air of higher density in the Blue Mountains descends under gravity force into the Sydney metropolitan area and the Hawkesbury Basin, usually during a winter night.[102][103][104]
| Wind direction in Sydney from 2002 to 2012 (average values) | |||||||
|---|---|---|---|---|---|---|---|
| North | Northeast | East | South East | Southern | Southwest | West | Northwest |
| 5.9% | 16.9% | 14.1% | 14.6% | 24.9% | 4.1% | 11.9% | 7.6% |
| Source: world-weather.info | |||||||
Föhn effect
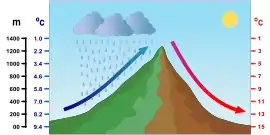
Since Sydney borders the Blue Mountains (part of the Great Dividing Range), it would experience a Föhn-like type of wind,[105] which is a dry westerly that raises the air temperature in the lee of the mountains and reduce atmospheric moisture due to the partial orographic obstruction of comparatively damp low-level air and the subsiding of drier upper-level air in leeward of the mountains. As the moist air rises, it cools and it would condense, thereby creating precipitation on the upwind slopes. The precipitation then gets rid of the moisture from the air mass on the lee side, and the condensation raises the air temperature as it descends the lee slopes because of the adiabatic compression.[106]
During this condition, an orographic cloud band, or the Föhn wall, builds up along the ridgelines of the NSW highlands due to condensation of moisture as the air ascends the windward slopes. Meanwhile, the Föhn arch, with its broad layer of altostratus cloud, shapes downwind of the mountains in the ascending component of a standing lee mountain wave. In weather maps, a band of clear air called the Föhn gap, which is over the downwind of the Blue Mountains region, can be seen between the wall and arched cloud cover. Much like the Santa Ana winds in California, they may elevate fire danger in the warmer months, due to their dry, gusty nature.[107][108]
In winter, Föhn-like winds can be particularly damaging to homes and would affect flights, in addition to being uncomfortable, as the wind chill factor would usually make the temperatures feel cooler than what they are.[109] These southwesterly winds, which average between 60 km/h (37 mph) to 70 km/h (43 mph), are generally brought on by a large polar air mass from the southwest of the continent, usually strengthened by the roaring forties,[110] and a deep low pressure system.[111] Typically occurring between winter and spring during a negative SAM event, the winds would usually cause rainfall, snowfall and/or sleet in the windward side of the mountains, but would provide clear and relatively warmer conditions on the lee side of the mountain range in the Sydney region.[112]
Drought
Sydney's climate appears to be becoming drier; The city has had fewer rain days in recent years than shown in the long-term climate table above. In summer, Sydney can go for long periods without rainfall. The other phenomenon that arises from these long, dry and hot periods is bushfires, which occur frequently in the areas surrounding the city. Water supply is a recurring concern for the city during drought periods. In 2005 the reservoirs reached an all-time low. However, water levels since then have recovered in 2013.
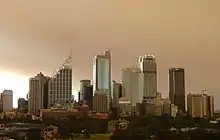
Many areas of the city bordering bushland have experienced bushfires, notably in 1994 and 2001–02 — these tend to occur during the spring and summer. Heatwaves, which are regularly occurring in recent years, would usually lead to water restrictions and a high risk of bushfires, which sometimes bring a smoky haze to the city. Smog is noticeable on hot days, even without bushfires.[113][114][115]
The years 2009 and 2010 had dry conditions, according to Bureau of Meteorology.[116] On 23 September 2009, a dust storm that started in South Australia and inland New South Wales blanketed the city with reddish orange skies early in the morning. Originating from the north-eastern region of South Australia, the dust storm lifted thousands of tons of dirt and soil which were then dumped in Sydney Harbour and the Tasman Sea.[117] It stretched as far north as southern Queensland and it was the worst dust storm in 70 years.[118] During that year, Sydney experienced a number of warm winter days, dry gusty winds and another milder dust storm.[119][120]

In 2011, Sydney had the driest February in 30 years with only 18 mm (0.71 in) of rain falling, which is well below the average of 118 mm (4.6 in). Some of the western suburbs recorded the lowest total February rainfall on record.[121] In September 2013, the combination of dry weather, warm temperatures and strong winds brought early-season bushfires. Major bushfires impacted western Sydney and the Blue Mountains, resulting in some evacuations, closed roads, and destroyed homes.[69] The summer of 2013-14 was the driest in 72 years. The precipitation of December 2013 and January 2014, inclusively, only added up to 48.4 mm (1.91 in), which is only a quarter of a typical amount for December and January. Observatory Hill only received 17 mm (0.67 in) of rain in January.[122]
September 2017 was the driest on record, with the gauge receiving only 0.2 mm (0.0079 in) of rain. Furthermore, in that year, the city received less than half of its long-term average rainfall between July and December.[123] In the late morning and early lunchtime of 22 November 2018, a dust storm, stretching about 500 kilometres, swept through Sydney due to a low pressure trough and cold front that picked up dry soil in drought-ridden areas of far western NSW that week. Milder compared to the 2009 storm, the effect of the dust was still apparent across iconic locations such as the Sydney Opera House and Sydney Harbour Bridge.[124]
Furthermore, 2018 in Sydney has been one of the driest in a century, with the Greater Western Sydney farming region being the worst affected.[125] Due to the widespread bushfires in December 2019, which even affected the western periphery of the city, the Sydney metropolitan area suffered from dangerous smoky haze for several days throughout the month, with the air quality being 11 times the hazardous level in some days,[126][127] even making it worse than New Delhi's,[128] where it was also equalled to "smoking 32 cigarettes."[129] 2019 was one of Sydney's warmest in 161 years and the driest since 2005, which had a few days of raised dust and as well as declining dam levels. Rainfall in December was just 1.6 millimetres at Observatory Hill, overthrowing the record low of 2.8 millimetres recorded for the month in 1979.[130]
Historical season descriptions
Aboriginal
The Sydney Basin was in the Tharawal country. Each clan had knowledge of their area and the season changes. These were the seasons of the Sydney region according to the Aboriginal people living there:[131]
- January–March (Burran): Hot and dry
- April–June (Marrai'gang): Wet, becoming cooler
- June–July (Burrugin): Cold, frosty, short days
- July–August (Wiritjiribin): Cold and windy
- September–October (Ngoonungi): Cool, getting warmer
- November–December (Parra'dowee): Warm and wet
British
In 1819, British explorer William Wentworth describes Sydney's climate as, "highly salubrious and delightful, although the heats in summer are sometimes excessive, the thermometer frequently rising in the shade to ninety, and even to a 100 °F (38 °C) and upwards of Fahrenheit...This, it must be admitted, is a degree of heat that would be highly oppressive to Europeans, were it not that the sea breeze sets in regularly about nine o'clock in the morning". He continues, "If the summers are occasionally a little too hot for the European constitution, it will be remembered that the extreme heats which I have noticed as happening during the north-west winds, are of but short continuance; and that the sea and land breezes, which prevail at this season in an almost uninterrupted succession, moderate the temperature so effectually, that even new comers are but little incommoded by it".[132]
He then concludes, "The hot season, however, which is undoubtedly the most unhealthy part of the year, does not, as will have been perceived, continue above four months. The remaining eight possess a temperature so highly moderate and congenial to the human constitution, that the climate of this colony would upon the whole, appear to justify the glowing enthusiasm of those who have ventured to call it the Montpellier of the world."[132]
Below, Wentworth describes Sydney's seasonal and annual weather patterns in analytical detail:[132]

- Summer
During these three months violent storms of thunder and lightning are very frequent, and the heavy falls of rain which take place on these occasions, tend considerably to refresh the country, of which the verdure in all but low moist situations entirely disappears. At this season the most unpleasant part of the day is the interval which elapses between the cessation of the land breeze and the setting in of the sea. This happens generally between six and eight o'clock in the morning, when the thermometer is upon an average at about 72 °F (22 °C). During this interval the sea is as smooth as glass, and not a zephyr is found to disport even among the topmost boughs of the loftiest trees.
- Autumn
The weather in March is generally very unsettled. This month, in fact, may be considered the rainy season, and has been more fertile in floods than any other of the year. The thermometer varies during the day about 12 °C, being at day-light as low as from 55 to 60 °F (13 to 16 °C), and at noon as high as from 70 to 75 °F (21 to 24 °C). The sea and land breezes at this time become very feeble, although they occasionally prevail during the whole year. The usual winds from the end of March to the beginning of September, are from S. to S. W.
The weather in the commencement of April is frequently showery, but towards the middle it gradually becomes more settled, and towards the conclusion perfectly clear and serene. The thermometer at the beginning of the month varies from 72 to 74 °F (22 to 23 °C) at noon, and from the middle to the end gradually declines to 66 °F (19 °C) and sometimes to 60 °F (16 °C). In the mornings it is as low as 52 °F (11 °C), and fires become in consequence general throughout the colony.
The weather in the month of May is truly delightful. The atmosphere is perfectly cloudless, and the mornings and evenings become with the advance of the month more chilly, and render a good fire a highly comfortable and cheering guest. Even during the middle of the day the most violent exercise may be taken without inconvenience. The thermometer at sun-rise is under 50 °F (10 °C), and seldom above 60 °F (16 °C) at noon.
- Winter
The three winter months are June, July, and August. During this interval the mornings and evenings are very chilly, and the nights excessively cold. Hoar frosts are frequent, and become more severe the further you advance into the interior. Ice 0.5 inches (1.3 cm) thick is found at the distance of 20 mi (32 km) from the coast. Very little rain falls at this season, but the dews are very heavy when it does not freeze, and tend considerably to preserve the young crops from the effects of drought. Fogs too are frequent and dense in low damp situations, and on the banks of the rivers. The mean temperature at day-light is from 40 to 45 °F (4 to 7 °C), and at noon from 55 to 60 °F (13 to 16 °C).
- Spring
The spring months are September, October, and November. In the beginning of September the fogs still continue; the nights are cold, but the days clear and pleasant. Towards the close of this month the cold begins very sensibly to moderate. Light showers occasionally prevail, accompanied with thunder and lightning. The thermometer at the beginning of the month is seldom above 60 °F (16 °C) at noon, but towards the end frequently rises to 70 °F (21 °C)
In October there are also occasional showers, but the weather upon the whole is clear and pleasant. The days gradually become warmer, and the blighting north-west winds are to be apprehended. The sea and land breezes again resume their full sway. The thermometer at sun-rise varies from 60 to 65 °F (16 to 18 °C), and at noon is frequently up to 80 °F (27 °C).
In November the weather may be again called hot. Dry parching winds prevail as the month advances, and squalls of thunder and lightning with rain or hail. The thermometer at day-light is seldom under 65 °F (18 °C), and frequently at noon rises to 80 °F (27 °C), 84 °F (29 °C), and even 90 °F (32 °C).
— William Wentworth, Statistical, Historical, and Political Description of NSW
Classifications
| Climatic scheme | Initials | Description |
|---|---|---|
| Köppen system[133][1] | Cfa | Humid subtropical climate |
| Trewartha system[134][135] | Cf | Subtropical humid climate |
| Alisov system[136] | N/A | Subtropical oceanic climate |
| Strahler system[137] | N/A | Moist subtropical climate |
| Thornthwaite system[138] | Humid and mesothermal | |
| Neef system[139][140] | N/A | Humid climate of trade winds |
Climate data
| Month | Jan | Feb | Mar | Apr | May | Jun | Jul | Aug | Sep | Oct | Nov | Dec | Year |
|---|---|---|---|---|---|---|---|---|---|---|---|---|---|
| Record high °C (°F) | 45.8 (114.4) |
42.1 (107.8) |
39.8 (103.6) |
35.4 (95.7) |
30.0 (86.0) |
26.9 (80.4) |
26.5 (79.7) |
31.3 (88.3) |
34.6 (94.3) |
38.2 (100.8) |
41.8 (107.2) |
42.2 (108.0) |
45.8 (114.4) |
| Average high °C (°F) | 27.0 (80.6) |
26.8 (80.2) |
25.7 (78.3) |
23.6 (74.5) |
20.9 (69.6) |
18.2 (64.8) |
17.9 (64.2) |
19.3 (66.7) |
21.6 (70.9) |
23.2 (73.8) |
24.2 (75.6) |
25.7 (78.3) |
22.8 (73.0) |
| Average low °C (°F) | 20.0 (68.0) |
19.9 (67.8) |
18.4 (65.1) |
15.3 (59.5) |
12.3 (54.1) |
10.0 (50.0) |
8.9 (48.0) |
9.7 (49.5) |
12.3 (54.1) |
14.6 (58.3) |
16.6 (61.9) |
18.4 (65.1) |
14.7 (58.5) |
| Record low °C (°F) | 10.6 (51.1) |
9.6 (49.3) |
9.3 (48.7) |
7.0 (44.6) |
4.4 (39.9) |
2.1 (35.8) |
2.2 (36.0) |
2.7 (36.9) |
4.9 (40.8) |
5.7 (42.3) |
7.7 (45.9) |
9.1 (48.4) |
2.1 (35.8) |
| Average rainfall mm (inches) | 91.1 (3.59) |
131.5 (5.18) |
117.5 (4.63) |
114.1 (4.49) |
100.8 (3.97) |
142.0 (5.59) |
80.3 (3.16) |
75.1 (2.96) |
63.4 (2.50) |
67.7 (2.67) |
90.6 (3.57) |
73.0 (2.87) |
1,147.1 (45.16) |
| Average rainy days (≥ 1 mm) | 8.2 | 9.0 | 10.1 | 7.9 | 7.9 | 9.3 | 7.2 | 5.6 | 5.8 | 7.6 | 8.7 | 7.9 | 95.2 |
| Average afternoon relative humidity (%) | 60 | 62 | 59 | 58 | 58 | 56 | 52 | 47 | 49 | 53 | 57 | 58 | 56 |
| Average dew point °C (°F) | 16.5 (61.7) |
17.2 (63.0) |
15.4 (59.7) |
12.7 (54.9) |
10.3 (50.5) |
7.8 (46.0) |
6.1 (43.0) |
5.4 (41.7) |
7.8 (46.0) |
10.2 (50.4) |
12.6 (54.7) |
14.6 (58.3) |
11.4 (52.5) |
| Mean monthly sunshine hours | 232.5 | 205.9 | 210.8 | 213.0 | 204.6 | 171.0 | 207.7 | 248.0 | 243.0 | 244.9 | 222.0 | 235.6 | 2,639 |
| Percent possible sunshine | 53 | 54 | 56 | 61 | 59 | 60 | 65 | 72 | 66 | 61 | 55 | 55 | 60 |
| Average ultraviolet index | 12 | 11 | 9 | 6 | 3 | 2 | 3 | 4 | 5 | 8 | 10 | 12 | 7 |
| Source 1: Bureau of Meteorology[9][141] | |||||||||||||
| Source 2: Bureau of Meteorology, Sydney Airport (sunshine hours);[142] Weather Atlas (average UV index)[143] | |||||||||||||
| Climate data for Sydney Airport (Eastern Sydney) | |||||||||||||
|---|---|---|---|---|---|---|---|---|---|---|---|---|---|
| Month | Jan | Feb | Mar | Apr | May | Jun | Jul | Aug | Sep | Oct | Nov | Dec | Year |
| Record high °C (°F) | 46.4 (115.5) |
42.9 (109.2) |
41.2 (106.2) |
35.7 (96.3) |
29.1 (84.4) |
25.6 (78.1) |
26.7 (80.1) |
30.9 (87.6) |
35.6 (96.1) |
39.1 (102.4) |
43.4 (110.1) |
43.2 (109.8) |
46.4 (115.5) |
| Average high °C (°F) | 27.7 (81.9) |
27.1 (80.8) |
25.8 (78.4) |
23.3 (73.9) |
20.6 (69.1) |
18.1 (64.6) |
17.7 (63.9) |
19.1 (66.4) |
21.6 (70.9) |
23.6 (74.5) |
24.6 (76.3) |
26.4 (79.5) |
23.0 (73.4) |
| Average low °C (°F) | 20.0 (68.0) |
20.0 (68.0) |
18.5 (65.3) |
15.2 (59.4) |
12.1 (53.8) |
9.8 (49.6) |
8.5 (47.3) |
9.3 (48.7) |
11.9 (53.4) |
14.4 (57.9) |
16.5 (61.7) |
18.4 (65.1) |
14.5 (58.1) |
| Record low °C (°F) | 13.0 (55.4) |
12.0 (53.6) |
8.8 (47.8) |
7.1 (44.8) |
3.8 (38.8) |
2.2 (36.0) |
0.8 (33.4) |
3.2 (37.8) |
5.1 (41.2) |
6.0 (42.8) |
7.6 (45.7) |
11 (52) |
0.8 (33.4) |
| Average rainfall mm (inches) | 80.7 (3.18) |
117.2 (4.61) |
96.3 (3.79) |
98.2 (3.87) |
89.3 (3.52) |
125.9 (4.96) |
69.5 (2.74) |
63.3 (2.49) |
59.0 (2.32) |
55.5 (2.19) |
72.3 (2.85) |
67.1 (2.64) |
996.2 (39.22) |
| Average rainy days (≥ 1 mm) | 7.8 | 8.6 | 9.4 | 8.2 | 7.6 | 8.9 | 7.0 | 5.4 | 6.3 | 7.4 | 8.6 | 7.9 | 93.1 |
| Average afternoon relative humidity (%) | 59 | 62 | 60 | 58 | 59 | 58 | 53 | 46 | 49 | 52 | 56 | 57 | 56 |
| Average dew point °C (°F) | 16.2 (61.2) |
16.8 (62.2) |
15.5 (59.9) |
12.7 (54.9) |
9.9 (49.8) |
7.6 (45.7) |
5.6 (42.1) |
5.5 (41.9) |
7.7 (45.9) |
9.9 (49.8) |
12.3 (54.1) |
14.3 (57.7) |
11.2 (52.2) |
| Source 1: Bureau of Meteorology[144] (1991-2020 averages, records 1939-) | |||||||||||||
| Source 2: [145] | |||||||||||||
| Climate data for Parramatta (Western Sydney) | |||||||||||||
|---|---|---|---|---|---|---|---|---|---|---|---|---|---|
| Month | Jan | Feb | Mar | Apr | May | Jun | Jul | Aug | Sep | Oct | Nov | Dec | Year |
| Record high °C (°F) | 45.5 (113.9) |
44.5 (112.1) |
40.5 (104.9) |
37.0 (98.6) |
29.2 (84.6) |
25.5 (77.9) |
25.9 (78.6) |
30.6 (87.1) |
35.4 (95.7) |
40.1 (104.2) |
42.7 (108.9) |
43.9 (111.0) |
45.5 (113.9) |
| Average high °C (°F) | 28.5 (83.3) |
27.9 (82.2) |
26.3 (79.3) |
23.8 (74.8) |
20.6 (69.1) |
17.8 (64.0) |
17.4 (63.3) |
19.1 (66.4) |
21.7 (71.1) |
24.0 (75.2) |
25.4 (77.7) |
27.5 (81.5) |
23.3 (73.9) |
| Average low °C (°F) | 17.6 (63.7) |
17.6 (63.7) |
15.9 (60.6) |
12.8 (55.0) |
9.9 (49.8) |
7.5 (45.5) |
6.3 (43.3) |
7.1 (44.8) |
9.4 (48.9) |
12.0 (53.6) |
14.1 (57.4) |
16.3 (61.3) |
12.2 (54.0) |
| Record low °C (°F) | 10.1 (50.2) |
9.2 (48.6) |
6.8 (44.2) |
4.0 (39.2) |
1.4 (34.5) |
0.8 (33.4) |
−1.0 (30.2) |
0.7 (33.3) |
0.7 (33.3) |
3.6 (38.5) |
4.0 (39.2) |
7.7 (45.9) |
−1.0 (30.2) |
| Average rainfall mm (inches) | 100.7 (3.96) |
124.8 (4.91) |
109.3 (4.30) |
88.5 (3.48) |
70.5 (2.78) |
87.1 (3.43) |
45.6 (1.80) |
56.1 (2.21) |
52.8 (2.08) |
68.1 (2.68) |
87.0 (3.43) |
70.2 (2.76) |
958.6 (37.74) |
| Average rainy days (≥ 0.2 or 0.1 mm) | 12.0 | 12.1 | 12.6 | 9.4 | 9.8 | 10.6 | 8.2 | 7.9 | 8.0 | 10.1 | 11.7 | 10.2 | 122.6 |
| Average afternoon relative humidity (%) | 57 | 59 | 59 | 58 | 60 | 59 | 55 | 46 | 46 | 49 | 54 | 55 | 55 |
| Average dew point °C (°F) | 16.7 (62.1) |
17.2 (63.0) |
15.6 (60.1) |
12.5 (54.5) |
10.6 (51.1) |
8.3 (46.9) |
6.7 (44.1) |
5.5 (41.9) |
7.4 (45.3) |
10.0 (50.0) |
12.8 (55.0) |
14.9 (58.8) |
11.5 (52.7) |
| Source 1: Bureau of Meteorology[146] | |||||||||||||
| Source 2: [147] | |||||||||||||
| Climate data for Liverpool (South-western Sydney) | |||||||||||||
|---|---|---|---|---|---|---|---|---|---|---|---|---|---|
| Month | Jan | Feb | Mar | Apr | May | Jun | Jul | Aug | Sep | Oct | Nov | Dec | Year |
| Record high °C (°F) | 44.8 (112.6) |
45.8 (114.4) |
41.0 (105.8) |
37.1 (98.8) |
29.6 (85.3) |
25.9 (78.6) |
26.8 (80.2) |
30.5 (86.9) |
35.4 (95.7) |
39.8 (103.6) |
43.3 (109.9) |
43.5 (110.3) |
45.8 (114.4) |
| Average high °C (°F) | 28.2 (82.8) |
27.9 (82.2) |
26.4 (79.5) |
23.9 (75.0) |
20.5 (68.9) |
17.8 (64.0) |
17.3 (63.1) |
18.9 (66.0) |
21.5 (70.7) |
23.7 (74.7) |
25.3 (77.5) |
27.5 (81.5) |
23.2 (73.8) |
| Average low °C (°F) | 17.6 (63.7) |
17.7 (63.9) |
15.9 (60.6) |
12.4 (54.3) |
9.3 (48.7) |
6.3 (43.3) |
4.7 (40.5) |
5.8 (42.4) |
8.3 (46.9) |
11.5 (52.7) |
13.8 (56.8) |
16.2 (61.2) |
11.6 (52.9) |
| Record low °C (°F) | 7.8 (46.0) |
9.4 (48.9) |
5.0 (41.0) |
3.2 (37.8) |
−1.5 (29.3) |
−2.0 (28.4) |
−5.0 (23.0) |
−3.4 (25.9) |
−1.8 (28.8) |
3.3 (37.9) |
4.7 (40.5) |
7.8 (46.0) |
−5.0 (23.0) |
| Average precipitation mm (inches) | 97.6 (3.84) |
94.9 (3.74) |
101.0 (3.98) |
85.3 (3.36) |
68.8 (2.71) |
71.3 (2.81) |
40.2 (1.58) |
55.9 (2.20) |
45.6 (1.80) |
61.6 (2.43) |
78.3 (3.08) |
67.4 (2.65) |
867.7 (34.16) |
| Average precipitation days (≥ 0.1 mm) | 10.7 | 10.4 | 10.9 | 8.3 | 9.3 | 8.6 | 7.2 | 7.4 | 8.0 | 9.3 | 10.4 | 9.1 | 109.6 |
| Average afternoon relative humidity (%) | 54 | 55 | 56 | 52 | 58 | 54 | 50 | 44 | 45 | 45 | 49 | 51 | 51 |
| Average dew point °C (°F) | 15.9 (60.6) |
16.3 (61.3) |
14.8 (58.6) |
11.4 (52.5) |
10.5 (50.9) |
7.5 (45.5) |
5.5 (41.9) |
5.0 (41.0) |
6.5 (43.7) |
8.9 (48.0) |
11.6 (52.9) |
14.1 (57.4) |
10.7 (51.3) |
| Source: [148] | |||||||||||||
| Climate data for Penrith (Greater Western Sydney) | |||||||||||||
|---|---|---|---|---|---|---|---|---|---|---|---|---|---|
| Month | Jan | Feb | Mar | Apr | May | Jun | Jul | Aug | Sep | Oct | Nov | Dec | Year |
| Record high °C (°F) | 48.9 (120.0) |
46.9 (116.4) |
40.6 (105.1) |
34.2 (93.6) |
28.4 (83.1) |
26.0 (78.8) |
28.2 (82.8) |
29.7 (85.5) |
37.3 (99.1) |
38.9 (102.0) |
44.9 (112.8) |
44.1 (111.4) |
48.9 (120.0) |
| Average high °C (°F) | 30.8 (87.4) |
29.3 (84.7) |
27.5 (81.5) |
24.4 (75.9) |
21.0 (69.8) |
18.1 (64.6) |
17.7 (63.9) |
19.9 (67.8) |
23.3 (73.9) |
25.9 (78.6) |
27.3 (81.1) |
29.2 (84.6) |
24.5 (76.1) |
| Daily mean °C (°F) | 24.8 (76.6) |
23.9 (75.0) |
22.1 (71.8) |
18.8 (65.8) |
15.2 (59.4) |
12.5 (54.5) |
11.6 (52.9) |
13.1 (55.6) |
16.4 (61.5) |
19.0 (66.2) |
21.2 (70.2) |
23.1 (73.6) |
18.4 (65.1) |
| Average low °C (°F) | 18.5 (65.3) |
18.5 (65.3) |
16.6 (61.9) |
13.1 (55.6) |
9.3 (48.7) |
6.9 (44.4) |
5.4 (41.7) |
6.2 (43.2) |
9.4 (48.9) |
12.1 (53.8) |
15.0 (59.0) |
16.9 (62.4) |
12.3 (54.1) |
| Record low °C (°F) | 10.6 (51.1) |
11.6 (52.9) |
8.3 (46.9) |
3.6 (38.5) |
2.1 (35.8) |
−1.1 (30.0) |
−1.4 (29.5) |
−0.5 (31.1) |
2.2 (36.0) |
5.0 (41.0) |
7.8 (46.0) |
9.8 (49.6) |
−1.4 (29.5) |
| Average precipitation mm (inches) | 90.4 (3.56) |
131.6 (5.18) |
73.1 (2.88) |
42.2 (1.66) |
40.0 (1.57) |
51.6 (2.03) |
29.6 (1.17) |
30.1 (1.19) |
31.9 (1.26) |
54.5 (2.15) |
82.9 (3.26) |
60.1 (2.37) |
719.2 (28.31) |
| Average precipitation days (≥ 0.2 mm) | 11.5 | 11.7 | 11.8 | 10.3 | 11.6 | 15.2 | 12.4 | 8.5 | 7.5 | 9.3 | 12.1 | 10.7 | 132.6 |
| Average afternoon relative humidity (%) | 47 | 53 | 52 | 49 | 52 | 55 | 50 | 41 | 40 | 41 | 46 | 45 | 48 |
| Average dew point °C (°F) | 14.7 (58.5) |
16.2 (61.2) |
14.4 (57.9) |
10.8 (51.4) |
8.9 (48.0) |
7.2 (45.0) |
5.2 (41.4) |
3.9 (39.0) |
6.2 (43.2) |
7.5 (45.5) |
10.8 (51.4) |
12.6 (54.7) |
9.9 (49.8) |
| Source: [100] | |||||||||||||
| Climate data for Camden Airport AWS (South-western Sydney) | |||||||||||||
|---|---|---|---|---|---|---|---|---|---|---|---|---|---|
| Month | Jan | Feb | Mar | Apr | May | Jun | Jul | Aug | Sep | Oct | Nov | Dec | Year |
| Record high °C (°F) | 46.4 (115.5) |
45.6 (114.1) |
41.0 (105.8) |
38.5 (101.3) |
29.5 (85.1) |
24.9 (76.8) |
27.0 (80.6) |
30.2 (86.4) |
36.5 (97.7) |
40.5 (104.9) |
42.6 (108.7) |
43.1 (109.6) |
46.4 (115.5) |
| Average high °C (°F) | 29.5 (85.1) |
28.6 (83.5) |
26.8 (80.2) |
23.8 (74.8) |
20.6 (69.1) |
17.7 (63.9) |
17.3 (63.1) |
19.0 (66.2) |
21.9 (71.4) |
24.3 (75.7) |
26.3 (79.3) |
28.5 (83.3) |
23.7 (74.7) |
| Average low °C (°F) | 16.8 (62.2) |
16.8 (62.2) |
14.9 (58.8) |
11.1 (52.0) |
7.1 (44.8) |
4.6 (40.3) |
3.0 (37.4) |
3.9 (39.0) |
6.8 (44.2) |
9.9 (49.8) |
13.0 (55.4) |
15.2 (59.4) |
10.2 (50.4) |
| Record low °C (°F) | 7.9 (46.2) |
7.2 (45.0) |
1.0 (33.8) |
−0.7 (30.7) |
−2.2 (28.0) |
−5.4 (22.3) |
−6.0 (21.2) |
−4.0 (24.8) |
−1.8 (28.8) |
1.3 (34.3) |
3.8 (38.8) |
5.7 (42.3) |
−6.0 (21.2) |
| Average precipitation mm (inches) | 84.1 (3.31) |
96.9 (3.81) |
89.3 (3.52) |
68.5 (2.70) |
53.5 (2.11) |
67.0 (2.64) |
37.6 (1.48) |
46.0 (1.81) |
39.6 (1.56) |
61.2 (2.41) |
75.8 (2.98) |
56.8 (2.24) |
777.3 (30.60) |
| Average precipitation days (≥ 0.1 mm) | 10.5 | 11.0 | 10.5 | 10.0 | 8.9 | 9.3 | 8.5 | 8.0 | 8.3 | 9.6 | 10.3 | 9.2 | 105.2 |
| Average afternoon relative humidity (%) | 49 | 52 | 52 | 52 | 52 | 53 | 50 | 43 | 44 | 47 | 50 | 46 | 49 |
| Average dew point °C (°F) | 14.7 (58.5) |
15.1 (59.2) |
13.8 (56.8) |
11.0 (51.8) |
8.5 (47.3) |
6.2 (43.2) |
4.7 (40.5) |
4.0 (39.2) |
6.2 (43.2) |
8.8 (47.8) |
11.6 (52.9) |
12.5 (54.5) |
9.8 (49.6) |
| Source: [149] | |||||||||||||
| Climate data for Sydney CBD (Mean Maximum and Mean Minimum) | |||||||||||||
|---|---|---|---|---|---|---|---|---|---|---|---|---|---|
| Month | Jan | Feb | Mar | Apr | May | Jun | Jul | Aug | Sep | Oct | Nov | Dec | Year |
| Mean maximum °C (°F) | 31.1 (88.0) |
30.3 (86.5) |
28.7 (83.7) |
26.8 (80.2) |
24.1 (75.4) |
21.0 (69.8) |
20.8 (69.4) |
23.0 (73.4) |
26.7 (80.1) |
29.0 (84.2) |
29.3 (84.7) |
30.3 (86.5) |
31.1 (88.0) |
| Mean minimum °C (°F) | 17.2 (63.0) |
17.2 (63.0) |
15.5 (59.9) |
12.5 (54.5) |
9.5 (49.1) |
7.3 (45.1) |
6.4 (43.5) |
7.0 (44.6) |
9.0 (48.2) |
11.2 (52.2) |
13.2 (55.8) |
15.4 (59.7) |
6.4 (43.5) |
| Source: [9] | |||||||||||||
| Climate data for Western Sydney – Prospect Reservoir (Mean Maximum and Mean Minimum) | |||||||||||||
|---|---|---|---|---|---|---|---|---|---|---|---|---|---|
| Month | Jan | Feb | Mar | Apr | May | Jun | Jul | Aug | Sep | Oct | Nov | Dec | Year |
| Mean maximum °C (°F) | 35.4 (95.7) |
34.0 (93.2) |
31.1 (88.0) |
28.0 (82.4) |
23.8 (74.8) |
20.0 (68.0) |
19.8 (67.6) |
22.7 (72.9) |
27.1 (80.8) |
31.0 (87.8) |
32.5 (90.5) |
34.0 (93.2) |
35.4 (95.7) |
| Mean minimum °C (°F) | 14.6 (58.3) |
15.0 (59.0) |
13.0 (55.4) |
9.7 (49.5) |
6.0 (42.8) |
3.9 (39.0) |
2.7 (36.9) |
3.5 (38.3) |
5.7 (42.3) |
8.3 (46.9) |
10.6 (51.1) |
13.0 (55.4) |
2.7 (36.9) |
| Source: [99] | |||||||||||||
| Climate data for Far-western Sydney – Penrith (Mean Maximum and Mean Minimum) | |||||||||||||
|---|---|---|---|---|---|---|---|---|---|---|---|---|---|
| Month | Jan | Feb | Mar | Apr | May | Jun | Jul | Aug | Sep | Oct | Nov | Dec | Year |
| Mean maximum °C (°F) | 39.1 (102.4) |
35.7 (96.3) |
33.0 (91.4) |
29.0 (84.2) |
24.8 (76.6) |
20.7 (69.3) |
20.9 (69.6) |
23.8 (74.8) |
29.2 (84.6) |
33.1 (91.6) |
34.8 (94.6) |
37.0 (98.6) |
39.1 (102.4) |
| Mean minimum °C (°F) | 15.5 (59.9) |
15.5 (59.9) |
13.8 (56.8) |
9.6 (49.3) |
4.9 (40.8) |
2.7 (36.9) |
1.6 (34.9) |
2.3 (36.1) |
5.6 (42.1) |
8.0 (46.4) |
11.4 (52.5) |
13.6 (56.5) |
1.6 (34.9) |
| Source: [100] | |||||||||||||
| Miscellaneous data for Sydney | |||||||||||||
|---|---|---|---|---|---|---|---|---|---|---|---|---|---|
| Month | January | February | March | April | May | June | July | August | September | October | November | December | Year |
| Average sea temperature °C (°F) | 23.3 (73.9) |
23.7 (74.7) |
23.4 (74.1) |
22.7 (72.8) |
20.7 (69.3) |
19.3 (66.8) |
19.1 (66.4) |
18.8 (65.8) |
18.5 (65.3) |
19.2 (66.5) |
20.6 (69.0) |
21.9 (71.4) |
20.9 (69.6) |
| Mean daily daylight hours | 13.5 | 13.4 | 12.4 | 11.3 | 10.4 | 10.0 | 10.1 | 10.9 | 11.9 | 13.0 | 13.9 | 14.4 | 12.1 |
| Average Ultraviolet index | 12 | 11 | 8 | 6 | 5 | 3 | 2 | 3 | 5 | 8 | 10 | 11 | 7.0 |
| Source: Bureau of Meteorology (UV index)[150] | |||||||||||||
| Source #2: Metoc (sea temperature) [151] | |||||||||||||
Temperature extremes
| Highest monthly average temperature | |||||||||||||
| Parameter | Jan | Feb | March | April | May | June | July | Aug | Sept | Oct | Nov | Dec | |
|---|---|---|---|---|---|---|---|---|---|---|---|---|---|
| Sydney CBD[152] | 29.6 °C (85.3 °F) (2017) | 29.0 °C (84.2 °F) (1998) | 27.1 °C (80.8 °F) (2006) | 26.1 °C (79.0 °F) (2018) | 23.2 °C (73.8 °F) (2014) | 20.3 °C (68.5 °F) (1957) | 19.9 °C (67.8 °F) (2018) | 21.3 °C (70.3 °F) (1995) | 24.4 °C (75.9 °F) (1988) | 26.2 °C (79.2 °F) (1988) | 26.6 °C (79.9 °F) (2019) | 28.6 °C (83.5 °F) (2005) | |
| Bankstown Airport (Western Sydney)[153] | 32.3 °C (90.1 °F) (2019) | 30.8 °C (87.4 °F) (2017) | 28.8 °C (83.8 °F) (1998) | 27.8 °C (82.0 °F) (2018) | 23.4 °C (74.1 °F) (2016) | 19.7 °C (67.5 °F) (2004) | 20.0 °C (68.0 °F) (2018) | 21.9 °C (71.4 °F) (1995) | 25.4 °C (77.7 °F) (2013) | 27.6 °C (81.7 °F) (1988) | 28.6 °C (83.5 °F) (2009) | 30.8 °C (87.4 °F) (2017) | |
| Penrith (Far-West)[154] | 34.9 °C (94.8 °F) (2019) | 32.7 °C (90.9 °F) (2004) | 30.5 °C (86.9 °F) (1998) | 28.6 °C (83.5 °F) (2018) | 23.5 °C (74.3 °F) (2016) | 20.1 °C (68.2 °F) (2004) | 20.3 °C (68.5 °F) (2018) | 21.9 °C (71.4 °F) (2009) | 26.3 °C (79.3 °F) (2013) | 28.9 °C (84.0 °F) (2013) | 31.8 °C (89.2 °F) (2009) | 33.5 °C (92.3 °F) (2019) | |
| Lowest monthly average temperature | |||||||||||||
| Parameter | Jan | Feb | March | April | May | June | July | Aug | Sept | Oct | Nov | Dec | |
|---|---|---|---|---|---|---|---|---|---|---|---|---|---|
| Sydney CBD | 23.1 °C (73.6 °F) (1948) | 23.6 °C (74.5 °F) (1860) | 22.4 °C (72.3 °F) (1870) | 20.0 °C (68.0 °F) (1893) | 16.6 °C (61.9 °F) (1898) | 14.1 °C (57.4 °F) (1887) | 13.4 °C (56.1 °F) (1896) | 14.9 °C (58.8 °F) (1943) | 17.4 °C (63.3 °F) (1889) | 19.2 °C (66.6 °F) (1903) | 20.6 °C (69.1 °F) (1943) | 22.5 °C (72.5 °F) (1924) | |
| Prospect Reservoir (Western Sydney)[155] | 24.0 °C (75.2 °F) (1965) | 24.9 °C (76.8 °F) (1966) | 22.6 °C (72.7 °F) (1967) | 21.1 °C (70.0 °F) (1983) | 18.1 °C (64.6 °F) (1968) | 14.6 °C (58.3 °F) (1968) | 14.4 °C (57.9 °F) (1966) | 15.7 °C (60.3 °F) (1967) | 17.6 °C (63.7 °F) (1966) | 19.9 °C (67.8 °F) (1966) | 22.5 °C (72.5 °F) (1971) | 23.4 °C (74.1 °F) (2011) | |
- Highest minimum (Sydney CBD)[9]
|
|
Rainfall extremes
| Highest daily rainfall | |||||||||||||
| Parameter | Jan | Feb | March | April | May | June | July | Aug | Sept | Oct | Nov | Dec | |
|---|---|---|---|---|---|---|---|---|---|---|---|---|---|
| Sydney CBD[9] | 191.0 mm (7.5 in) (17 Jan 1988) | 243.6 mm (9.6 in) (3 Feb 1990) | 280.7 mm (11.1 in) (28 Mar 1942) | 191.0 mm (7.5 in) (29 Apr 1860) | 212.3 mm (8.4 in) (28 May 1889) | 150.6 mm (5.9 in) (11 Jun 1991) | 198.1 mm (7.8 in) (7 Jul 1931) | 327.6 mm (12.9 in) (6 Aug 1986) | 144.5 mm (5.7 in) (10 Sep 1879) | 161.8 mm (6.4 in) (13 Oct 1902) | 234.6 mm (9.2 in) (28 Nov 2018) | 126.0 mm (5.0 in) (14 Dec 1991) | |
| Western Sydney (Prospect Reservoir)[99] | 161.2 mm (6.3 in) (31 Jan 2001) | 165.0 mm (6.5 in) (10 Feb 2020) | 153.9 mm (6.1 in) (20 Mar 1892) | 163.1 mm (6.4 in) (16 Apr 1946) | 314.2 mm (12.4 in) (28 May 1889) | 163.4 mm (6.4 in) (11 Jun 1991) | 143.5 mm (5.6 in) (10 Jul 1904) | 321.0 mm (12.6 in) (6 Aug 1986) | 96.5 mm (3.8 in) (2 Sep 1970) | 102.1 mm (4.0 in) (5 Oct 1916) | 126.2 mm (5.0 in) (14 Nov 1969) | 154.9 mm (6.1 in) (13 Dec 1910) | |
- Lowest monthly rainfall (Sydney CBD)[9]
|
|
- Lowest monthly rainfall (Prospect Reservoir)[99]
|
|
|
See also
- Climate of Australia
- Geography of Sydney
- Environment of Australia
- Australian region tropical cyclone
- Climate change in Australia
- Effects of global warming on Australia
Notes
- Sydney CBD and the Northern Suburbs are within the warm summer zone, whereas Greater Western Sydney is in the hot summer zone.
References
- "Modelling and simulation of seasonal rainfall" (PDF). Centre for Computer Assisted Research Mathematics and its Applications (CARMA). 20 May 2014. Retrieved 25 February 2016.
Brisbane and Sydney each have a humid sub-tropical or temperate climate with no pronounced dry season...the classification is Cfa
- "Australian climatic zones". Australian Government. Bureau of Meteorology. Archived from the original on 5 July 2008. Retrieved 21 December 2008.
- "Sydney future: high temps, erratic rain". The Sydney Morning Herald.
- "Commuters in Sydney and eastern NSW brace for erratic weather". News.com.au.
- "Climate and the Sydney 2000 Olympic Games". Australian Government. Australian Bureau of Statistics. 24 September 2007. Archived from the original on 10 June 2008. Retrieved 21 December 2008.
- "Sydney Basin - climate". New South Wales Government. Department of Environment and Climate Change. Retrieved 21 December 2008.
- "Average annual thunder-day map". Archived from the original on 12 February 2017. Retrieved 12 February 2017.
- "Map 2. Sub divisions within the key climate groups". Australian Government. Bureau of Meteorology. Retrieved 18 November 2020.
- "Sydney (Observatory Hill) Period 1991-2020". Bureau of Meteorology. Retrieved 14 April 2020.
- "CLIMATE IN AUSTRALIA". Tourism Australia 2020. Retrieved 11 November 2020.
- "Sydney Australia Weather". RemarkableSydneyTravelTips. Retrieved 11 November 2020.
- "Climate statistics for Australian locations Sydney Airport AMO". Bureau of Meteorology.
- "Australian Climate Averages - Relative Humidity (February)". Bureau of Meteorology. Retrieved 11 January 2018.
- "Hot Enough? Things are going to get hotter". The Sydney Morning Herald. 2014. Retrieved 30 October 2014.
- "Sydney heatwave". Daily Liberal. 2013. Retrieved 4 February 2014.
- "Sea Breezes on the NSW Coast". BOM. Ken Batt. Retrieved 12 November 2014.
- Batt, K, 1995: Sea breezes on the NSW coast, Offshore Yachting, Oct/Nov 1995, Jamieson Publishing.
- "About East Coast Lows". Bureau of Meteorology. Retrieved 6 April 2013.
- Sydney weather: fog shrouds city before the sun finally emerges
- Sydney weather: Planes diverted, ferries cancelled as city blanketed in fog
- "THE LATITUDE OF THE SUBTROPICAL RIDGE OVER EASTERN AUSTRALIA: THE L INDEX REVISITED". INTERNATIONAL JOURNAL OF CLIMATOLOGY, Bureau of Meteorology Research Centre. 16 March 2005. Retrieved 29 September 2020.
- "Sydney area an 'urban heat island' vulnerable to extreme temperatures". The Sydney Morning Herald. 14 January 2016. Retrieved 14 January 2016.
- "Urban heat island effect - City of Sydney". City of Sydney.com. Archived from the original on 29 January 2016. Retrieved 14 January 2016.
- "Cooling cities - urban heat island effect" (PDF). aila.org.au. 2013. Retrieved 14 January 2016.
- "Southern Annular Mode: The climate 'influencer' you may not have heard of". ABC News. Retrieved 29 September 2020.
- "Special Climate Statement 71—severe fire weather conditions in southeast Queensland and northeast New South Wales in September 2019" (PDF). Bureau of Meteorology. 24 September 2019. Retrieved 5 January 2020.
- "Sydney heatwave: Is it hot enough for you?". The Sydney Morning Herald. 10 October 2013. Retrieved 23 January 2014.
- "Living in Sydney". Sydney Institute of Business & Technology. Archived from the original on 1 August 2008. Retrieved 21 December 2008.
- "Water quality and drought". Sydney Water. Archived from the original on 20 November 2009.
- "Drought". Archived from the original on 15 January 2012.
- McDonald, Josephine (2008). Dreamtime superhighway an analysis of Sydney Basin rock art and prehistoric information exchange. Canberra, A.C.T.: ANU E Press. p. 11. ISBN 9781921536175.
- "Liverpool". Climate statistics for Australian locations. Bureau of Meteorology. Retrieved 15 November 2014.
- Torok, S. and Nicholls, N. 1996. A historical annual temperature dataset for Australia. Aust. Met. Mag., 45, 251–60.
- Heatwave blows in on a fiery desert wind
- Sydney Weather
- Southerly buster
- "Climate statistics for Penrith Lakes". Bureau of Meteorology. Retrieved 21 February 2015.
- "Special Climate Statement 43 – extreme heat in January 2013" (PDF). Bureau of Meteorology. 1 February 2013. Retrieved 2 February 2013.
- Rawsthorne, Janek Drevikovsky, Sally (4 January 2020). "'Hottest place on the planet': Penrith in Sydney's west approaches 50 degrees". The Sydney Morning Herald. Retrieved 5 January 2020.
- Power, S., Tseitkin, F., Torok, S., Lavery, B., Dahni, R. and McAvaney, B. 1998. Australian temperature, Australian rainfall and the Southern Oscillation, 1910–1992: coherent variability and recent changes. Aust. Met. Mag., 47, 85–101
- Sydney’s Climate
- The Great Australian Weather Debate! Which Australian City has the best weather? Gungahlin Weather Centre - March 2002. Retrieved 28 November 2029
- Russell, H. C. 1877. Climate of New South Wales: Descriptive, Historical, and Tabular. C. Potter, Sydney, Australia.
- Evans, J. P., Ji, F., Lee, C., Smith, P., Argüeso, D., and Fita, L. (2014) A regional climate modelling projection ensemble experiment – NARCliM, Geoscientific Model Development, 7(2), 621-629, doi: 10.5194/gmd-7-621- 2014.
- "Climate statistics for Picton". Bureau of Meteorology. Retrieved 18 November 2013.
- It’s peak jacaranda season: Here’s where to see them by Wilson Smith, The Daily Telegraph, 25 October 2018
- in August 2013: Warm, dry, sunny end to winter
- Climate Change in the Sydney Metropolitan Catchments
- Greater Sydney Commission report: Sydney’s gaping urban heat and liveability imbalance by Poppy Johnston from The Fifth State. Retrieved 28 November 2020.
- These two Western Sydney streets are completely different temperatures — here's why By Mridula Amin from ABC News. Retrieved 28 November 2020
- First western Sydney microclimate maps reveal extent of heat variation in region by Mirage News. Retrieved 25 November 2020.
- Extreme measures: An ecologist’s urban sensors show us just how hot Western Sydney is getting by Foreground.com.au. Retrieved 25 November 2020
- Sydney weather: How urbanisation creates hot microclimates in our suburbs by The Sydney Morning Herald. Retrieved 25 November 2020
- 16-degree temperature difference in Sydney suburbs on Friday: Why? by Anthony Sharwood from Weatherzone
- ‘Heat dome’ surrounding Australian CBDs leave suburbs to scorch by Benedict Brook from News.com.au. Retrieved 25 November 2020.
- Tiny sensors and giant temperature map could help cool Western Sydney by Wendy Frew from The Fifth State. Retrieved 28 November 2020
- New data shows Sydney suburbs reached temperatures over 50C last summer by Anton Nilsson from News.com.au. Retrieved 26 November 2020
- The Sydney suburbs that hit 50C last summer by Angus Thompson from The Sydney Morning Herald. Retrieved 26 November 2020
- How the west got hot by Joshua Kindl, Georgina Goddard, Zac Gay & Lachlan Moffet Gray from the University of Technology Sydney. Retrieved 26 November 2020
- Urban Heat by the NSW government. Retrieved 25 November 2020
- Sydney’s New Suburbs Are Too Hot for People to Live In by Emily Cadman from Bloomberg News. Retrieved 26 November 2020
- During its hottest summer, Penrith calls on the experts to help it cool down by The Fifth State. Retrieved 25 November 2020.
- How Western Sydney is tackling the mysterious 'heat island' effect behind rising temperatures By Yasmin Parry from ABC News. Retrieved 25 November 2020
- Sydney in 2010: 18th consecutive warm year
- Special Climate Statement 27 - An exceptional summer heatwave in greater Sydney and the Hunter Valley. 8 February 2011
- Sydney has coolest summer in 11 years in Sydney Climate Summary — NSW Regional Office, Bureau of Meteorology. Retrieved 25 March 2008.
- Year 2009: Very warm with below average rainfall in Sydney
- Sydney in July 2013: Warmest July on record
- Sydney in September 2013: Warmest September on record
- Climate Council reports warmest September on record
- September’s average temperature for Sydney beats 33-year-old record
- October blew away heat records for any month of any year: Bureau of Meteorology
- "Warm weather set to continue as smoke from burns lingers in Sydney". ABC. 22 May 2016. Retrieved 31 May 2016.
- Hottest financial year on record BOM data shows By Kate Doyle (ABC News)
- "Weather forecast: Sydney, Brisbane, Adelaide heatwave hell". News.com.au. 10 February 2017. Retrieved 10 February 2017.
- McInnes, William (8 January 2018). "Sydney clocks the hottest place on Earth as hot weather continues". The Sydney Morning Herald. Retrieved 8 January 2018.
- Kennedy, Jean (8 January 2018). "Sydney has its hottest April day on record and the endless summer looks set to continue". ABC news. Retrieved 10 April 2018.
- Climate of Sydney Australia the Good and the Bad
- Australia > New South Wales > Sydney Archived 18 February 2011 at the Wayback Machine
- "Climate statistics for Bankstown Airport". Bureau of Meteorology. Retrieved 13 April 2013.
- "Badgerys Creek AWS". Climate statistics for Australian locations. Bureau of Meteorology. Retrieved 19 January 2014.
- Ku-ring-gai Historical Society. "Turramurra".
- "The Lost Seasons".
- Australian Rainfall & Runoff PROJECT 1 Development of Intensity Frequency-Duration Information across Australia Climate Change Research Plan Project, Engineers Australia, December 2015
- "BLACK NOR-EASTER". The Sydney Morning Herald. National Library of Australia. 30 October 1911. p. 7. Retrieved 27 March 2015.
- Southern Annular Mode and the Australian climate – The Southern Annular Mode in winter Bureau of Meteorology. Retrieved 23 January 2021
- The climate of Sydney, Australia E. Linacre and B. Geerts. November 1998
- Storm hits Sydney after scorching day of hot weather
- Tropical Cyclones in New South Wales
- < "Weather & climate". Retrieved 25 December 2014.
- East Coast Lows
- Average pan evaporation - Average annual, monthly and seasonal evaporation Bureau of Meteorology
- Average pan evaporation - Summer Bureau of Meteorology
- Average pan evaporation - Winter Bureau of Meteorology
- MacDonnell, Freda. Thomas Nelson (Australia) Limited, 1967. Before King's Cross
- "Sydney weather hail, not snow". AAP. 27 July 2008. Archived from the original on 6 January 2009. Retrieved 11 August 2008.
- "Blackheath". The Sydney Morning Herald. 15 August 2007. Retrieved 24 June 2013.
- "Climate Statistics for Australian Locations". web page. Australian Government Bureau of Meteorology. 2011. Retrieved 31 May 2011.
- "Climate statistics for Prospect Reservoir". Bureau of Meteorology. Retrieved 8 August 2020.
- "Climate statistics for Penrith Lakes". Bureau of Meteorology.
- Wind & weather statistics Botany Bay/Sydney Airport
- Mark Harris (7 June 2019). Confronting Global Climate Change: Experiments & Applications in the Tropics. CRC Press. pp. 8–. ISBN 978-1-00-000178-5.
- The climate of Sydney, Australia by E. Linacre and B. Geerts, November 1998. Retrieved 18 April 2020
- Appendix D Western Sydney Airport Usability Report Pages 4 & 15, Head of Aviation and Defence Weather Services, Bureau of Meteorology, 8/04/2015. Retrieved 18 April 2020
- Drechsel, S., Mayr, G.J. (2008) Objective forecasting of foehn winds for a subgrid-scale alpine valley. Weather and Forecasting, 23, 205-218.
- Sharples, J.J. Mills, G.A., McRae, R.H.D., Weber, R.O. (2010) Elevated fire danger conditions associated with foehn-like winds in southeastern Australia. Journal of Applied Meteorology and Climatology.
- Sharples, J.J., McRae, R.H.D., Weber, R.O., Mills, G.A. (2009) Foehn-like winds and fire danger anomalies in southeastern Australia. Proceedings of the 18th IMACS World Congress and MODSIM09. 13–17 July, Cairns.
- Hoinka, K.P. (1985) Observation of airflow over the Alps during a foehn event. Quarterly Journal of the Royal Meteorological Society, 111, 199-224.
- Cold, damaging winds blast Sydney by The Leader, 9 August 2019. Retrieved 22 April 2020
- Wilder winds, less rain, as Roaring Forties become Furious Fifties By Peter Hannam and Environment Editor, Sydney Morning Herald, 11 May 2014. Retrieved 6 August 2020
- Sydney weather: Flights cancelled as wild winds set to batter NSW throughout weekend by Seven News, Saturday, 10 August 2019. Retrieved 22 April 2020
- BOM warns NSW to brace for worse weather as strong winds tear roof off Newcastle nursing home by ABC News Australia, 9 August 2019. Retrieved 22 April 2020
- The Best Time to Visit Sydney - Summer
- "Sydney climate and weather averages". Weather2Travel. 2014. Retrieved 5 October 2014.
- "Bondi Beach water temperature". Meteo365.com. 2013. Retrieved 5 October 2014.
- "Year 2009: Very warm with below average rainfall in Sydney". Bom.gov.au. 4 January 2010. Retrieved 19 January 2014.
- Ramachandran, Arjun (23 September 2009). "Sydney turns red: dust storm blankets city". The Sydney Morning Herald.
- Brisbane on alert as dust storms sweep east
- "Sydney in Autumn 2010". Bom.gov.au. Retrieved 1 June 2010.
- "Third warmest winter on record for Sydney". Bom.gov.au. 27 August 1995. Retrieved 1 June 2010.
- Sydney in January 2011: Warm start to 2011
- "Sydney in midst of driest summer for more than 70 years". The Sydney Morning Herald. 3 February 2014. Retrieved 28 January 2015.
- "2017 brought another year of weather extremes as drought and heat took its toll". Sydney Morning Herald. 2017. Retrieved 2 January 2018.
- Dust storm hits Sydney, NSW Government issues air quality warning by Jamie McKinnell and Angelique Lu (ABC News)
- Worst drought in more than 100 years now on Sydney’s doorstep by Jack Morphet (News.com.au)
- "Sydney smoke haze reaches 11 times the hazardous level". Retrieved 1 January 2020.
- "Sydney smoke: bushfires haze smothers landmarks – in pictures". Retrieved 1 January 2020.
- "Bushfire smoke makes Sydney air quality worse than Delhi". Retrieved 1 January 2020.
- "Sydney fire haze equal to 'smoking 32 cigarettes'". Retrieved 1 January 2020.
- "'There's clearly a warming trend. You can't not see it': Our year of wild weather". The Sydney Morning Herald. 2 January 2020. Retrieved 2 January 2020.
- "Indigenous Weather Knowledge". Bom.gov.au. Retrieved 22 December 2020.
- Statistical, Historical, and Political Description of NSW by William Charles Wentworth, 1819
- "Sydney, New South Wales Köppen Climate Classification (Weatherbase)". Weatherbase. Retrieved 3 July 2019.
- "GLOBAL ECOLOGICAL ZONING FOR THE GLOBAL FOREST RESOURCES ASSESSMENT 2000". www.fao.org. Retrieved 3 July 2019.
- "Trewartha maps". kkh.ltrr.arizona.edu. Retrieved 3 July 2019.
- Cmapm, Kliimavöötmed svg: Urmasderivative work (16 June 2011), Русский: Климатические пояса Земли по Б. П. Алисову., retrieved 3 July 2019
- "World Strahler Climate Map".
- Feddema, Johannes J. (1 January 2005). "A Revised Thornthwaite-Type Global Climate Classification". Physical Geography. 26 (6): 442–466. doi:10.2747/0272-3646.26.6.442. ISSN 0272-3646.
- "Klimaklassifikation". www.spektrum.de (in German). Retrieved 3 July 2019.
- "Klimazonen nach E. Neef (1989)". Klett-Perthes.
- "Sydney (Observatory Hill): all years". Bureau of Meteorology. Retrieved 4 June 2018.
- "Climate statistics for Australian locations Sydney Airport AMO". Bureau of Meteorology.
- "Sydney, Australia - Climate data". Weather Atlas. Retrieved 2 December 2020.
- "Sydney Airport AMO". Climate statistics for Australian locations. Bureau of Meteorology. Retrieved 14 April 2020.
- http://www.bom.gov.au/jsp/ncc/cdio/weatherData/av?p_nccObsCode=122&p_display_type=dailyDataFile&p_startYear=2016&p_c=-872174116&p_stn_num=066037
http://www.bom.gov.au/jsp/ncc/cdio/weatherData/av?p_nccObsCode=123&p_display_type=dailyDataFile&p_startYear=2016&p_c=-872174312&p_stn_num=066037 - "Parramatta". Climate statistics for Australian locations. Bureau of Meteorology. Retrieved 5 August 2017.
- "Definitions for rainfall". Bureau of Meteorology. Retrieved 5 July 2016.
- "Climate statistics for Liverpool". Bureau of Meteorology.
- "Climate statistics for Camden". Bureau of Meteorology. Retrieved 5 October 2017.
- "Average solar ultraviolet (UV) Index". Bureau of Meteorology. Retrieved 31 March 2017.
- "Monthly Sydney water temperature chart". World sea temperature. Retrieved 6 August 2017.
- Monthly mean maximum temperature for Sydney (Observatory Hill) by the Bureau of Meteorology
- Monthly mean maximum temperature for Bankstown Airport AWS by the Bureau of Meteorology
- Monthly mean maximum temperature for Penrith Lakes AWS by the Bureau of Meteorology
- Monthly mean maximum temperature for Prospect Reservoir by the Bureau of Meteorology
External links
| Wikimedia Commons has media related to Weather events in Sydney. |
