Corrèze, Corrèze
Corrèze is a commune in the central French department of Corrèze.
Corrèze | |
|---|---|
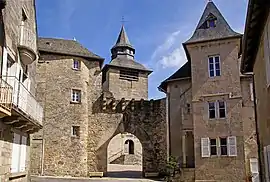 Port Margot, Corrèze's mediaeval gateway to the old part of the village | |
.svg.png.webp) Coat of arms | |
Location of Corrèze 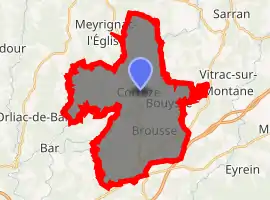
| |
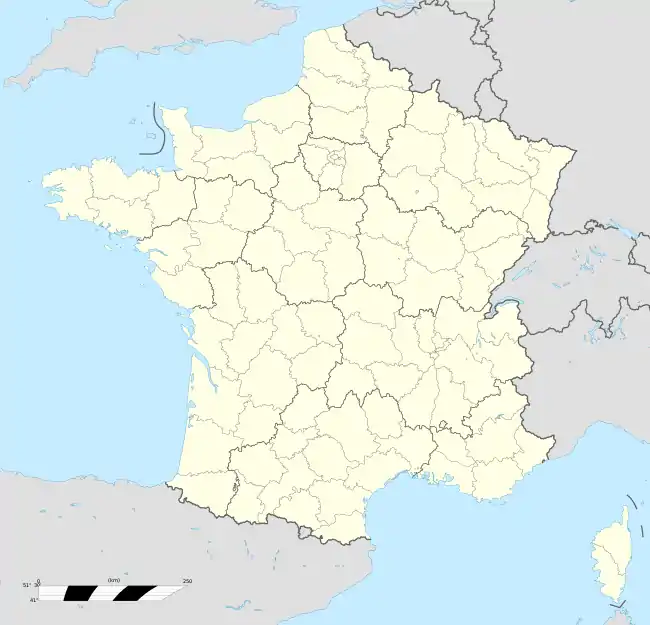 Corrèze 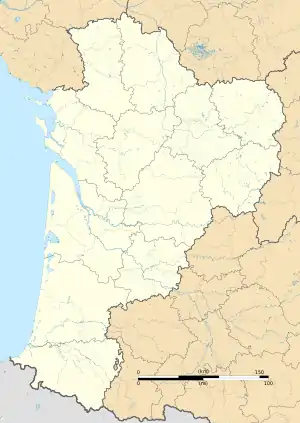 Corrèze | |
| Coordinates: 45°22′24″N 1°52′33″E | |
| Country | France |
| Region | Nouvelle-Aquitaine |
| Department | Corrèze |
| Arrondissement | Tulle |
| Canton | Naves |
| Government | |
| • Mayor (2014–2020) | Jean-François Labbat |
| Area 1 | 34.16 km2 (13.19 sq mi) |
| Population (2017-01-01)[1] | 1,128 |
| • Density | 33/km2 (86/sq mi) |
| Time zone | UTC+01:00 (CET) |
| • Summer (DST) | UTC+02:00 (CEST) |
| INSEE/Postal code | 19062 /19800 |
| Elevation | 295–644 m (968–2,113 ft) |
| 1 French Land Register data, which excludes lakes, ponds, glaciers > 1 km2 (0.386 sq mi or 247 acres) and river estuaries. | |
Geography
Corrèze is situated in the Massif Central in south-central France, within the regional nature park of Millevaches en Limousin. It borders on Vitrac-sur-Montane to the northeast, Saint-Priest-de-Gimel to the southeast, Bar to the southwest, and Meyrignac-l'Église to the northwest. A little further to the southwest, about 20 kilometers from Corrèze, lies Tulle, the prefecture of the department. The Corrèze (river) flows through the town, which is where it gets its name.
History
The first known mention of Corrèze dates from the ninth century A.D.. Later, it became a stop along the pilgrimage to Saint-Jacques-de-Compostelle, or Santiago de Compostella, and a town formed around the church. It was burnt down by the English during the Hundred Years War, but rebuilt later in the fifteenth century. The 1789 French Revolution did not have any notable effects on the town itself; the First World War, however, claimed over one hundred lives. With the onset of rural exodus and urbanization, the town has never reestablished its former population.
Population
|
|
See also
References
- "Populations légales 2017". INSEE. Retrieved 6 January 2020.
| Wikimedia Commons has media related to Corrèze (Corrèze). |
| Authority control |
|---|