Development regions of Romania
The development regions of Romania (Romanian Regiunile de dezvoltare ale României) refer to the eight regional divisions created in Romania in 1998 in order to better co-ordinate regional development as Romania progressed towards accession to the European Union. The development regions correspond to NUTS II-level divisions in European Union member states. Despite becoming increasingly significant in regional development projects, Romania's development regions do not actually have an administrative status and do not have a legislative or executive council or government. Rather, they serve a function for allocating European Union PHARE funds for regional development, as well as for collection of regional statistics. They also co-ordinate a range of regional development projects and became members of the Committee of the Regions when Romania joined the EU on January 1, 2007.
 |
|---|
| This article is part of a series on the politics and government of Romania |
List
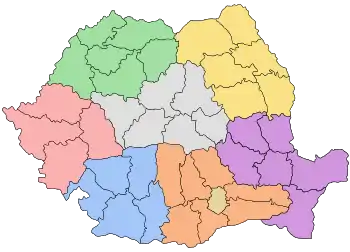
There are 8 development regions in Romania, which (with the exception of București-Ilfov) are named by their geographical position in the country:
- RO1 – Macroregiunea 1:
- RO2 – Macroregiunea 2:
- RO3 – Macroregiunea 3:
- Sud - Muntenia – RO31; 7 counties; 3,136,446 inhabitants; 34,489 km2 (13,316 sq mi)
- București - Ilfov – RO32; 1 county and Bucharest; 2,272,163 inhabitants; 1,811 km2 (699 sq mi)
- RO4 – Macroregiunea 4:
- Sud-Vest Oltenia – RO41; 5 counties; 2,075,642 inhabitants; 29,212 km2 (11,279 sq mi)
- Vest – RO42; 4 counties; 1,828,313 inhabitants; 32,028 km2 (12,366 sq mi)
Economy
| 2006 | 2016[1] | |||||||||
|---|---|---|---|---|---|---|---|---|---|---|
| Region (NUTS) |
Total (million €) [2] |
€ per capita [3] |
PPP (million €) [4] |
PPP € per capita [5] |
% of EU average GDP (PPP) [6] |
Total (million €) |
€ per capita |
PPP (million €) in 2014[7] |
PPP € per capita |
% of EU average GDP (PPP) |
| Romania | 98,419 | 4,500 | 196,999 | 9,200 | 38 | 169,771 | 8,600 | 301,801 | 17,000 | 58 |
| Nord-Vest | 11,675 | 4,200 | 23,370 | 8,700 | 36 | 19,519 | 7,600 | 34,001 | 14,300 | 51 |
| Centru | 11,335 | 4,500 | 22,689 | 9,100 | 37 | 18,761 | 8,000 | 33,349 | 15,800 | 54 |
| Nord-Est | 10,787 | 2,900 | 21,591 | 5,900 | 24 | 17,081 | 5,300 | 30,912 | 10,400 | 36 |
| Sud-Est | 11,051 | 3,800 | 22,119 | 7,900 | 32 | 18,159 | 7,400 | 34,020 | 14,600 | 52 |
| Sud - Muntenia | 12,482 | 3,800 | 24,985 | 7,700 | 31 | 20,583 | 6,800 | 36,630 | 14,200 | 46 |
| București - Ilfov | 22,946 | 9,900 | 45,931 | 21,100 | 86 | 46 994 | 20,500 | 81,267 | 40,400 | 139 |
| Sud-Vest Oltenia | 8,138 | 3,600 | 16,290 | 7,200 | 29 | 12,451 | 6,300 | 22,677 | 12,400 | 42 |
| Vest | 9,940 | 5,300 | 19,897 | 10,500 | 43 | 16 081 | 8,900 | 28,698 | 17,600 | 60 |
See also
References
- "Statistics". ec.europa.eu. Retrieved 2019-05-17.
- "Site3-TGM table". Epp.eurostat.ec.europa.eu. Retrieved 2009-07-14.
- Eurostat (19 February 2009). "GDP per inhabitant in the EU in 2006" (PDF). Europa web portal. Retrieved 28 February 2016.
- "Site3-TGM table". Epp.eurostat.ec.europa.eu. Retrieved 2009-07-14.
- "Site3-TGM table". Epp.eurostat.ec.europa.eu. Retrieved 2009-07-14.
- "Site3-TGM table". Epp.eurostat.ec.europa.eu. Retrieved 2009-07-14.
- Eurostat (26 February 2016). "GDP per capita in the EU in 2014". Europa web portal. Retrieved 28 February 2016.