Electricity sector in China
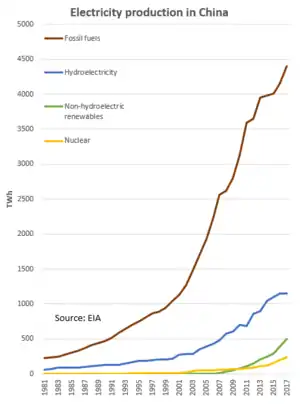
China's electric power industry is the world's largest electricity producer, passing the United States in 2011 after rapid growth since the early 1990s. In 2019, China produced more electricity than the next three countries—U.S., India, and Russia—combined.[3][4]

- Coal (incl. coal gangue): 4,858,880 GWh (64.6%)
- Natural gas: 250,544 GWh (3.3%)
- Other thermal: 26,068 GWh (0.3%)
- Nuclear: 348,700 GWh (4.6%)
- Hydro (conventional): 1,269,000 GWh (16.9%)
- Pumped storage hydro: 32,900 GWh (0.4%)
- Wind: 405,700 GWh (5.4%)
- Solar: 223,800 GWh (3.0%)
- Biomass: 103,327 GWh (1.4%)
- Coal (incl. coal gangue): 1,008,350 MW (51.3%)
- Natural gas: 83,750 MW (4.3%)
- Other thermal: 34,170 MW (1.7%)
- Nuclear: 48,740 MW (2.5%)
- Hydro (conventional): 326,410 MW (16.6%)
- Pumped storage hydro: 29,990 MW (1.5%)
- Wind: 210,050 MW (10.7%)
- Solar: 204,680 MW (10.4%)
- Biomass: 17,810 MW (0.9%)
Most of the electricity in China comes from coal, which accounted for 65% of the electricity generation mix in 2019.[2] By the end of 2019, China's installed capacity for renewable energy was about 795 GW,[5][6] while coal power capacity was 1040 GW.[7] In 2020, China added 40GW of solar power[8] and 18GW of wind power,[9][10] thus bringing the total installed renewable capacity to more than 850 GW. As of 2020, China's installed capacity for solar power was 240GW[8] and wind power was 240 GW[11][12]—the latter generated by more than 135,000 turbines.[11] Coal-fired electricity production declined from 2013 to 2016 coinciding with a major boom in renewable energy, and a decline in GDP growth.[13][14] In 2020, Chinese Communist Party general secretary Xi Jinping announced that China aims to go carbon-neutral by 2060.[15]
China has two wide area synchronous grids, the State Grid and the China Southern Power Grid. The northern power grids were synchronized in 2005.[16] Since 2011 all Chinese provinces are interconnected. The two grids are joined by HVDC back-to-back connections.[17]
China has abundant energy with the world's third-largest coal reserves and massive hydroelectric resources. There is however a geographical mismatch between the location of the coal fields in the north-east (Heilongjiang, Jilin, and Liaoning) and north (Shanxi, Shaanxi, and Henan), hydropower in the south-west (Sichuan, Yunnan, and Tibet), and the fast-growing industrial load centers of the east (Shanghai-Zhejiang) and south (Guangdong, Fujian).
History
In April 1996, an Electric Power Law was implemented, a major event in China's electric power industry. The law set out to promote the development of the electric power industry, to protect legal rights of investors, managers and consumers, and to regulate generation, distribution and consumption.
Before 1994 electricity supply was managed by electric power bureaus of the provincial governments. Now utilities are managed by corporations outside of the government administration structure.
To end the State Power Corporation's (SPC) monopoly of the power industry, China's State Council dismantled the corporation in December 2002 and set up 11 smaller companies. SPC had owned 46% of the country's electrical generation assets and 90% of the electrical supply assets. The smaller companies include two electric power grid operators, five electric power generation companies and four relevant business companies. Each of the five electric power generation companies owns less than 20% (32 GW of electricity generation capacity) of China's market share for electric power generation. Ongoing reforms aim to separate power plants from power-supply networks, privatize a significant amount of state-owned property, encourage competition, and revamp pricing mechanisms.[18]
It is expected that the municipal electric power companies will be divided into electric power generating and electric power supply companies. A policy of competition between the different generators will be implemented in the next years.
South China from the Changjiang valley down to the South China Sea was the first part of the economy to liberalize in the 1980s and 1990s and is home to much of the country's most modern and often foreign-invested manufacturing industries. Northern and north-eastern China's older industrial base has fallen behind, remains focused on the domestic economy and has suffered relative decline.
In recent history, China's power industry is characterized by fast growth and an enormous installed base. In 2014, it had the largest installed electricity generation capacity in the world with 1505 GW and generated 5583 TWh[19] China also has the largest thermal power capacity, the largest hydropower capacity, the largest wind power capacity and the largest solar capacity in the world. Despite an expected rapid increase in installed capacity scheduled in 2014 for both wind and solar, and expected increase to 60 GW in nuclear by 2020, coal will still account between 65% and 75% of capacity in 2020.[20]
In Spring 2011, according to The New York Times, shortages of electricity existed, and power outages should be anticipated. The government-regulated price of electricity had not matched rising prices for coal.[21]
Production and capacity
| Total | From coal | Coal % | |
|---|---|---|---|
| 2004 | 2,200 | 1,713 | 78% |
| 2007 | 3,279 | 2,656 | 81% |
| 2008 | 3,457 | 2,733 | 79% |
| 2009 | 3,696 | 2,913 | 79% |
| 2010 | 4,208 | 3,273 | 78% |
| 2011 | 4,715 | 3,724 | 79% |
| 2012 | 4,937 | 3,850 | 78% |
| 2013 | 5,398 | 4,200 | 78% |
| 2014 | 5,583 | 4,354 | 78% |
| 2015 | 5,666 | 4,115 | 73% |
| 2016 | 5,920 | 3,906 | 66%[23] |
| excluding Hong Kong | |||
| Generation Source | Generating Capacity GW (2014) | Electrical Production TWh (2013) |
|---|---|---|
| Coal | 907[20] | 3959[24] |
| Thermal, natural gas, biomass | 135[20] | 201 |
| Hydropower | 300[20] | 896[25] |
| Wind power | 90[26] | 140[27] |
| Solar power | 28[28] | 9[29] |
| Nuclear power | 21[30] | 124[31] |
| Total | 1505 | 5322 |
| excluding Hong Kong | ||
Sources
Coal power

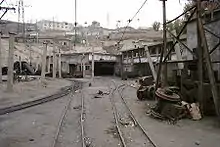

China is the largest producer and consumer of coal in the world and is the largest user of coal-derived electricity. However, coal has been falling as a percentage of the energy mix, from over 80% in 2007 to 64% in 2018. Coal electricity generation has also declined in absolute terms since 2014.
Domestic coal production has declined even further, dropping 9% year on year in 2016.[32] Further declines in production were announced in July 2016 when the commission in charge of state-owned enterprises, SASAC, ordered companies under its supervision to cut coal mining capacity by 10% in 2 years and by 15% in 5 years.[33]
Despite the cuts to coal production and falling percentage of coal in the energy mix, electricity consumption is expected to grow by 3.6-4 percent over 2016 to 2020 according to the Thirteenth Plan (2016–2020).[34] According to the same five-year plan, coal power capacity will be expanded from 960 GW to under 1,100 GW by the end of 2020 to meet some of the continued growth in electricity demand.[34] In the first two months of 2016, China added 22 GW of capacity, 14 GW of which was coal, according to the China Electricity Council.[35]
To curtail the continued rapid construction of coal fired power plants, strong action was taken in April 2016 by the National Energy Administration (NEA), which issued a directive curbing construction in many parts of the country.[35] This was followed up in January 2017 when the NEA canceled a further 103 coal power plants, eliminating 120 GW of future coal-fired capacity, despite the resistance of local authorities mindful of the need to create jobs.[36] The decreasing rate of construction is due to the realization that too many power plants had been built and some existing plants were being used far below capacity.[37]
In 2019, reports show that approvals for new coal mines had increased fivefold over approvals in 2018, and the China State Grid Corporation forecast that total coal power plant capacity would peak at 1,230-1,350 GW, an increase of about 200-300 GW.[38] The think tank Carbon Tracker estimated the average loss was about US$4/MWh and that about 60% of power stations were cashflow negative in 2018 and 2019.[39] In 2020 Carbon Tracker estimated that 43% of coal-fired plants were already more expensive than new renewables and that 94% would be by 2025.[40] According to a 2020 analysis by Energy Foundation China, in order to keep warming to 1.5 degrees C coal plants without carbon capture must be phased out by 2045.[41]
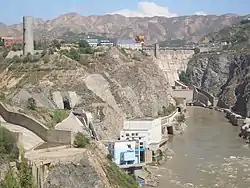
Hydropower
.jpg.webp)
Hydroelectricity is currently China's largest renewable energy source and the second overall after coal.[42] China's installed hydro capacity in 2015 was 319 GW,[43] up from 172 GW in 2009, including 23 GW of pumped storage hydroelectricity capacity.[43] In 2015, hydropower generated 1,126 TWh of power, accounting for roughly 20% of China's total electricity generation.[43]
Due to China's insufficient reserves of fossil fuels and the government's preference for energy independence, hydropower plays a big part in the energy policy of the country. China's potential hydropower capacity is estimated at up to 600 GW, but currently the technically exploitable and economically feasible capacity is around 500 GW. There is therefore considerable potential for further hydro development.[42] The country has set a 350 GW capacity target for 2020.[42]
Hydroelectric plants in China have a relatively low productivity, with an average capacity factor of 31%, a possible consequence of rushed construction[42] and the seasonal variability of rainfall. Moreover, a significant amount of energy is lost due to the need for long transmission lines to connect the remote plants to where demand is most concentrated.[42]
Although hydroelectricity represents the largest renewable and low greenhouse gas emissions energy source in the country, the social and environmental impact of dam construction in China has been large, with millions of people forced to relocate and large scale damage to the environment.[44]
Wind power
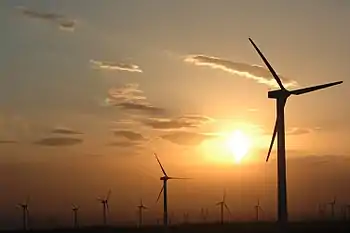
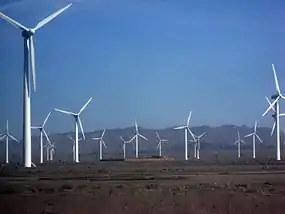
With its large land mass and long coastline, China has exceptional wind resources:[45] it is estimated China has about 2,380 GW of exploitable capacity on land and 200 GW on the sea.[46] At the end of 2014, there was 114 GW of electricity generating capacity installed in China, more than the total nameplate capacity of China's nuclear power stations,[47] (although capacity of wind power is not on par with capacity of nuclear power) and over the year 115,000 gigawatt-hours (GWh) of wind electricity had been provided to the grid.[48] In 2011, China's plan was to have 100 GW of wind power capacity by the end of 2015, with an annual wind generation of 190 terawatt-hours (TWh).[49]
China has identified wind power as a key growth component of the country's economy;[50] researchers from Harvard and Tsinghua University have found that China could meet all of their electricity demands from wind power through 2030.[51]
Nuclear power
In terms of nuclear power generation, China will advance from the moderate development strategy to accelerating development strategy. Nuclear power will play an even more important role in China's future power development. Especially in the developed coastal areas with heavy power load, nuclear power will become the backbone of the power structure there. China has planned to build up another 30 sets of nuclear power generator within 15 years with total installed capacity of 80 GW by 2020, accounting for about 4% of China's total installed capacity of the electric power industry. This percentage is expected to double every 10 years for several decades out. Plans are for 200 GW installed by 2030 which will include a large shift to Fast Breeder reactor and 1500 GW by the end of this century.
Solar power
China is the world's largest market for both photovoltaics and solar thermal energy. Since 2013 China has been the world's leading installer of solar photovoltaics. Solar PV in China is a growing industry with over 400 companies. In 2015, China became the world's largest producer of photovoltaic power, narrowly surpassing Germany.[52][53][54] By the end of 2016, total PV capacity had increased to over 77.4 GW,[55] and in 2017 China was the first country to pass 100 GW of cumulative installed PV capacity.[56] The contribution to the total electric energy production remains modest[57] as the average capacity factor of solar power plants is relatively low at 17% on average. Of the 6,412 TWh electricity produced in China in 2017,[58] 118.2 TWh was generated by solar power, equivalent to 1.84% of total electricity production.[58]
Solar water heating is also extensively implemented, with a total installed capacity of 290 GWth at the end of 2014, representing about 70% of world's total installed solar thermal capacity.[59][60] The goal for 2050 is to reach 1,300GW of Solar Capacity. If this goal is to be reached it would be the biggest contributor to Chinese electricity demand.[61]
Biomass and waste

Transmission infrastructure

The central government has made creation of a unified national grid system a top economic priority to improve the efficiency of the whole power system and reduce the risk of localised energy shortages. It will also enable the country to tap the enormous hydro potential from western China to meet booming demand from the eastern coastal provinces. China is planning for smart grid and related Advanced Metering Infrastructure.[62]
Ultra-high-voltage transmission
The main problem in China is the voltage drop when power is sent over very long distances from one region of the country to another.
Long distance inter-regional transmission have been implemented by using ultra-high voltages (UHV) of 800 kV, based on an extension of technology already in use in other parts of the world.[63]
Companies
In terms of the investment amount of China's listed power companies, the top three regions are Guangdong province, Inner Mongolia Autonomous Region and Shanghai, whose investment ratios are 15.33%, 13.84% and 10.53% respectively, followed by Sichuan and Beijing.
China's listed power companies invest mostly in thermal power, hydropower and thermoelectricity, with their investments reaching CNY216.38 billion, CNY97.73 billion and CNY48.58 billion respectively in 2007. Investment in gas exploration and coal mining follow as the next prevalent investment occurrences.
Major players in China's electric power industry include:
The five majors, and their listed subsidiaries: The five majors are all SOEs directly administered by SASAC.[64] Their listed subsidiaries are substantially independent, hence counted as IPPs, and are major power providers in their own right. Typically each of the big 5 has about 10% of national installed capacity, and their listed subsidiary an extra 4 or 5% on top of that.
- parent of Datang International Power Generation Company (SEHK: 991; SSE: 601991)
- China Guodian Corporation ("Guodian")
- parent of GD Power Development Company (SSE: 600795),
- parent of Huadian Power International Co., Ltd.
- parent of Huaneng Power International (NYSE:HNP)
- parent of China Power International Development Limited ("CPID", 2380.HK)
Additionally two other SOEs also have listed IPP subsidiaries:
- the coalmine owning Shenhua Group
- parent of China Shenhua Energy Company (SEHK: 1088, SSE: 601088)
- China Resources Group ("Huarun")
- parent of China Resources Power Holdings Company Limited ("CRP", SEHK: 836)
Secondary companies:
- Shenzhen Energy Co., Ltd.
- Guangdong Yuedian Group Co., Ltd.
- Anhui Province Energy Group Co., Ltd.
- Hebei Jiantou Energy Investment Co., Ltd.
- Guangdong Baolihua New Energy Stock Co., Ltd.
- Shandong Luneng Taishan Cable Co., Ltd.
- Guangzhou Development Industry (Holdings) Co., Ltd.
- Chongqing Jiulong Electric Power Co., Ltd.
- Chongqing Fuling Electric Power Industrial Co., Ltd.
- Shenergy Company (SSE: 600642), Shanghai.
- Shenergy Group, Shanghai.
- Sichuan Chuantou Energy Stock Co., Ltd.
- Naitou Securities Co., Ltd.
- Panjiang Coal and Electric Power Group
- Hunan Huayin Electric Power Co., Ltd.
- Shanxi Top Energy Co., Ltd.
- Inner Mongolia Mengdian Huaneng Thermal Power Co., Ltd.
- SDIC Huajing Power Holdings Co., Ltd.[65][66]
- Sichuan MinJiang Hydropower Co., Ltd.
- Yunnan Wenshan Electric Power Co., Ltd.
- Guangxi Guidong Electric Power Co., Ltd.
- Sichuan Xichang Electric Power Co., Ltd.
- Sichuan Mingxing Electric Power Co., Ltd.
- Sichuan Guangan Aaa Public Co., Ltd.
- Sichuan Leshan Electric Power Co., Ltd.
- Fujian MingDong Electric Power Co., Ltd.
- Guizhou Qianyuan Power Co., Ltd.
Nuclear and hydro:
- China Three Gorges Corporation
- China Guangdong Nuclear Power Group
- China Yangtze Power (listed)
- Sinohydro Corporation an engineering company.
- Guangdong Meiyan Hydropower Co., Ltd.
Grid operators include:
- State Grid Corporation of China
- China Southern Power Grid
- Wenzhou CHINT Group Corporation ("Zhengtai")
Territorial differences
China consists of three largely self-governing territories: the mainland, Hong Kong, and Macau. The introduction of electricity to the country was not coordinated between the territories, leading to partially different electrical standards. Mainland China uses type A and I power plugs with 220 V and 50 Hz; Hong Kong and Macau both use type G power plugs with 220 V and 50 Hz. Inter-territorial travelers may therefore require a power adapter.
References
- The Current situation of China's Electric Power Industry (2000)
- Electricity Sector Development Strategy in China (April 2004)
- China's Electric Power Industry and its Trends (April 2006)
- Reform in China’s Electric Power Industry – A Case Study of East China’s Wholesale Electric Power Market (May 2006)
- Electric Power Industry in China (February 2007)
Footnotes
- "2019 electricity & other energy statistics (preliminary); Original Title: 2019年电力统计年快报基本数据一览表". National Energy Administration, translation via chinaenergyportal.org. January 21, 2020. Retrieved 17 October 2020.
- "Electricity generation by source, People's Republic of China 1990-2019". IEA. Retrieved 17 October 2020.
- "Electricity Production Data | World Electricity Statistics | Enerdata". yearbook.enerdata.net. Retrieved 2021-01-05.
- "BP Statistical Review of World Energy 2020 | 69th edition" (PDF).
- "Renewables 2020 Data Explorer – Analysis". IEA. Retrieved 2021-01-05.
- REN21. "RENEWABLES 2020 GLOBAL STATUS REPORT". www.ren21.net. Retrieved 2021-01-05.
- Reuters Staff (2020-06-18). "CORRECTED-China to cap 2020 coal-fired power capacity at 1,100 GW". Reuters. Retrieved 2021-01-05.
- Reuters Staff (2020-12-10). "China solar capacity growth hits 40 GW in 2020 - official". Reuters. Retrieved 2021-01-05.
- "China leads world in new wind power capacity - Xinhua | English.news.cn". www.xinhuanet.com. Retrieved 2021-01-05.
- "Wind – Renewables 2020 – Analysis". IEA. Retrieved 2021-01-05.
- Christian, Alex (2020-09-11). "China is rapidly building a world-beating wind energy revolution". Wired UK. ISSN 1357-0978. Retrieved 2021-01-05.
- Reuters Staff (2020-06-18). "CORRECTED-China to cap 2020 coal-fired power capacity at 1,100 GW". Reuters. Retrieved 2021-01-05.
- "China Nov coal output down 2.7 pct at 320 mln T – stats bureau". Reuters. December 12, 2015.
- Puko, Timothy; Yap, Chuin-Wei (27 February 2015). "Falling Chinese Coal Consumption and Output Undermine Global Market". Wsj.com. Retrieved 24 August 2017.
- "China Solar Stocks Are Surging After Xi's 2060 Carbon Pledge". Bloomberg.com. 2020-10-08. Retrieved 2021-01-05.
- Wu, Wei; He, Zhao; Guo, Qiang (June 2005). "China power grid and its future development". IEEE Power Engineering Society General Meeting, 2005. pp. 1533–1535. doi:10.1109/pes.2005.1489157. ISBN 0-7803-9157-8. S2CID 30004029.
- Zhenya, Liu (2015-08-28). Global energy interconnection. p. 45. ISBN 9780128044063.
After the completion and commissioning of Tibet’s ±400 kV DC interconnected power grid in December 2011, China has achieved nationwide interconnections covering all its territories other than Taiwan.
- "Archived copy". Archived from the original on 2010-06-20. Retrieved 2014-10-10.CS1 maint: archived copy as title (link)
- "The World Factbook". cia.gov. Retrieved 1 February 2016.
- "China and Electricity Overview – The Energy Collective". Theenergycollective.com. Retrieved 1 February 2016.
- Bradsher, Keith (May 24, 2011). "China's Utilities Cut Energy Production, Defying Beijing". The New York Times. Retrieved May 25, 2011.
Balking at the high price of coal that fuels much of China’s electricity grid, the nation’s state-owned utility companies are defying government economic planners by deliberately reducing the amount of electricity they produce.
- IEA Key World Energy Statistics 2015, 2012, 2011, 2010, 2009 Archived 2013-10-07 at the Wayback Machine, 2006 Archived 2009-10-12 at the Wayback Machine IEA coal production p. 15, electricity p. 25 and 27
- "China's renewable energy revolution continues on its long march". Energypost.eu. Retrieved 1 February 2017.
- "Coal is losing its market share in China's electricity generation – Market Realist". marketrealist.com. Retrieved 1 February 2016.
- "China – International Hydropower Association". Hydropower.org. Retrieved 2017-08-24.
- "China's wind power capacity to hit 120 gigawatts by 2015". The Economic Times. Retrieved 1 February 2016.
- "Wind power helps clean China's air". xinhuanet.com. Retrieved 1 February 2016.
- Katie Fehrenbacher (18 June 2015). "China is utterly and totally dominating solar panels". Fortune. Retrieved 1 February 2016.
- "China's Renewable Energy Revolution Has Global Implications". CleanTechnica. Retrieved 1 February 2016.
- Brian Wang. "Next Big Future: China looks to buy 8 more AP1000 nuclear reactors and is accelerating nuclear reactor approvals". Nextbigfuture.com. Retrieved 1 February 2016.
- "China Nuclear Power – Chinese Nuclear Energy". world-nuclear.org. Retrieved 1 February 2016.
- "IEEFA Update: China Is Now Three Years Past Peak Coal". ieefa.org/ieefa-update-china-now-three-years-past-peak-coal/. February 28, 2017.
- "China to cut coal mining capacity of SASAC-owned companies by 10% in 2 years". Platts. July 11, 2016.
- "China to cap coal at 55 percent of total power output by 2020: NEA". Reuters. November 7, 2016.
- Feng, Hao (April 7, 2016). "China Puts an Emergency Stop on Coal Power Construction". The Diplomat.
- "China Cancels 103 Coal Plants, Mindful of Smog and Wasted Capacity". New York Times. January 18, 2017.
- "Asian coal boom: climate threat or mirage?". Energy and Climate Intelligence Unit. Mar 22, 2016. Archived from the original on April 24, 2016. Retrieved February 14, 2018.
- "China coal mine approvals surge despite climate pledges".
- Gray, Matt; Sundaresan, Sriya (April 2020). Political decisions, economic realities: The underlying operating cashflows of coal power during COVID-19 (Report). Carbon Tracker. p. 19.
- How to Retire Early: Making accelerated coal phaseout feasible and just (Report). Carbon Tracker. June 2020.
- China’s New Growth Pathway: From the 14th Five-Year Plan to Carbon Neutrality (PDF) (Report). Energy Foundation China. December 2020. p. 24.
- Walker, Qin (29 July 2015). "The Hidden Costs of China's Shift to Hydropower". The Diplomat. Retrieved 1 November 2016.
- "China | International Hydropower Association". www.hydropower.org. Retrieved 1 November 2016.
- Hvistendahl, Mara. "China's Three Gorges Dam: An Environmental Catastrophe?". Scientific American. Retrieved 1 November 2016.
- Oceans of Opportunity: Harnessing Europe’s largest domestic energy resource pp. 18–19. Ewea.org
- Wind provides 1.5% of China's electricity Wind Power Monthly, 5 December 2011
- "GLOBAL WIND STATISTICS 2014" (PDF). Gwec.net. Retrieved 2017-08-24.
- "China was world's largest wind market in 2012". Renewable Energy World. 4 February 2013. Archived from the original on 5 November 2013. Retrieved 5 November 2013.
- "China revises up 2015 renewable energy goals: report". Reuters. August 29, 2011. Retrieved 2017-08-24.
- Gow, David (2009-02-03). "Wind power becomes Europe's fastest growing energy source". The Guardian. London. Retrieved 2010-01-31.
- "China Could Replace Coal with Wind". Ecogeek.org. Archived from the original on 2009-10-15. Retrieved 2010-01-31.
- https://www.reuters.com/article/china-solar-idUSL3N15533U
- http://cleantechnica.com/2016/01/22/china-overtakes-germany-become-worlds-leading-solar-pv-country/
- http://cleantechnica.com/2016/07/07/china-installs-18-6-gw-solar-pv-2015-connected/
- "China's solar power capacity more than doubles in 2016". Reuters.com. Retrieved 2017-03-22.
- "China Is Adding Solar Power at a Record Pace". Bloomberg.com. 19 July 2017. Retrieved 1 August 2017.
- http://www.ren21.net/wp-content/uploads/2016/06/GSR_2016_Full_Report.pdf
- "2017 electricity & other energy statistics - China Energy Portal - 中国能源门户". 6 February 2018.
- China's Big Push for Renewable Energy
- "Solar Heat Worldwide 2014" (PDF). www.iea-shc.org. IEA Solar Heating & Cooling Programme. Retrieved 13 June 2016.
- Yang, X. Jin; Hu, Hanjun; Tan, Tianwei; Li, Jinying (2016). "China's renewable energy goals by 2050". Environmental Development. 20: 83–90. doi:10.1016/j.envdev.2016.10.001.
- "China Wants Smart Grid, But Not Too Smart". WSJ. Retrieved 1 February 2016.
- Paul Hu: A New Energy Network: HVDC Development in China, September 2016
- "中央企业_国务院国有资产监督管理委员会". Sasac.gov.cn. Retrieved 1 February 2016.
- "SDIC Power Homepage". Sdicpower.com. Retrieved 2017-08-24.
- "SDIC Power Holdings Co Ltd: SHA:600886 quotes & news – Google Finance". Google.com. Retrieved 1 February 2016.
Further reading
- Han, Wenke; Jiang, Kejun; Fan, Lijun. Reform of China's electric power industry: facing the market and competition International Journal of Global Energy Issues, Volume 23, Numbers 2–3, 20 April 2005, pp. 188–195(8)
- Li, Jerry (2009), From Strong to Smart: the Chinese Smart Grid and its relation with the Globe, AEPN, Article No. 0018602, Asia Energy Platform
- Prof. Xifan Wang, Dr. Loi Lei Lai. "Electric Power Industry Restructuring in China" (Power System Restructuring and Deregulation) DOI 10.1002/0470846119.ch7
- Consideration on energy, environmental problems in electric power industry of China. Proceedings of the Conference on Energy, Economy, and Environment. VOL.16th;NO.;PAGE.235-240(2000)
- China's Electric Power Options: An Analysis of Economic and Environmental Costs (June 1998)
- Xu Yi-chong. "Powering China: Reforming the Electric Power Industry in China." Dartmouth. ISBN 0-7546-2251-7
- Electric Power System in China; History of Development, Present status & Future perspective (2007)
- Prof. Liang Xidong, Tsinghua University, "China’s Rapidly Growing Power Industry"
- Yearbook
External links
- China Electric Power Research Institute – associated with the State Grid Corporation of China
- Office of the National Energy Leading Group
- China Electrotechnical Society
- Energy Research Institute of China
- China Electric Power Database
- China's oversupply of electric power worrisome 2 January 2006 Zhang Mingquan – HK Trade Council
- China Electric Power Industry Forum
- China EPower Forum
| Topics | |
|---|---|
| Agencies | |
| Sources |
|
| Electricity generation and transmission | |
| State-owned energy companies |
|
| |
| Onshore wind farms |
| |
|---|---|---|
| Offshore wind farms |
| |
| Wind power companies | ||
| ||
Electricity sector in Asia | |
|---|---|
| Sovereign states |
|
| States with limited recognition |
|
| Dependencies and other territories | |
| |
| Africa | |||||
|---|---|---|---|---|---|
| Asia | |||||
| Europe |
| ||||
| North America | |||||
| Oceania | |||||
| South America | |||||
| |||||