Solar power in China
China is the world's largest market for both photovoltaics and solar thermal energy. Since 2013 China has been the world's leading installer of solar photovoltaics (PV). In 2015, China became the world's largest producer of photovoltaic power, narrowly surpassing Germany.[1][2][3] In 2017 China was the first country to pass 100 GW of cumulative installed PV capacity,[4][5] and by the end of 2020, it had 240 GW of cumulative installed solar capacity.[6][7] As of May 2018, China held the record for largest operational solar project in its 1,547-MW project at Tengger.[8] In late 2020, China turned on its largest solar farm with a capacity of 2.2 GW in Qinghai province.[9][10] The contribution to the total electric energy production remains modest[11] as the average capacity factor of solar power plants is relatively low at 17% on average. Of the 6,412 TWh electricity produced in China in 2017,[12] 118.2 TWh was generated by solar power, equivalent to 1.84% of total electricity production.[12] In 2019, China generated 234 TWh of electricity from solar power.[13] At the 2020 Climate Ambition Summit, China announced that its goal is to reach 1,200 GW of combined solar and wind capacity by 2030.[14]
Solar water heating is also extensively implemented, with a total installed capacity of 290 GWth at the end of 2014, representing about 70% of world's total installed solar thermal capacity.[15][16]
History
According to plans unveiled by the National Development and Reform Commission in 2007, China's installed solar capacity was to grow to 1,800 MW by 2020.[17] However already in 2009, Wang Zhongying, a Commission official, mentioned at a solar energy conference in Shanghai that the plan might be exceeded several-fold, with the installed capacity possibly reaching as much as 10 GW by 2020.[17]
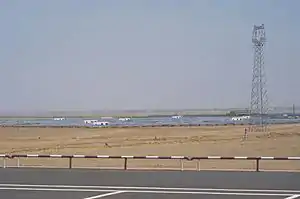
In 2010 a new feed-in tariff was introduced. Projects completed before 30 September 2012 received 1.15 yuan ($0.18) per kWh.[18] Since then, solar power deployment vastly exceeded initial government plans. The 200 MW Huanghe Hydropower Golmud Solar Park was completed in 2011, the world's largest solar farm at the time. There were many other solar farms in Golmud, totaling 570 MW at the end of 2011, with another 500 MW expected in 2012. The Qinghai province, which contains Golmud, was leading China in solar installations.[19]
The Chinese PV production system faced severe external shocks since 2010. A sharp recession in the global demand due to institutional alterations in the German market in 2010, followed by anti-dumping duties and anti-subsidy countervailing duties on Chinese PV products enforced in both USA and EU.[5] Chinese PV manufacturers, which were already running at full capacity, faced a difficult situation in 2011 and 2012 with huge financial losses that led to the bankruptcy of some important companies, such as SunTech Power in 2013 which defaulted on $541 million of convertible bonds.[5] To rescue the huge PV industry with its large labor market and assets, a comprehensive set of policies was introduced by the Chinese government mainly to stimulate the domestic market. Accordingly, the annual installed capacity in China experienced notable growth since 2011. This growth was mainly due to the construction of several PV power plants around the country.
In May 2011, the National People's Congress (NPC) revised the solar target again, setting 5 GW as an official minimum PV target for 2015, with a longer-term target of 20–30 GW by 2020.[20] According to a 2012 forecast by the European Photovoltaic Industry Association, the total installed capacity was predicted to reach between 47 GW and 66 GW by 2017.[21]:p. 35
In May 2014, the National Development and Reform Commission announced that the solar capacity target had been increased, to 70 GW by 2017.[22] In October 2014 China planned to install 100 GW of solar power—along with 200 GW of wind, 350 GW of hydro and 58 GW of nuclear power by 2020.[23] Market research firm NPD Group forecast that China would have over 100 GW of PV capacity by 2018.[24] In October 2015, China's National Energy Administration (NEA) set an ambitious 23.1 GW target for 2015, upgrading its previous target of 17.8 GW from March 2015, which was already more than the global PV capacity installed in 2010.[25] At that time, China planned to install 150 GW of solar power by 2020,[26] an increase of 50 GW compared to the 2020-target announced in October 2014.[23]
The goal set by the Chinese authorities of 105 GW solar capacity for the year 2020 was passed in July 2017. China installed 43 GW of solar power in the first nine months of 2017, already above the 34.5 GW target for the whole year. This caused the Chinese Government to more than double the original target to 213 GW for 2020.[27] CCB International Securities Ltd. raised its forecast for China's solar power capacity to 55 gigawatts from 40 gigawatts for 2018.[28] Of the 7482 TWh of electricity produced in 2019,[29] China's solar power generated 234 TWh or 3.1%,[13] which is higher compared to the corresponding share of 1.2% in the United States.[30]
Solar resources

A July 2019 report found that local air pollution (black carbon and sulfur dioxide) has decreased the available solar energy that can be harnessed today by up to 15% compared to the 1960s.[32]
Solar photovoltaics
| Year | Capacity (MW) | Installed/yr |
|---|---|---|
| 1999 | 16 | |
| 2000 | 19 | 3 |
| 2001 | 23.5 | 4.5 |
| 2002 | 42 | 8.5 |
| 2003 | 52 | 10 |
| 2004 | 62 | 10 |
| 2005 | 70 | 8 |
| 2006 | 80 | 10 |
| 2007 | 100 | 20 |
| 2008 | 140 | 40 |
| 2009 | 300 | 160 |
| 2010 | 800 | 500 |
| 2011 | 3,300 | 2,500 |
| 2012 | 4,198 | 898 |
| 2013 | 16,137 | 12,119 |
| 2014 | 28,050 | 11,733 |
| 2015 | 43,180 | 15,130 |
| 2016 | 77,420 | 34,240 |
| 2017 | 130,200 | 52,780 |
| 2018 | 174,460 | 44,260 |
| 2019 | 204,680 | 30,220 |
| Sources: IEA for years up to and incl 2011;[33][34] China National Energy Administration for data from 2012 onwards[35][36][37][38][39][40][41] | ||
Solar PV by province
A large part of the solar power capacity installed in China is in the form of large PV power plants in the west of the country, an area much less populated than the eastern part but with better solar resources and available land.
| Province | MW end of 2015 | MW end of 2016 | MW end of 2017 | MW end of 2018 |
|---|---|---|---|---|
| China total | 43,170 | 77,420 | 130,200 | 174,460 |
| Xinjiang | 4,060 | 8,620 | 9,470 | 9,920 |
| Gansu | 6,100 | 6,860 | 7,840 | 8,280 |
| Qinghai | 5,640 | 6,820 | 7,910 | 9,560 |
| Inner Mongolia | 4,880 | 6,370 | 7,430 | 9,450 |
| Jiangsu | 4,220 | 5,460 | 9,070 | 13,320 |
| Ningxia | 3,080 | 5,260 | 6,200 | 8,160 |
| Shandong | 1,330 | 4,450 | 10,520 | 13,610 |
| Hebei | 2,390 | 4,430 | 8,680 | 12,340 |
| Anhui | 1,210 | 3,450 | 8,880 | 11,180 |
| Zhejiang | 1,640 | 3,380 | 8,410 | 11,380 |
| Shaanxi | 1,170 | 3,340 | 5,240 | 7,160 |
| Shanxi | 1,140 | 2,970 | 5,910 | 8,460 |
| Henan | 410 | 2,840 | 7,030 | 9,910 |
| Jiangxi | 440 | 2,280 | 4,500 | 5,360 |
| Yunnan | 640 | 2,080 | 2,330 | 3,430 |
| Hubei | 480 | 1,870 | 4,140 | 5,100 |
| Guangdong | 640 | 1,560 | 3,310 | 5,270 |
| Sichuan | 370 | 960 | 1,340 | 1,810 |
| Tianjin | 120 | 600 | 680 | 1,280 |
| Jilin | 60 | 560 | 1,590 | 2,650 |
| Liaoning | 170 | 520 | 2,230 | 3,020 |
| Guizhou | 30 | 460 | 1,370 | 1,780 |
| Shanghai | 200 | 350 | 580 | 890 |
| Hainan | 240 | 340 | 320 | 1,360 |
| Tibet Autonomous Region | 170 | 330 | 790 | 980 |
| Hunan | 290 | 300 | 1,760 | 2,920 |
| Fujian | 150 | 270 | 920 | 1,480 |
| Beijing | 160 | 240 | 250 | 400 |
| Guangxi | 120 | 180 | 690 | 1,240 |
| Heilongjiang | 20 | 170 | 940 | 2,150 |
| Chongqing | 5 | 5 | 130 | 430 |
Solar PV by type
| Sector | Annual MW | Cumulative MW |
|---|---|---|
| Power Plant | 23,300 | 123,730 |
| Distributed | 20,960 | 51,250 |
| Off-grid | 360 | |
| Total | 44,260 | 175,340 |
In 2018 23,300 MW of utility scale power plant installations were added bring the cumulative total in this sector to 123,730 MW of power. Distributed installations rose by almost as much during 2018 at 20,960 MW bringing the cumulative total in the sector to 51,250 MW by year end 2018. Off-grid solar was the smallest component in 2018 with just 360 MW cumulatively installed.
Manufacturers
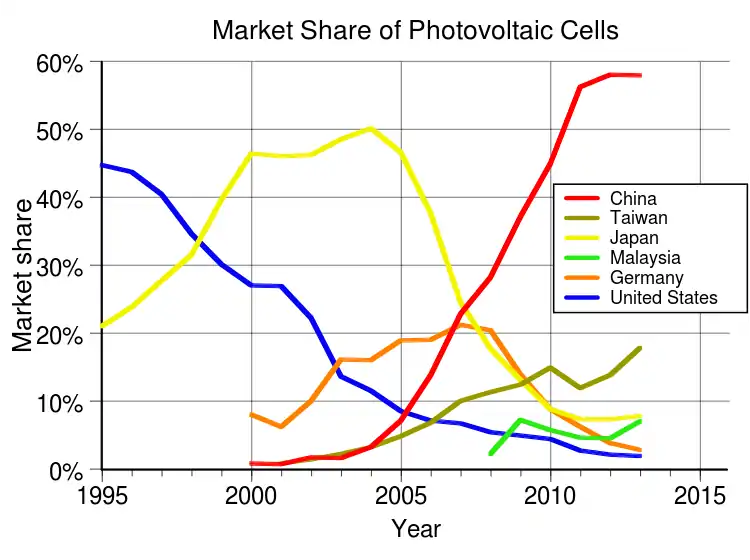
China has been the world's largest manufacturer of solar panels since 2008 and, since 2011, has produced the majority of global photovoltaics on an annualized basis.[46] Industry projections estimated that, by the end of 2017, China would have enough manufacturing capacity to produce 51 GW of PV modules per year, an amount over twice as large as 2010's global production of 24 GW.[47][48]
The industry is dominated by several major manufacturers. They include CHINT Group Corporation, JA Solar Holdings, Jinniu Energy, Suntech Power, Yingli, China Sunergy and Hanwha SolarOne.[49][50] Large debt challenges several manufacturers.[51]
Concentrated solar power
China has large potential for concentrated solar power (CSP), especially in the south-western part of the country.[52] The highest daily mean values of direct normal radiation are found in the Qinghai-Tibet Plateau and Sichuan Basin, at 9 kWh/m2. Most of northern and western China has daily average direct normal radiation over 5 kWh/m2, considered the limit for economical use of CSP.[52] Practical limitations for deployment of CSP include mountainous terrain and distance from energy load centers, mostly concentrated in the east.[52]
The 12th five-year plan, for 2011 to 2015, called for the installation of 1,000 MW by 2015, and 3,000 MW of CSP plants by 2020.[53] However, at the end of 2014, only 14 MW of CSP was operational in the country.[52]
Plants planned or under construction:[53]
- 1 MW Badaling Pilot Project — collaboration between the Institute of Electrical Engineering (IEE) and the Chinese Academy of Sciences (CAS)
- 12 MW (short term) / 300-MW (long term) project — collaboration between Xinjiang Qingsong Building Materials and Chemicals (Group) Co. and Guodian Xinjiang Company
- 50 MW project in Tibet by Huaneng Tibet Company
- 100 MW project in Sichuan Abazhou by Tianwei New Energy (Aba)
- 50 MW (TBD) by China Huadian Corporation
- 100 MW project in Golmud by GD ENERGY
- 100 MW project in Ningxia by Beijing Control Technology Co. Ltd
- 100 MW project (TBD) by Avic Xi’an Aero-Engine (Group) Ltd
- 100 MW project (TBD) by Guangdong Kangda
- 100 MW in Gansu by SETC Tianjin
- 1,000 MW in Qinghai by Lion International Investment Ltd.
- 2,000 MW in Shaanxi by Shandong Penglai Dianli and eSolar
Solar water heating
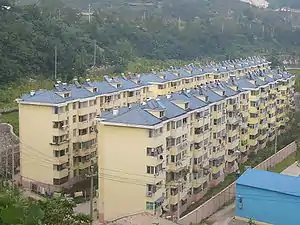
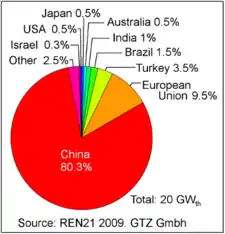
China is the leading country for solar water heating capacity in the world, with 290 GWth in operation at the end of 2014, accounting for about 70% of the total world capacity. In terms of capacity per unit of population, China comes 7th in the world with 213 kWth per 1,000 people. Most of the installed capacity (92%) was evacuated tube water heaters.[16]
Controversy
China is a large producer of polysilicon, for use in first generation solar cells around the world. A byproduct of the process is poisonous silicon tetrachloride, which is normally processed and recycled at a higher cost in the developed world, but often dumped by Chinese green startups,[54] With proper recycling the polysilicon would cost $84,500 per tonne, but the Chinese companies are making it at $21,000 to $56,000 a ton.[54]
Zhejiang Jinko Solar Co., Ltd., founded in 2006 as a subsidiary of Hong Kong-invested JinkoSolar Holding Co, Ltd (NYSE Stock Code: JKS), produces solar panel photovoltaic cells and wafers. It employs more than 10,000 professionals in two factories in east China and has offshore offices and warehouse in the United States and Europe, according to the company website (www.jinkosolar.com). On Thursday, 15 September 2011, more than 500 people from Hongxiao Village protested over the large-scale death of fish in a nearby river. Angry protesters stormed the factory compound, overturned eight company vehicles, and destroyed the offices before police came to disperse the crowd. Protests continued on the two following nights with reports of scuffle, officials said. Chen Hongming, a deputy head of Haining's environmental protection bureau, said the factory's waste disposal had failed the pollution tests since April. The environmental watchdog has warned the factory but it had not effectively controlled the pollution, Chen added.[55]
The Chinese government subsidies for solar energy (PV) have been described as "unsustainable" (although reduced in 2017)[56] and are sometimes paid late to generating companies. Much of the solar power generating capacity has been built in the relatively less populated west of China whereas the major electricity consumption areas (such as Shanghai and Beijing) are in the east causing difficulties and expense in transferring the energy between regions with curtailment rates of 30% or more reported in 2017.[56]
See also
References
- Rose, Adam. "China's solar capacity overtakes Germany in 2015, industry data show".
- "China Overtakes Germany To Become World's Leading Solar PV Country". cleantechnica.com.
- "China Installed 18.6 GW Of Solar PV In 2015, But Was All Of It Connected? - CleanTechnica". cleantechnica.com.
- "China Is Adding Solar Power at a Record Pace". Bloomberg.com. 19 July 2017. Retrieved 1 August 2017.
- Shubbak, Mahmood H. (May 2019). "The technological system of production and innovation: The case of photovoltaic technology in China". Research Policy. 48 (4): 993–1015. doi:10.1016/j.respol.2018.10.003.
- Reuters Staff (10 December 2020). "China solar capacity growth hits 40 GW in 2020 - official". Reuters. Retrieved 5 January 2021.
- "China Installs 44.3 Gigawatts Of Solar In 2018". CleanTechnica. 23 January 2019. Retrieved 18 February 2019.
- "IEEFA Report: Advances in Solar Energy Accelerate Global Shift in Electricity Generation - Institute for Energy Economics & Financial Analysis". Institute for Energy Economics & Financial Analysis. 21 May 2018. Retrieved 22 May 2018.
- Ramirez, Vanessa Bates (9 October 2020). "A Ridiculously Huge New Solar Farm Just Came Online in China". Singularity Hub. Retrieved 5 January 2021.
- Boom, Daniel Van. "China's biggest-ever solar power plant goes live". CNET. Retrieved 5 January 2021.
- "Report" (PDF). www.ren21.net. 2016.
- "2017 electricity & other energy statistics - China Energy Portal - 中国能源门户". 6 February 2018.
- "China: solar power generation 2019". Statista. Retrieved 5 January 2021.
- "China's new 2030 climate commitments: Beyond peak emissions". IHS Markit. 15 December 2020. Retrieved 5 January 2021.
- "China's Big Push for Renewable Energy".
- "Solar Heat Worldwide 2014" (PDF). www.iea-shc.org. IEA Solar Heating & Cooling Programme. Retrieved 13 June 2016.
- "China solar set to be 5 times 2020 target". Reuters. 5 May 2009.
- "Sun shines on development of power sector-Industries-chinadaily.com.cn". usa.chinadaily.com.cn.
- "China Daily USA". www.chinadaily.com.cn.
- "Global Market Outlook for Photovoltaics until 2015". European Photovoltaic Industry Association (EPIA). May 2011. p. 39. Archived from the original on 31 July 2010. Retrieved 10 March 2012.
- "Publications - European Photovoltaic Industry Association". 3 December 2012. Archived from the original on 3 December 2012.
- "China Targets 70 Gigawatts of Solar Power to Cut Coal Reliance". Bloomberg News. 16 May 2014. Retrieved 16 May 2014.
- "China Plans to Install 200GW of Wind and 100GW of Solar Power by 2020". EnergyTrend.com. 14 October 2014. Archived from the original on 17 October 2014.CS1 maint: unfit URL (link)
- Michael Barker (29 August 2014). "China on Track to Have Over 100 GW of PV Capacity Installed in 2018". NPD SolarBuzz. Retrieved 8 September 2014.
- Militsa Mancheva (9 October 2015). "China again lifts 2015 solar target, now aims at 23.1 GW". Seenew Renewables.
- "China's PV power capacity to hit 150 gigawatts by 2020". Xinhuanet.com. 13 October 2015.
- "China has already surpassed its 2020 solar target". 24 August 2017.
- "China on Pace for Record Solar-Power Installations". Bloomberg.com. 20 November 2017. Retrieved 24 December 2017.
- "Electricity Production Data | World Electricity Statistics | Enerdata". yearbook.enerdata.net. Retrieved 5 January 2021.
- "Electricity generation, capacity, and sales in the United States - U.S. Energy Information Administration (EIA)". www.eia.gov. Retrieved 5 January 2021.
- "Global Solar Atlas". Retrieved 7 December 2018.
- Brown, Mike. "China's Pollution-Hampered Solar Panels Reveal a Big Issue". Inverse. Retrieved 6 August 2019.
- "National Survey Report of PV Power Applications in China 2011".
- "Snapshot of Global PV 1992-2014" (PDF). International Energy Agency — Photovoltaic Power Systems Programme. 30 March 2015. Archived from the original on 30 March 2015.
- "2012 & 2013 distributed and utility PV installations by province (Original title:2013年光伏发电统计数据)". 28 April 2014. Retrieved 8 February 2020.
- "2014 distributed and utility PV installations by province (Original title:2014年光伏发电统计数据)". 9 March 2015. Retrieved 8 February 2020.
- "2015 distributed and utility PV installations by province (Original title:2015年光伏发电统计数据)". 5 February 2016. Retrieved 8 February 2020.
- "2016 distributed and utility PV installations by province (Original title:2016年光伏发电统计数据)". 4 February 2017. Retrieved 8 February 2020.
- "2017 distributed and utility P installations by province (Original title:2017年光伏发电统计数据)". 19 March 2018. Retrieved 8 February 2020.
- "2018 distributed and utility PV installations by province (Original title:2018年光伏发电统计数据)". 19 March 2019. Retrieved 8 February 2020.
- "2019 electricity & other energy statistics (preliminary) (Original title: 2019年电力统计年快报基本数据一览表)". Retrieved 24 January 2018.
- "能源局:2016年光伏发电累计装机容量7742万千瓦 - 中国能源网". www.cnenergy.org.
- "2018 Q1&2 PV installations utility and distributed by province; Original Title: 2018年上半年光伏建设运行情况". National Energy Administration, translation via chinaenergyportal.org. 3 August 2018. Retrieved 3 March 2019.
- "2018 PV installations utility and distributed by province; Original Title: 2018年年光伏建设运行情况". National Energy Administration, translation via chinaenergyportal.org. 19 March 2019. Retrieved 22 March 2019.
- "IEA-PVPS Annual Report 2018, 2019/07/15".
- "Annual Solar Photovoltaics Production by Country, 1995-2012". Earth Policy Institute. 31 July 2013. Retrieved 8 August 2014.
- "Annual Solar Photovoltaics Module Production in China, 2007-2013, with Projection to 2017". Earth Policy Institute. 8 July 2014. Retrieved 8 August 2014.
- "World Solar Photovoltaics Production, 1975-2012". Earth Policy Institute. 31 July 2013. Retrieved 8 August 2014.
- GCL-Poly Energy Holdings Limited Archived 18 January 2011 at the Wayback Machine
- "Solar Energy Booming in China".
- Huang, Nuying (23 December 2016). "60% of China PV makers may be forced out in 2017, say reports". DigiTimes. Retrieved 24 December 2016.
domestic demand is not large enough to absorb the output
- Wang, Jun; Yang, Song; Jiang, Chuan; Zhang, Yaoming; Lund, Peter D. (April 2017). "Status and future strategies for Concentrating Solar Power in China". Energy Science & Engineering. 5 (2): 100–109. doi:10.1002/ese3.154.
- "China to Have 3 GW of Concentrated Solar Thermal Power (CSP) by 2020 - CleanTechnica". cleantechnica.com. 30 March 2012.
- Washington Post. Solar Energy Firms Leave Waste Behind in China. 9 March 2008.
- "Protest over factory pollution in E China enters third day". China Daily. Xinhua. 18 September 2011. Retrieved 19 September 2011.
Hangzhou - Hundreds of villagers in East China's Zhejiang Province protested for the third day on Saturday at a solar panel manufacturer, whose parent is a New York-listed firm, over concerns of its harmful wastes.
- Baraniuk, Chris (22 June 2017). "Future Energy: China leads world in solar power production". BBC News. Retrieved 27 June 2017.
External links
| Wikimedia Commons has media related to Solar power in China. |
- Chinese Renewable Energy Industries Association
- Yingli Green Energy
- China Solar PV Report (Greenpeace China) (2007)
- Kyocera Constructing New Solar Manufacturing Plant In China
- Solar Power Resources and News in the Asia-Pacific region, with focus page on China
| Topics | |
|---|---|
| Agencies | |
| Sources |
|
| Electricity generation and transmission | |
| State-owned energy companies |
|
| |
| Africa | |||||
|---|---|---|---|---|---|
| Asia | |||||
| Europe |
| ||||
| North America | |||||
| Oceania | |||||
| South America | |||||
| |||||