Generation Z
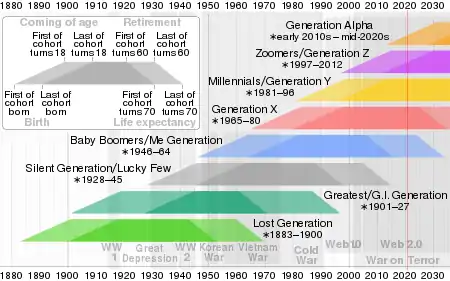
Generation Z (or simply Gen Z), colloquially known as Zoomers,[1][2] is the demographic cohort succeeding Millennials and preceding Generation Alpha. Researchers and popular media use the mid-to-late 1990s as starting birth years and the early 2010s as ending birth years. Most members of Generation Z are the children of Generation X,[3] but some are children of millennials.[4]
| Part of a series on |
| Major generations of the Western world |
|---|
 |
As the first social generation to not have experienced life before the advent of the Internet and to have widespread access to portable digital technology at a young age, members of Generation Z have been dubbed "digital natives,"[5][6] even though they are not necessarily digitally literate.[7] Moreover, the negative effects of screen time are most pronounced on adolescents compared to younger children.[8] Compared to previous generations, members of Generation Z in some developed nations tend to be well-behaved, abstemious, and risk-averse.[9] They tend to live more slowly than their predecessors when they were their age,[10][11] have lower rates of teenage pregnancies, and consume alcohol less often,[12][13] but not necessarily addictive drugs.[14][15] Teenagers nowadays seem more concerned with academic performance and job prospects,[9][10] and are better at delaying gratification than their counterparts from the 1960s, despite concerns to the contrary.[16] On the other hand, sexting among adolescents has grown in prevalence though the consequences of this remain poorly understood.[17] Meanwhile, youth subcultures have been quieter, though not necessarily dead.[18][19]
Globally, there is evidence that the average age of pubertal onset among girls has decreased considerably compared to the twentieth century,[20][21] with implications for their welfare and their future.[20][22][23][24] In addition, adolescents and young adults have higher rates of allergies,[25][26] higher awareness and diagnoses of mental health problems,[9][12][27][28] and are more likely to be sleep-deprived,[6][29][30] In many countries, youths are more likely to have intellectual disabilities and psychiatric disorders than older people.[31][32] In some European nations, they are facing declining cognitive abilities, especially among the cognitive elites.[16][33]
Around the world, members of Generation Z are spending more time on their electronic devices and less time reading books than before,[34][35][36] with implications for their attention span,[36] their vocabulary,[37][38] and thus their school grades[39] as well as their future in the modern economy.[34] At the same time, reading and writing fan fiction is of vogue worldwide, especially among teenage girls and young women.[40][41] In Asia, educators in the 2000s and 2010s typically sought out and nourished top students whereas in Western Europe and the United States, the emphasis was on low-performers.[42] In addition, East Asian students consistently earned the top spots in international standardized tests during the 2010s.[43][44][45][46]
Terminology and etymology
An early use of the term Generation Z was in the 1994 book Better Than Sex: Confessions of a Political Junkie by Hunter S. Thompson: "Generation X got off easy compared to the hideous fate of the poor bastards in Generation Z. They will be like steerage passengers on the Titanic, trapped in the watery bowels of a sinking 'unsinkable ship.'"[47] Other proposed names for the generation include iGeneration,[48] Gen Tech,[48] Gen Wii,[48] Homeland Generation,[49] Net Gen,[48] Digital Natives,[48] Neo-Digital Natives,[50][51] Plurals,[48] Internet Generation,[52] Centennials,[53] Post-Millennials,[54] and Zoomers.[1] The Pew Research Center surveyed the various names for this cohort on Google Trends in 2019 and found that in the U.S., the term "Generation Z" was the most popular by far, so much so that the Merriam-Webster and Oxford dictionaries both have official entries for it.[55]
Michael Dimmock, Pew Research Center[55]
Multiple people claimed to have coined the term iGeneration (or iGen). Rapper MC Lars is credited with using the term as early as 2003.[56] Demographer Cheryl Russell claims to have first used the term in 2009.[48] Psychology professor and author Jean Twenge claims that the name iGen "just popped into her head" while she was driving near Silicon Valley, and that she had intended to use it as the title of her 2006 book Generation Me about the Millennial generation, until it was overridden by her publisher.[48]
Statistics Canada has noted that the cohort is sometimes referred to as the Internet Generation, as it is the first generation to have been born after the popularization of the Internet.[52] In Japan, the cohort is described as Neo-Digital Natives, a step beyond the previous cohort described as Digital Natives. Digital Natives primarily communicate by text or voice, while neo-digital natives use video, video-telephony, and movies. This emphasizes the shift from PC to mobile and text to video among the neo-digital population.[50][51]
According to Dictionary.com's Slang Dictionary, "Zoomer" is an informal term used to refer to members of Generation Z.[2] According to the Merriam-Webster Dictionary, the term "Zoomer" is rising in popular usage, but was still not widely used enough to justify a dictionary entry as of January 2020. Previously, it was used to describe handheld personal computers or personal digital assistants (in the 1990s) and particularly active Baby Boomers (in the 2000s).[1] Zoomer, in its current incarnation, skyrocketed in popularity in 2018, when it was used in a 4chan Internet meme mocking Gen Z adolescents via a Wojak caricature dubbed a "Zoomer" (a pun on the term "boomer").[57][58] The term "zoomer" is modeled on "boomer" and is often used in an ironic, humorous, or mocking tone.[2]
Date and age range definition
Oxford Living Dictionaries describes Generation Z as "the generation reaching adulthood in the second decade of the 21st century."[59] The Merriam-Webster Online Dictionary defines Generation Z as the generation of people born in the late 1990s and early 2000s.[60]
Australia's McCrindle Research Centre defines Generation Z as those born between 1995 and 2009, starting with a recorded rise in birth rates, and fitting their newer definition of a generational span with a maximum of 15 years.[61] Psychologist Jean Twenge defines the iGeneration as those born 1995–2012.[62] According to UPI, Generation Z starts in 1995.[63] According to Blue Book Services, the lines around Gen Z are "fuzzy" with the starting birth years "usually given at around 1995–96" and the closing birth years "given variously between 2010 and 2012".[64] Ipsos MORI states that their official definition of Gen Z is anyone born from 1996.[65] Business Insider describes the cohort as born between 1996 and 2010, but refers to Pew Research Center's definition.[66]
The Pew Research Center defines Generation Z as people born from 1997 onward, choosing this date for "different formative experiences," such as new technological developments and socioeconomic trends, including the widespread availability of wireless internet access and high-bandwidth cellular service, and key world events, including the September 11th terrorist attacks. Pew has stated that they have not set a definition for the endpoint of Generation Z, but they did use 1997 to 2012 to define Generation Z for an analysis in 2019.[55] According to this definition, the oldest members of Gen Z will turn 24 years old and the youngest will turn 9 years old in 2021.
News outlets such as the Harvard Business Review[67] and BBC[68] describe Generation Z as people born since 1997, and The New York Times[69] and Reuters[70] define Generation Z as people born after 1996. The Brookings Institution describes Gen Z as those born between 1997 and 2012,[71] as does Bloomberg News,[72] PBS,[73] The Washington Post,[74] The Wall Street Journal,[75] The Guardian,[76] Al Jazeera,[77] the Federal Reserve Bank of St. Louis,[78] and The Irish Times.[79] In a 2018 report, the American Psychological Association describes Generation Z as "those between the ages of 15 and 21" at the time.[80] In Japan, generations are defined by a ten-year span with "Neo-Digital Natives" beginning after 1996.[50][51]
Statistics Canada defines Generation Z as starting in 1993.[81] They do not recognize a traditional Millennials cohort and instead have Generation Z directly follow what they designate as Children of Baby Boomers.[82] Randstad Canada describes Generation Z as those born between 1994 and 2010.[83] In a minority viewpoint, author Neil Howe, co-creator of the Strauss–Howe generational theory, defines the Homeland Generation as those born 2005 onwards, but states that the "2005 date remains tentative," saying "You can't be sure where history will someday draw a cohort dividing line until a generation fully comes of age."[49]
Arts and culture
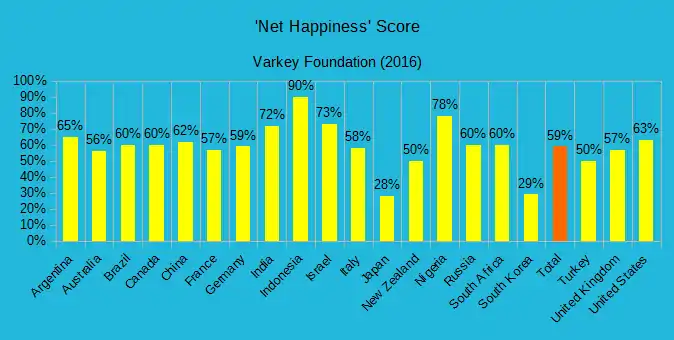
The Economist has described Generation Z as a more educated, well-behaved, stressed and depressed generation in comparison to previous ones.[9] In 2016, the Varkey Foundation and Populus conducted an international study examining the attitudes of over 20,000 people aged 15 to 21 in twenty countries: Argentina, Australia, Brazil, Canada, China, France, Germany, India, Indonesia, Israel, Italy, Japan, New Zealand, Nigeria, Russia, South Africa, South Korea, Turkey, the United Kingdom, and the United States. They found that youths were overall happy with the states of affairs in their personal lives (59%). The most unhappy young people were from South Korea (29%) and Japan (28%) while the happiest hailed from Indonesia (90%) and Nigeria (78%) (see right). In order to determine the overall 'happiness score' for each country, researchers subtracted the percentage of people who said they were unhappy from that of those who said they were happy. The most important sources of happiness were being physically and mentally healthy (94%), having a good relationship with one's family (92%), and one's friends (91%). In general, respondents who were younger and male tended to be happier. Religious faith came in last at 44%. Nevertheless, it was a major source of happiness for youths from Indonesia (93%), Nigeria (86%), Turkey (71%), China and Brazil (both 70%). Top reasons for anxiety and stress were money (51%) and school (46%); social media and having access of basic resources (such as food and water) finished the list, both at 10%. Concerns over food and water were most serious in China (19%), India (16%), and Indonesia (16%); young Indians were also more likely than average to report stress due to social media (19%).[84]
According to the aforementioned study by the Varkey Foundation, most important personal values to these people were helping their families and themselves get ahead in life (both 27%), followed by honesty (26%). Looking beyond their local communities came last at 6%. Familial values were especially strong in South America (34%) while individualism and the entrepreneurial spirit proved popular in Africa (37%). People who influenced youths the most were parents (89%), friends (79%), and teachers (70%). Celebrities (30%) and politicians (17%) came last. In general, young men were more likely to be influenced by athletes and politicians than young women, who preferred books and fictional characters. Celebrity culture was especially influential in China (60%) and Nigeria (71%) and particularly irrelevant in Argentina and Turkey (both 19%). For young people, the most important factors for their current or future careers were the possibility of honing their skills (24%), and income (23%) while the most unimportant factors were fame (3%) and whether or not the organization they worked for made a positive impact on the world (13%). The most important factors for young people when thinking about their futures were their families (47%) and their health (21%); the welfare of world at large (4%) and their local communities (1%) bottomed the list.[84]
A 2019 study conducted by the online rental platform Nestpick considered 110 cities worldwide with regards to factors they believed were important to Generation Z, such as social equality, multiculturalism, and digitization, and found that overall, London, Stockholm, Los Angeles, Toronto, and New York City topped the list. However, the rankings changed with respect to each of the categories considered. Oslo, Bergen (both in Norway), Stockholm, Gothenburg, and Malmö (all from Sweden) were champions of gender equality, yet Seoul, London, Boston, Stockholm, and Los Angeles best met the digital wants of Generation Z. However, given that members of Generation Z tend to be financially pragmatic, all the aforementioned cities shared a common disadvantage: high costs of living. Therefore, the Nestpick index for Generation Z could change in the upcoming years as these people grow older and have different priorities.[85]

During the 2000s and especially the 2010s, youth subcultures that were as influential as what existed during the late twentieth century became scarcer and quieter, at least in real life though not necessarily on the Internet, and more ridden with irony and self-consciousness thanks to awareness of incessant peer surveillance. Moreover, boundaries between the different youth subcultures appear to have been blurred, and nostalgic sentiments have risen.[18][19] In Germany, for instance, youths seem more interested in a more mainstream lifestyle with goals such as finishing school, owning a home in the suburbs, maintaining friendships and family relationships, and stable employment rather than popular culture, glamor, or consumerism.[86] Regardless, in twenty-first-century society, there are inevitably people who refuse to conform to the dominant culture and seek to do the exact opposite; given enough time, the anti-conformists will become more homogeneous with respect to their own subculture, making their behavior the opposite to any claims of counterculture. This synchronization occurs even if more than two choices are available, such as multiple styles of beard rather than whether or not to have a beard. Mathematician Jonathan Touboul of Brandeis University who studies how information propagation through society affects human behavior calls this the hipster effect.[87][88]
A survey conducted by OnePoll found that while museums and heritage sites continued to be popular among Britons between the ages of 18 and 30, 19% did not visit one in the previous year. There was a big gender gap in attitudes, with 16% of female respondents and 26% of male respondents saying they never visited museums. Many youths nowadays preferred staying home and watching television or browsing social media networks to visiting museums or galleries. The researchers also found that cheaper tickets, more interactive exhibitions, greater variety of events, more food and beverage options, more convenient opening hours, and greater online presence could attract the attention of more young people.[89] On the other hand, vintage fashion is growing in popularity among Millennial and Generation-Z consumers.[90]
Digital technology has had a great impact upon the English language, observed the Oxford English Dictionary, as can be seen from the words coined and popularized during the early twenty-first century, such as Blu-ray (2001), selfies (2002), sexting (2005), twitterati (2006), YouTubers (2006), hashtag (2007), binge-watching (2007), and selfie stick (2012).[91]
A 2019 report by Childwise found that among children between the ages of five and sixteen in the U.K. spent an average of three hours each day online. Around 70% watched Netflix in the past week and only 10% watched their favorite programs on television. Among those who watched on-demand shows, 58% did so on a mobile phone, 51% on a television set, 40% via a tablet, 35% a gaming console, and 27% a laptop. About one out of four came from families with voice-command computer assistants such as Alexa. YouTube and Snapchat are the most popular gateways for music and video discovery. Childwise also found that certain television series aired between the 1990s and early 2000s, such as Friends, proved popular among young people of the 2010s.[92]

Figures from Nielsen and Magna Global revealed that the viewership of children's cable television channels such as Disney's Channels, Cartoon Network, and Nickelodeon continued their steady decline from the early 2010s, with little to no alleviating effects due to the COVID-19 pandemic, which forced many parents and their children to stay at home. On the other hand, streaming services saw healthy growth.[93][94] Disney's Channels in particular lost a third of their viewers in 2020, leading to closures in Scandinavia, the United Kingdom, Australia, and Southeast Asia.[94]
During the first two decades of the twenty-first century, writing and reading fan fiction became a prevalent activity worldwide. Demographic data from various depositories revealed that those who read and wrote fan fiction were overwhelmingly young, in their teens and twenties, and female.[40][95][41] For example, an analysis published in 2019 by data scientists Cecilia Aragon and Katie Davis of the site fanfiction.net showed that some 60 billion words of contents were added during the previous 20 years by 10 million English-speaking people whose median age was 15½ years.[41] Fan-fiction writers base their work on various internationally popular cultural phenomena such as K-pop, Star Trek, Harry Potter, Doctor Who, and My Little Pony, known as 'canon', as well as other things they considered important to their lives, like natural disasters.[40][95][41] Much of fan fiction concerns the romantic pairing of fictional characters of interest, or 'shipping'.[96] Aragon and Davis argued that writing fan-fiction stories could help young people combat social isolation and hone their writing skills outside of school in an environment of like-minded people where they can receive (anonymous) constructive feedback, what they call 'distributed mentoring'.[41] Informatics specialist Rebecca Black added that fan-fiction writing could also be a useful resource for English-language learners. Indeed, the analysis of Aragon and Davis showed that for every 650 reviews a fan-fiction writer receives, his or her vocabulary improved by one year of age, though this may not generalize to older cohorts.[97] On the other hand, children browsing fan-fiction contents might be exposed to cyber-bullying, crude comments, and other inappropriate materials.[96]
According to Girls Gen Z Digital media company Sweety High's 2018 Gen Z Music Consumption & Spending Report, Spotify ranked first for music listening among Gen Z, terrestrial radio ranked second, while YouTube was reported to be the preferred platform for music discovery.[98] Using artificial intelligence, Joan Serrà and his team at the Spanish National Research Council studied the massive Million Song Dataset and found that between 1955 and 2010, popular music has gotten louder, while the chords, melodies, and types of sounds used have become increasingly homogenized.[99][100] Indeed, producers seem to be engaging in a "Loudness War," with the intention of attracting more and more audience members. Old hits are re-recorded with simpler chord progression and increased loudness using different instruments to sound new and fashionable.[101] While the music industry has long been accused of producing songs that are louder and blander, this is the first time the quality of songs is comprehensively studied and measured.[99] Additional research showed that within the past few decades, popular music has gotten slower; that majorities of listeners young and old preferred older songs rather than keeping up with new ones; that the language of popular songs was becoming more negative psychologically; and that lyrics were becoming simpler and more repetitive, approaching one-word sheets, something measurable by observing how efficiently lossless compression algorithms (such as the LZ algorithm) handled them.[102]


In New Zealand, child development psychologist Tom Nicholson noted a marked decline in vocabulary usage and reading among schoolchildren, many of whom reluctant to use the dictionary. According to a 2008 survey by the National Education Monitoring Project, about one in five four-year and eight-year pupils read books as a hobby, a ten-percent drop from 2000.[37]
In the United Kingdom, a survey of 2,000 parents and children from 2013 by Nielsen Book found that 36% of children read books for pleasure on a daily basis, 60% on a weekly basis, and 72% were read to by their parents at least once per week. Among British children, the most popular leisure activities were watching television (36%), reading (32%), social networking (20%), watching YouTube videos (17%) and playing games on mobile phones (16%). Between 2012 and 2013, children reported spending more time with video games, YouTube, and texting but less time reading (down eight percent). Among children between the ages of 11 and 17, the share of non-readers grew from 13% to 27% between 2012 and 2013, those who read once to thrice a month (occasional readers) dropped from 45% to 38%, those who read for no more than an average of 15 minutes per week (light readers) rose from 23% to 27%, those who read between 15 and 45 minutes per week (medium readers) declined from 23% to 17%, and those who read at least 45 minutes a week (heavy readers) grew slightly from 15% to 16%.[103]
A survey by the National Literacy Trust from 2019 showed that only 26% of people below the age of 18 spent at least some time each day reading, the lowest level since records began in 2005. Interest in reading for pleasure declined with age, with five- to eight-year-olds being twice as likely to say they enjoyed reading compared to fourteen- to sixteen-year-olds. There was a significant gender gap in voluntary reading, with only 47% of boys compared to 60% of girls said they read for pleasure. One in three children reported having trouble finding something interesting to read.[35]
The aforementioned Nielsen Book survey found that the share of British households with at least one electronic tablet rose from 24% to 50% between 2012 and 2013.[103] According to a 2020 Childwise report based on interviews with 2,200 British children between the ages of five and sixteen, young people today are highly dependent on their mobile phones. Most now get their first device at the age of seven. By the age of eleven, having a cell phone became almost universal. Among those aged seven to sixteen, the average time spent on the phone each day is three and a third hours. 57% said they went to bed with their phones beside them and 44% told the interviewers they felt "uncomfortable" in the absence of their phones. Due to the nature of this technology—cell phones are personal and private devices—it can be difficult for parents to monitor their children's activities and shield them from inappropriate contents.[104]
In the United States, a research team headed by psychologist Jean Twenge analyzed data sets from Monitoring the Future, an ongoing survey of a nationally representative sample of 50,000 teenagers each year from grades eight, ten, and twelve, from 1976 to 2016, for a grand total of , with 51% being female. Originally, there were only twelfth graders; eighth- and tenth graders were added in 1991. They concluded that, "compared with previous generations, teens in the 2010s spent more time online and less time with traditional media, such as books, magazines and television. Time on digital media has displaced time once spent enjoying a book or watching TV." Between 2006 and 2016, usage of digital media increased 100% among twelfth-graders, 75% among tenth-graders, and 68% among eighth-graders. Twelfth-graders spent a grand total of six hours each day texting, social networking, or gaming in the mid-2010s. In 2016, only two out of a hundred tenth-graders read a newspaper everyday, down from one in three in the early 1990s. That same year, only 16% of twelfth-graders read a book or a magazine daily, down from 60% in the 1970s. Twelfth-graders also read on average two fewer books per year in the mid-2016 than the mid-1970s, and a third did not read books at all (including e-books) compared to one ninth in the 1970s. Gaps along sexual, racial, or socioeconomic lines were statistically insignificant. This secular decline in leisure reading came as a surprise for the researchers because "It's so convenient to read books and magazines on electronic devices like tablets. There's no more going to the mailbox or the bookstore—you just download the magazine issue or book and start reading."[36][105]


A 2020 survey conducted by The Center for Generational Kinetics on a thousand members of Generation Z and a thousand Millennials for comparison suggests that the former cohort would still like to travel, despite the COVID-19 pandemic and the recession it induced. However, Generation Z is more likely to look carefully for package deals that would bring them the most value for their money, as many of them are already saving money for buying a house and for retirement, and they prefer more physically active trips. Mobile-friendly websites and social-media engagements are both important.[106]
Both the September 11 terrorist attacks and the Great Recession have greatly influenced the attitudes of this generation in the United States. However, unlike the Millennials, Generation Z typically have little to no memory of the 9/11 terrorist attacks. Since the oldest members were not yet cognizant when the 9/11 attacks occurred (or had not yet been born at that time), there is no generational memory of a time the United States has not been at war with the loosely defined forces of global terrorism.[107][108] Psychologist Anthony Turner suggests it is likely that both events have resulted in a feeling of unsettlement and insecurity among the people of Generation Z with the environment in which they were being raised. The economic recession of 2008 is particularly important to historical events that have shaped Generation Z, due to the ways in which their childhoods may have been affected by the recession's financial stresses felt by their parents.[5] A 2013 survey by Ameritrade found that 47% in the United States (considered here to be those between the ages of 14 and 23) were concerned about student debt, while 36% were worried about being able to afford a college education at all.[109] This generation is faced with a growing income gap and a shrinking middle-class, which all have led to increasing stress levels in families.[5] According to Public Relations Society of America, the Great Recession has taught Generation Z to be independent, and has led to an entrepreneurial desire, after seeing their parents and older siblings struggle in the workforce.[110]
A 2014 study Generation Z Goes to College found that Generation Z students self-identify as being loyal, compassionate, thoughtful, open-minded, responsible, and determined.[111] How they see their Generation Z peers is quite different from their own self-identity. They view their peers as competitive, spontaneous, adventuresome, and curious—all characteristics that they do not see readily in themselves.[111]
Psychologist Jean Twenge argued that as the typical American family has fewer children and as parents pay more attention to each of their children—for example by not allowing them to walk home from school—and to their education, the average American teenager in the mid- to late-2010s tended to be 'slow life-history strategists', meaning they delay taking part in adult activities such as drinking alcohol, having sexual intercourse, or driving.[11]
Cognitive abilities
A 2010 meta-analysis by an international team of mental health experts found that the worldwide prevalence of intellectual disability (ID) or mental retardation was around one percent. But the share of individuals with such a condition in low- to middle-income countries were up to twice as high as their wealthier counterparts because they lacked the sources needed to tackle the problem, such as preventing children from being born with ID due to hereditary conditions with antenatal genetic screening, poor child and maternal care facilities, and inadequate nutrition, leading to, for instance, iodine deficiency. The researchers also found that ID was more common among children and adolescents than adults.[31] A 2020 literature review and meta-analysis confirmed that the incidence of ID was indeed more common than estimates from the early 2000s.[32]
In 2013, a team of neuroscientists from the University College London published a paper on how neurodevelopmental disorders can affect a child's educational outcome. They found that up to 10% of the human population suffer from specific learning disabilities, or about two to three children in a (Western) classroom. Such conditions include dyscalculia, dyslexia, attention deficit hyperactivity disorder (ADHD), and autism spectrum disorder. They are caused by abnormal brain development due to complicated environmental and genetic factors. A child may suffer from multiple learning disorders at the same time. For example, among children with ADHD, 33-45% also suffer from dyslexia and 11% from dyscalculia. Normal or high levels of intelligence offer no protection. Each child has a unique cognitive and genetic profile and would benefit from a flexible education system.[112][113]
A 2017 study from the Dominican Republic suggests that students from all sectors of the educational system utilize the Internet for academic purposes, yet those from lower socioeconomic backgrounds tend to rank the lowest in terms of reading comprehension skills.[114]
A 2020 report by psychologist John Protzko analyzed over 30 studies and found that children have become better at delaying gratification over the previous 50 years, corresponding to an average increase of 0.18 standard deviations per decade on the IQ scale. This is contrary to opinion the majority of the 260 cognitive experts polled (84%), who thought this ability was deteriorating. Researchers test this ability using the Marshmallow Test. Children are offered treats. If they are willing to wait, they get two. If not, they only get one. The ability to delay gratification is associated with positive life outcomes, such as better academic performance, lower rates of substance abuse, and healthier body weights. Possible reasons for improvements in the delaying gratification include higher standards of living, better-educated parents, improved nutrition, higher preschool attendance rates, more test awareness, and environmental or genetic changes. This development does not mean that children from the early twentieth century were worse at delaying gratification and those from late twenty-first will be better at it, however. Moreover, some other cognitive abilities, such as simple reaction time, color acuity, working memory, complexity of vocabulary usage, and three-dimensional visuospatial reasoning have shown signs of secular decline.[16]
In a 2018 paper, cognitive scientists James R. Flynn and Michael Shayer argued that the observed gains in IQ during the twentieth century—commonly known as the Flynn effect—had either stagnated or reversed, as can be seen from a combination of IQ and Piagetian tests. In the Nordic nations, there was a clear decline in general intelligence starting in the 1990s, an average of 6.85 IQ points if projected over 30 years. In Australia and France, the data remained ambiguous; more research was needed. In the United Kingdom, young children suffered a decline in the ability to perceive weight and heaviness, with heavy losses among top scorers. In the German-speaking countries, young people saw a fall in spatial reasoning ability but an increase in verbal reasoning skills. In the Netherlands, preschoolers and perhaps schoolchildren stagnated (but seniors gained) in cognitive skills. What this means is that people were gradually moving away from abstraction to concrete thought. On the other hand, the United States continued its historic march towards higher IQ, a rate of 0.38 per decade, at least up until 2014. South Korea saw its IQ scores growing at twice the average U.S. rate. The secular decline of cognitive abilities observed in many developed countries might be caused by diminishing marginal returns due to industrialization and to intellectually stimulating environments for preschoolers, the cultural shifts that led to frequent use of electronic devices, the fall in cognitively demanding tasks in the job market in contrast to the twentieth century, and possibly dysgenic fertility.[33]
While U.S. IQ scores continued to increase, creativity scores, as measured by the Torrance Test of Creative Thinking, were in decline between the 1990s and late 2000s. Educational psychologist Kyung Hee Kim reached this conclusion after analyzing data samples of kindergartens to high-school students and adults in 1974, 1984, 1990, and 2008, a grand total of 272,599 individuals. Previously, U.S. educational success was attributed to the encouragement of creative thinking, something education reformers in China, Taiwan, South Korea, and Japan sought to replicate. But U.S. educators decided to go in the opposite direction, emphasizing standardization and test scores at the expense of creativity. On the parenting side, given children little play time and letting them spend large amounts of time in front of a screen likely contributed to the trend. Creativity has real-life consequences not just in the arts but also in academia and in life outcomes.[115][116][117]
Demographics
Africa
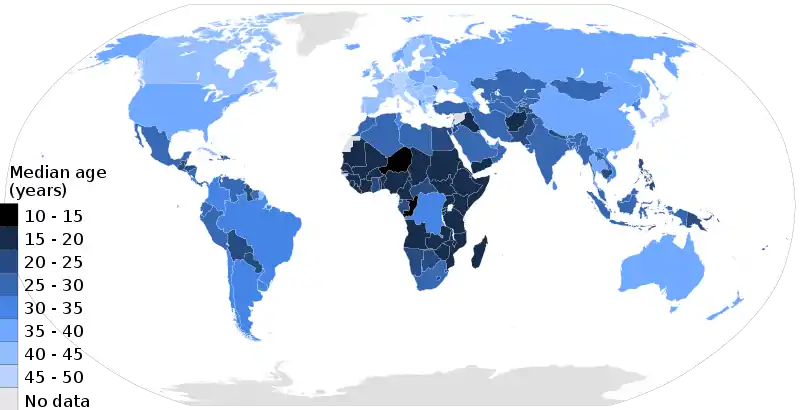
Statistical projections from the United Nations in 2019 suggest that, by 2020, the people of Niger would have a median age of 15.2, Mali 16.3, Chad 16.6, Somalia, Uganda, and Angola all 16.7, the Democratic Republic of the Congo 17.0, Burundi 17.3, Mozambique and Zambia both 17.6. (This means that more than half of their populations were born in the first two decades of the twenty-first century.) These are the world's youngest countries by median age. While a booming population can induce substantial economic growth, if healthcare, education, and economic needs were not met, there would be chronic youth unemployment, low productivity, and social unrest. Investing in human capital is crucial in the formation of a productive society.[118]
Asia
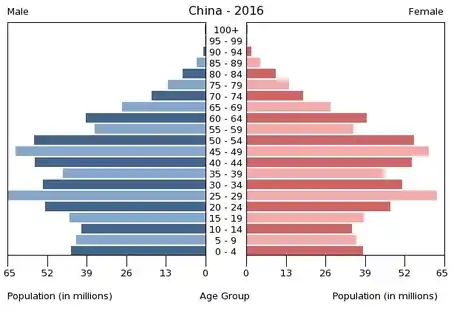
China's fertility rate dropped from 5.91 children per woman in 1967 to 1.6 in 2012. The one-child policy is a factor behind this development. According to the Chinese Central Government, the one-child policy prevented approximately 400 million births. Experts continue to debate this figure, however. Some argue that such a drop in fertility is typical for a rapidly industrializing country while others believe it actually accelerates the aging process. According to demographer Zhen Binwen of the Chinese Academy of Social Sciences, China's labor force would peak in 2015. Almost 7% of China's population were 65 years or older in 2000, a benchmark after which the United Nations considers a population to be aging. China is in fact aging quite quickly. UN figures show that China's ratio of people aged 60 and over increased 3.8% between 2000 and 2010, higher than the global average of 3% between 1950 and 2010. Therefore, China is one of the developing countries with aging populations. The nation's quickly growing and export-driven economy will slow down, as the advantage of abundant and cheap labor fades away. Life expectancy in China rose from 43 in 1960 to 73 in 2010, thanks to improved standards of living, better nutrition, and access to healthcare and education.[119]
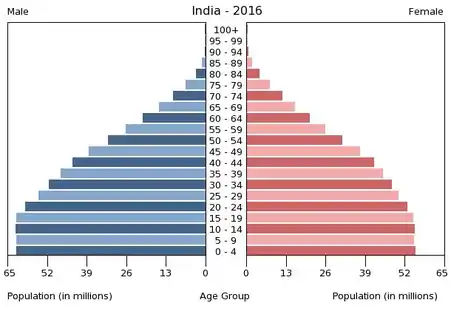
As a result of cultural ideals, government policy, and modern medicine, there have been severe gender imbalances in China and India. According to the United Nations, in 2018, there were 112 Chinese males aged 15 to 29 for every hundred females in that age group. That number in India was 111. China had a total of 34 million excess males and India 37 million, more than the entire population of Malaysia. Together, China and India had a combined 50 million of excess males under the age of 20. Such a discrepancy fuels loneliness epidemics, human trafficking (from elsewhere in Asia, such as Cambodia and Vietnam), and prostitution, among other societal problems.[120]
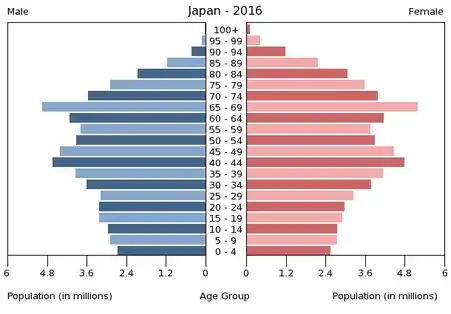
Like the European Union (and unlike the United States), Japan has a declining population. Coupled with an exceptionally long life expectancy (85 years for women and 78 for men, as of 2005) and one of the lowest fertility rates in the world, this means that by 2050, 30% of Japanese will be over the age of 60. While the government has been introducing various incentives for people to have more children, no return on investment could be expected till the 2030s, when the children born in the early 2000s enter the workforce. (Immigration is politically unpopular in this country.)[121] According to official figures, the number of individuals below 15 years of age in Japan was 13.6% of the population in 2007 and was predicted to fall to 12.3% in 2015, or about half that of the elderly. 2007 was the twenty-sixth consecutive year in which the number of people under the age of 15 dropped in Japan.[122] Japan's birth rate fell from roughly replacement level, 2.1, in the early 1970s to 1.26 in 2005.[123] Government officials estimated that population of Japan would decrease 30% by the 2050s, from 127 million to below 90 million.[122]
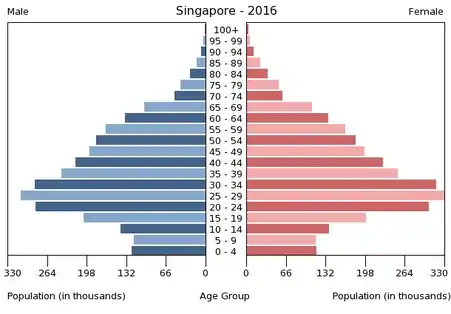
Singapore's birth rate has fallen below the replacement level of 2.1 since the 1980s before stabilizing during the 2000s and 2010s.[124] (It reached 1.14 in 2018, making it the lowest since 2010 and one of the lowest in the world.[125]) Government incentives such as the baby bonus have proven insufficient to raise the birth rate. Singapore's experience mirrors those of Japan and South Korea.[124] In Taiwan, the average reported ideal family size among women aged 18 to 24 dropped from 2.1 in 1991 to 1.8 in 2003. In Hong Kong, that among women aged 18 to 27 fell from 1.8 in 1991 to 1.5 in 2011.[126]
- Population pyramids of India, Japan, and Singapore in 2016
Europe

From about 1750 to 1950, Western Europe transitioned from having both high birth and death rates to having low birth and death rates. By the late 1960s or 1970s, the average woman had fewer than two children, and, although demographers at first expected a "correction," such a rebound never came. Despite a bump in the total fertility rates (TFR) of some European countries in the very late twentieth century (the 1980s and 1990s), especially France and Scandinavia, they never returned to replacement level; the bump was largely due to older women realizing their dreams of motherhood. At first, falling fertility is due to urbanization and decreased infant mortality rates, which diminished the benefits and increased the costs of raising children. In other words, it became more economically sensible to invest more in fewer children, as economist Gary Becker argued. (This is the first demographic transition.) Falling fertility then came from attitudinal shifts. By the 1960s, people began moving from traditional and communal values towards more expressive and individualistic outlooks due to access to and aspiration of higher education, and to the spread of lifestyle values once practiced only by a tiny minority of cultural elites. (This is the second demographic transition.) Although the momentous cultural changes of the 1960s had leveled off by the 1990s, the social and cultural environment of the very late twentieth-century was quite different from that of the 1950s. Such changes in values have had a major effect on fertility that cemented itself in subsequent demographic cohorts. Member states of the European Community saw a steady increase in not just divorce and out-of-wedlock births between 1960 and 1985 but also falling fertility rates. In 1981, a survey of countries across the industrialized world found that while more than half of people aged 65 and over thought that women needed children to be fulfilled, only 35% of those between the ages of 15 to 24 (younger Baby Boomers and older Generation X) agreed.[127]
By the early 2000s, the average reported ideal family size among German-speaking countries has fallen to 1.7, well below the replacement level. Low levels of interest in reproduction is more pronounced among the economically advantaged, in contrast to earlier times, when wealth was correlated with fertility.[126] At the same time, France and Scandinavia retained high fertility rates compared to other developed countries, especially Southern Europe and East Asia. At first sight, it appears that this might be due to their socially progressive values and policies, i.e. making it easier for women to pursue both their careers and reproductive dreams. However, closer scrutiny suggests the argument that "feminism is the new pro-natalism" is untenable, given that there are socially progressive countries with low fertility rates such as Austria and Canada on one hand, and more conservative and traditionalist countries with high fertility rates such as Ireland and the United States on the other.[127]
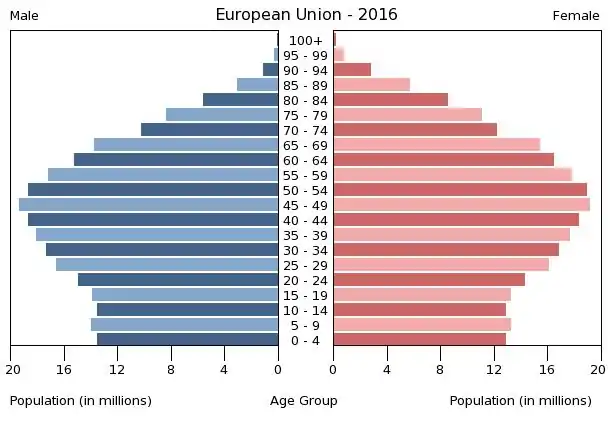
At the start of the twenty-first century, Europe has a population aging at an unprecedented rate. It is estimated that by 2050, 40% of Europeans will be over the age of 60. This problem is especially acute in the East whereas in the West, it is alleviated by international immigration. In addition, an increasing number of children born in Europe has been to non-European parents. Because children of immigrants in Europe tend to be about as religious as they are, this could slow the decline of religion (or the growth of secularism) in the continent as the twenty-first century progresses.[128] In the United Kingdom, the number of foreign-born residents stood at 6% of the population in 1991. Immigration subsequently surged and has not fallen since (as of 2018). Researches by the demographers and political scientists Eric Kaufmann, Roger Eatwell, and Matthew Goodwin suggest that such a fast ethno-demographic change is one of the key reasons behind public backlash in the form of nationalist populist revolts against the political establishment across the rich liberal democracies, an example of which being the Brexit Referendum in 2016.[129]
Italy is a country where the problem of an aging population is especially acute. The fertility rate dropped from about four in the 1960s down to 1.2 in the 2010s. This is not because young Italians do not want to procreate. Quite the contrary, having a lot of children is an Italian ideal. But its economy has been floundering since the Great Recession of 2007–8, with the youth unemployment rate at a staggering 35% in 2019. Many Italians have moved abroad – 150,000 did in 2018 – and many are young people pursuing educational and economic opportunities. With the plunge in the number of births each year, the Italian population is expected to decline in the next five years. Moreover, the Baby Boomers are retiring in large numbers, and their numbers eclipse those of the young people taking care of them. Only Japan has an age structure more tilted towards the elderly. One solution to this problem is incentivizing reproduction, as France has done, by investing in longer parental leaves, daycare, and tax exemptions for parents. As of 2019, France has approximately the same population as Italy but 65% more births. Another solution is immigration, which has been alleviating the decline, but it does not come without political backlash.[130]
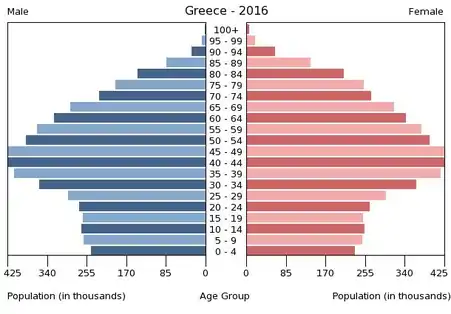
Greece also suffers from a serious demographic problem as many young people are leaving the country in search of better opportunities elsewhere. This brain drain and a rapidly aging population could spell disaster for the country.[131]
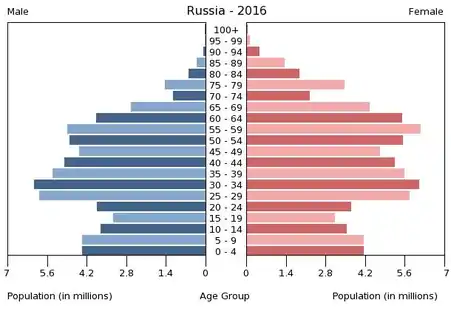
Russia has a falling birth rate and a declining population despite having an improving economy after the collapse of the Soviet Union. According to the United Nations, Russia's population could fall by as much as one third by 2050. Russian government statisticians estimated in 2005 that a boy born in their country that year has a slim chance of seeing his 60th birthday due to various lifestyle-related problems (such as alcoholism). A gap in life expectancy between the West and Russia started becoming noticeable in the 1960s.[132] Russia's population dropped 6% between the mid-1990s and early 2010s.[133]
In the United Kingdom, even though the completed fertility rate changed little, the average age at first birth was increasing during the early 2000s. According to the Royal College of Midwives, this was the main reason why the proportion of births requiring labor inductions or Cesarean sections increased from 31% to 50%.[134]
Between 1990 and 2019, Iceland saw its population grew by 40.7%, Norway by 25.9%, Sweden by 20.0%, Denmark 13.1%, Greenland 0.8%, Finland 10.9%, the Faroe Islands 7.5%, and the Åland Islands 22.9%.[135]
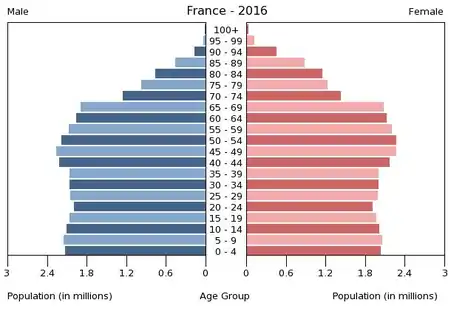
- Population pyramids of France, Greece, and Russia in 2016
North America

Data from Statistics Canada published in 2017 showed that Generation Z comprised 17.6% of the Canadian population.[136] According to Statistics Canada, between 1980 and 2009, the frequency of the sudden infant death syndrome (SIDS) dropped from one per a thousand live births to 0.3, a 71% reduction. Data from the United Nations shows that the mortality rate of newborns between 28 and 364 days of age plummeted 64% and that of toddlers below the age of five fell 9.7% between 1980 and 2015. According to Statistics Canada, the number of households with both grandparents and grandchildren remained rare but has been growing. In 2011, five percent of Canadian children below the age of ten lived with a grandparent, up from 3.3% in the previous decade. This is in part because Canadian parents in early twenty-first century cannot (or think they cannot) afford childcare and often find themselves having to work long hours or irregular shifts. Meanwhile, many grandparents struggle to keep up with their highly active grandchildren on a regular basis due to their age. Between grandparents and parents, potential sources of friction include the diets of the children, their sleep schedule, how to discipline them, and how they may use electronic gadgets. Parents today are more reliant on the Internet for information than their own parents, and many even recommend that they take grandparenting classes. Because Millennials and members of Generation X tend to have fewer children than their parents the Baby Boomers, each child typically receives more attention his or her grandparents and parents compared to previous generations.[137]
In the United States, at the urging of President Lyndon B. Johnson, Congress passed the Immigration and Nationality Act of 1965 (also known as the Hart-Celler Act), which abolished national quotas for immigrants and replaced it with a system that admits a fixed number of persons per year based in qualities such as skills and the need for refuge.[138] During the nineteenth and early twentieth centuries, most immigrants to the United States had come from Europe, but by the late 1990s and early 2000s, Asia and Latin America became the top sources of immigrants to the nation.[139]
A report by demographer William Frey of the Brookings Institution stated that in the United States, the Millennials are a bridge between the largely Caucasian pre-Millennials (Generation X and their predecessors) and the more diverse post-Millennials (Generation Z and their successors).[140] Frey's analysis of U.S. Census data suggests that as of 2019, 50.9% of Generation Z is white, 13.8% is black, 25.0% Hispanic, and 5.3% Asian. (See figure below.)[141] 29% of Generation Z are children of immigrants or immigrants themselves, compared to 23% of Millennials when they were at the same age. As of 2019, 13.7% of the U.S. population is foreign-born, compared to 9.7% in 1997, when the first members of Generation Z had their birth cries.[142]

According to the Census Bureau, the number of people of mixed heritage has risen significantly between 2000 and 2010. More specifically, the number of Americans who identify as mixed white and black has grown by 134% and those of both white and Asian extraction by 87%.[3] Frey's research also suggests that at the national level, Hispanics and Asians are the fastest growing racial minority groups in the United States while the number of Caucasians under the age of 18 has been declining since 2000. This demographic change could have social, cultural, and political implications for the decades ahead.[143]
Members of Generation Z are slightly less likely to be foreign born than Millennials;[144] the fact that more American Latinos were born in the U.S. rather than abroad plays a role in making the first wave of Generation Z appear better educated than their predecessors. However, researchers warn that this trend could be altered by changing immigration patterns and the younger members of Generation Z choosing alternate educational paths.[145] As a demographic cohort, Generation Z is smaller than the Baby Boomers and their children, the Millennials.[146] According to the U.S. Census Bureau, Generation Z makes up about one quarter of the U.S. population, as of 2015.[147] Provisional data from the Center for Disease Control and Prevention reveal that U.S. fertility rates have fallen below the replacement level of 2.1 since 1971. (It was 1.765 in 2017.)[148] There was an 'echo boom' in the 2000s, which certainly increased the absolute number of future young adults, but did not significantly change the relative sizes of this cohort compared to their parents.[149]
The fertility rate of Mexico, once among the highest in the world, was approximately at replacement level in 2010, down from almost seven in 1960. This is due to government birth control policies dating back to the 1970s that made heavy use of sterilization in a country with stringent abortion restrictions except in the capital. By the 2000s, about 40% of married Mexican women were sterilized. Women's increased participation in the workforce and improved educational opportunities also played a role in this development. Although the number of new Mexicans each year in the 2000s was the same as those from the 1970s, the rate of growth has slowed substantially. Mexicans' average age was 28 in 2010, up from 17 in 1980. For comparison, Europe took a century rather than 30 years to make the same demographic transition. Mexicans living in the United States had a higher fertility rate than their counterparts in the old country, however, and this means that the number of people of Mexican heritage would continue to grow North of the border. In fact, in the early 2000s, there was significant Mexican migration, legal and otherwise, into the United States, where standards of living and wages are higher.[150]
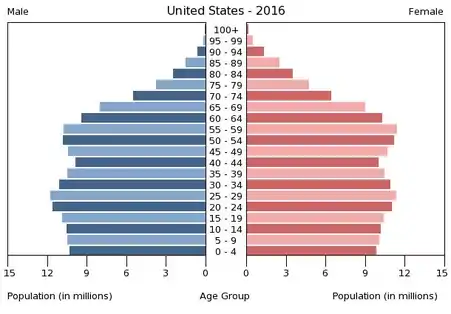
- Population pyramids of Canada, the United States, and Mexico in 2016


Oceania

Australia's total fertility rate has fallen from above three in the post-war era, to about replacement level (2.1) in the 1970s to below that in the late 2010s. (It was 1.74 in 2017.) However, immigration has been offsetting the effects of a declining birthrate. In the 2010s, among the residents of Australia, 5% were born in the United Kingdom, 2.5% from China, 2.2% from India, and 1.1% from the Philippines. 84% of new arrivals in the fiscal year of 2016 were below 40 years of age, compared to 54% of those already in the country. Like other immigrant-friendly countries, such as Canada, the United Kingdom, and the United States, Australia's working-age population is expected to grow till about 2025. However, the ratio of people of working age to retirees (the dependency ratio) has gone from eight in the 1970s to about four in the 2010s. It could drop to two by the 2060s, depending in immigration levels.[151] "The older the population is, the more people are on welfare benefits, we need more health care, and there's a smaller base to pay the taxes," Ian Harper of the Melbourne Business School told ABC News (Australia).[152] While the government has scaled back plans to increase the retirement age, to cut pensions, and to raise taxes due to public opposition, demographic pressures continue to mount as the buffering effects of immigration are fading away.[151] Australians coming of age in the early twenty-first century are more reluctant to have children compared to their predecessors due to economic reasons: higher student debt, expensive housing, and negative income growth.[152]
Education
Global trends
Enrollment in primary schools in developing countries has been rising steadily since the mid-twentieth century. By the 1990s and 2000s, primary-school enrollment rates in these countries approached 100%, sitting just below those of the developed world.[153] According to the Organization for Economic Cooperation and Development (OECD), countries spent an average of US$10,759 educating their children from primary school to university in 2014.[154]
Over 600,000 students between the ages of eight and nine from 49 countries and territories took part in the 2015 Trends in International Mathematics and Science Study (TIMSS). The highest-scoring students in mathematics hailed from Singapore, Hong Kong, South Korea, Taiwan, and Japan. In particular, the gap between the lowest scoring East Asian country (Japan, at 593) was 23 points higher than the next nation (Northern Ireland, at 570), which was unchanged from 2011. In science, the top scorers were from Singapore, South Korea, Japan, Russia, and Hong Kong.[43]


The OECD-sponsored Program for International Student Assessment (PISA) is administered every three years to fifteen-year-old schoolchildren around the world on reading comprehension, mathematics, and science. Students from 71 nations and territories took the PISA tests in 2015. Students with the highest average scores in mathematics came from Singapore, Hong Kong, Macao, Taiwan, and Japan; in science from Singapore, Japan, Estonia, Taiwan, and Finland; and in reading from Singapore, Hong Kong, Canada, Finland, and Ireland.[45]

In 2019, the OECD surveyed educational standards and achievement of its 36 member states and found that while education spending has gone up by an average of 15% over the previous decade, academic performance of 15-year-old students in reading, mathematics, and science on the PISA has largely stagnated. Students from China and Singapore, both outside of the OECD, continued to outclass their global peers. Among all the countries that sent their students to take the PISA, only Albania, Colombia, Macao, Moldova, Peru, Portugal, and Qatar saw any improvements since joining. Of these, only Portugal is an OECD country. Meanwhile, Australia, Finland, Iceland, the Netherlands, New Zealand, Slovakia, and South Korea all saw a decline in overall performance since joining. Funding, while important, is not necessarily the most important thing, as the case of Estonia demonstrates. Estonia spent 30% below the OECD average yet still achieved top marks.[34]
Socioeconomic background is a key factor in academic success in the OECD, with students coming from families in the top 10% of the income distribution being three years ahead in reading skills compared to those from the bottom 10%. However, the link between background and performance was weakest in Australia, Canada, Denmark, Estonia, Finland, Japan, Norway, South Korea, and the United Kingdom, meaning these countries have the most equitable education systems.[34] A proposed method of assessing the equality of educational opportunities in a given society is to measure the heritability of academic ability as empirical evidence does support the hypothesis that the heritability of test results is higher in a country with a national curriculum compared to one with a decentralized system; having a national curriculum aimed at equality reduces environmental influences.[155]
.jpg.webp)
The COVID-19 pandemic has disrupted the education of around one and a half billion students as schools in 165 countries closed their doors and 60 million teachers were sent home, according to UNESCO. A number of countries tackled the problem by expanding access to the Internet in remote areas or broadcasting more educational materials on national television.[156]
Different nations and territories approach the question of how to nurture gifted students differently. During the 2000s and 2010s, whereas the Middle East and East Asia (especially China, Hong Kong, and South Korea) and Singapore actively sought them out and steered them towards top programs, Europe and the United States had in mind the goal of inclusion and chose to focus on helping struggling students. In 2010, for example, China unveiled a decade-long National Talent Development Plan to identify able students and guide them into STEM fields and careers in high demand; that same year, England dismantled its National Academy for Gifted and Talented Youth and redirected the funds to help low-scoring students get admitted to elite universities. Developmental cognitive psychologist David Geary observed that Western educators remained "resistant" to the possibility that even the most talented of schoolchildren needed encouragement and support and tended to concentrate on low performers. In addition, even though it is commonly believed that past a certain IQ benchmark (typically 120), practice becomes much more important than cognitive abilities in mastering new knowledge, recently published research papers based on longitudinal studies, such as the Study of Mathematically Precocious Youth (SMPY) and the Duke University Talent Identification Program, suggest otherwise.[42]
Since the early 2000s, the number of students from emerging economies going abroad for higher education has risen markedly. During the 2010s, while the number electing to study in the United Kingdom and the United States largely evened out, more and more opted for Australia and Canada. This was a golden age of growth for many Western universities admitting international students.[157] In the late 2010s, around five million students trotted the globe each year for higher education, with the developed world being the most popular destinations and China the biggest source of international students. But as relations between the West and China soured and because of the COVID-19 pandemic, Western universities saw their revenue from foreign students plummet and will have to reconfigure themselves in order to survive. Government assistance might not be available due to the strained ties between universities and many politicians, who are skeptical of the value of higher education because even though admissions has boomed, productivity growth as slowed.[158] Moreover, political battles in the West are increasingly fought between those who have university degrees and those who do not. In any case, universities that are highly dependent on revenue for foreign students face the possibility of bankruptcy. COVID-19 has ended the golden age of universities.[157]
For information on public support for higher education (for domestic students) in various countries in 2019, see chart below.
.png.webp)
In Asia
In South Korea, teaching is a prestigious and rewarding and the education system is highly centralized and focused on testing. Similarly, in Singapore, becoming a teacher is by no means an easy task and the nation's education system is also centrally managed.[154]
In Europe
In Finland, during the 2010s, it was extremely difficult to become a schoolteacher, as admissions rates for a teacher's training program were even lower than for programs in law or medicine.[154]
_Facult%C3%A9_des_Sciences_-_Universit%C3%A9_Paris-Saclay.jpg.webp)
According to the 2015 Trends in International Mathematics and Science Study (TIMSS), French students scored last in mathematics and next-to-last in science when compared to other member states of the European Union. French fourth graders (students aged eight to nine) scored an average of 488 points in mathematics and 487 in science, compared to the E.U. average of 527 and 525, respectively. Internationally, France ranked in 35th place out of the 49 participant countries and territories.[43] French mediocrity in mathematics at the level of grade school notwithstanding, the situation in higher education and research was a revelation, as can be seen in the number of Fields Medalists the nation has produced, which is more than any other country except the United States.[159][160]
In early 2020, the Paris-Saclay University opened. It merged some 20 tertiary and research institutions (including the elite grandes écoles and specialized research institutes), employs 9,000 teaching and research faculty members, and serves 48,000 students. It is dedicated to science and is intended to be what President Emmanuel Macron called the "MIT à la française." Although the French were previously indifferent towards international rankings of universities, Paris-Saclay is, as of 2020, one of the best in the world, especially in mathematics.[160]
In France, while year-long mandatory military service for men was abolished in 1996 by President Jacques Chirac, who wanted to build a professional all-volunteer military,[161] all citizens between 17 and 25 years of age must still participate in the Defense and Citizenship Day (JAPD), when they are introduced to the French Armed Forces, and take language tests.[161] In 2019, President Macron introduced something similar to mandatory military service, but for teenagers, as promised during his presidential campaign. Known as the Service National Universel or SNU, it is a compulsory civic service. While students will not have to shave their heads or handle military equipment, they will have to sleep in tents, get up early (at 6:30 am), participate in various physical activities, raise the tricolor, and sing the national anthem. They will have to wear a uniform, though it is more akin to the outfit of security guards rather than military personnel. This program takes a total of four weeks. In the first two, youths learn how to provide first aid, how navigating with a map, how to recognize fake news, emergency responses for various scenarios, and self-defense. In addition, they get health checks and get tested on their mastery of the French language, and they participate in debates on a variety of social issues, including environmentalism, state secularism, and gender equality. In the second fortnight, they volunteer with a charity for local government. The aim of this program is to promote national cohesion and patriotism, at a time of deep division on religious and political grounds, to get people out of their neighborhoods and regions, and mix people of different socioeconomic classes, something mandatory military service used to do. Supporters thought that teenagers rarely raise the national flag, spend too much time on their phones, and felt nostalgic for the era of compulsory military service, considered a rite of passage for young men and a tool of character-building. Critics argued that this program is inadequate, and would cost too much.[162] The SNU is projected to affect some 800,000 French citizens each year when it becomes mandatory for all aged 16 to 21 by 2026, at a cost of some €1.6 billion.[162] Another major concern is that it will overburden the French military, already stretched thin by counter-terrorism campaigns at home and abroad.[161] A 2015 IFOP poll revealed that 80% of the French people supported some kind of mandatory service, military, or civilian. At the same time, returning to conscription was also popular; supporters included 90% of the UMP party, 89% of the National Front (now the National Rally), 71% of the Socialist Party, and 67% of people aged 18 to 24. This poll was conducted after the Charlie Hebdo terrorist attacks.[163]
.jpg.webp)
In the early 2010s, British schoolboys found themselves falling behind girls in reading comprehension. In 2011, only 80% of boys reached the expected reading level at age 11 compared to 88% of girls; the gap widened to 12 points at age 14. Previous research suggests this is due to the general tendency of boys not receiving a lot of encouragement in voluntary reading.[164] Teachers noticed that secondary schoolboys struggled to carry on reading. 25% said interest waned within the first few pages, 22% the first 50 pages, another 25% the first hundred. Almost a third reported that boys lost interest on the cover if the book had more than 200 pages. English-language literary classics most unpopular among boys included the novels of Jane Austen, the plays of William Shakespeare (especially Macbeth, The Tempest, and A Midsummer Night's Dream), and John Steinbeck's Of Mice and Men.[165]
69% of British primary schoolteachers and 60% of secondary schoolteachers reported in 2018 they saw a growing frequency of substandard vocabulary levels in their students of all ages, leading to not just low self-esteem and various other behavioral and social problems, but also to greater difficulty in courses such as English and history and in important exams such as the General Certificate of Secondary Education (GCSE), a set of school-leaving exams required for 16-year-olds. 49% of Year 1 students and 43% of children in Year 7 (ages 11 to 12) lacked the vocabulary to excel in school. Many believed that the decline in reading for pleasure among students, especially older teenagers, to be the cause of this trend. Psychologist Kate Nation warned, "Regardless of the causes, low levels of vocabulary set limits on literacy, understanding, learning the curriculum and can create a downward spiral of poor language which begins to affect all aspects of life."[38][39]
In 2017, almost half of Britons have received higher education by the age of 30. This is despite the fact that £9,000 worth of student fees were introduced in 2012. U.K. universities first introduced fees in autumn 1998 to address financial troubles and the fact that universities elsewhere charged tuition. Prime Minister Tony Blair introduced the goal of having half of young Britons earning a university degree in 1999, though he missed the 2010 deadline.[166] Blair did not take into account the historical reality that an oversupply of young people with high levels of education precipitated periods of political instability and unrest in various societies, from early modern Western Europe and late Tokugawa Japan to the Soviet Union, modern Iran, and the United States. Quantitative historian Peter Turchin termed this elite overproduction.[167][168] Turchin estimated that 30% of British university graduates were overqualified given the requirements of their jobs[169] while the Institute for Fiscal Studies (IFS) reckoned that one out of five graduates would have been better off had they not gone to university.[158] The IFS also warned that 13 British universities risked bankruptcy as admissions fall precipitously due to the COVID-19 pandemic. Normally, admissions rise in during an economic recession as people seek to enhance their competitiveness in the workforce, but this did not happen with the one induced by the pandemic due to requirements of social distancing and the availability of online classes.[158] Prime Minister Boris Johnson has made the case for better vocational training. "We need to recognize that a significant and growing minority of young people leave university and work in a non-graduate job," he said.[169]
Nevertheless, demand for higher education in the United Kingdom remains strong, driven by the need for high-skilled workers from both the public and private sectors. There was, however, a widening gender gap. As of 2017, women were more likely to attend or have attended university than men, 55% to 43%, a 12% gap.[166]
In North America
2018 PISA test results showed that in reading comprehension, Canadian high-school students ranked above the OECD average, but below China and Singapore. Students from Alberta scored above the national average, from British Columbia, Ontario, Quebec, Newfoundland and Labrador, and Nova Scotia about average, and Saskatchewan, Manitoba, New Brunswick, and Prince Edward Island below average. Nationally, 14% of Canadian students scored below Level 2 (407 points or higher), but with a significant gender gap. While 90% of girls were at Level 2 or higher, only 82% of boys did the same, in spite of the initiatives aimed at encouraging boys to read more. Overall, the Canadian PISA reading average has declined since 2000, albeit with a significant bump in 2015. In mathematics, Canada was behind China, Singapore, Japan, South Korea, Estonia, and Finland that year, when 600,000 students from 79 countries took the PISA tests. There was no improvement in the mathematical skills of Canadian students since 2012 as assessed by PISA, with one in six students scoring below the benchmark.[44]
During the 2010s, investigative journalists and authorities have unveiled numerous instances of academic dishonesty in Australia, Canada, the United Kingdom, and the United States, ranging from contract cheating (buying an essay, hiring someone to complete an assignment or to take an exam) to bribing admissions officers. In some instances, advertisements for contract cheating were found right next to university campuses. The actual prevalence of plagiarism remains unknown, and early research might have underestimated the true extent of this behavior.[170]
While courses on home economics, also known as family and consumer sciences (FCS), were commonplace in the United States during the twentieth century, they were on the decline in the early twenty-first for a variety of reasons, ranging from a shortage of qualified teachers to funding cuts. This is despite attempts to revise them for life in the contemporary era. FCS courses in the past taught the basics of cooking and housework but now also teach nutrition, community gardening, composting, personal finance, among other topics; they are intended to fill in the gaps of knowledge that parents in the olden days taught their children but in many cases can no longer do because both parents are working. In 2012, there were only 3.5 million students enrolled in FCS courses in secondary schools, a drop of 38% from the previous decade.[171]
In 2013, less than a third of American public schools had access to broadband Internet service, according to the non-profit EducationSuperHighway. By 2019, however, that number reached 99%, which has increased the frequency of digital learning.[172]
According to a 2015 Northeastern University Survey, 81% of Generation Z in the U.S. believes obtaining a college degree is necessary in achieving career goals.[173] As Generation Z enters high school, and they start preparing for college, a primary concern is paying for a college education without acquiring debt. Students report working hard in high school in hopes of earning scholarships and the hope that parents will pay the college costs not covered by scholarships. Students also report interest in ROTC programs as a means of covering college costs.[174] According to NeaToday, a publication by the National Education Association, two thirds of Gen Zers entering college are concerned about affording college. One third plan to rely on grants and scholarships and one quarter hope that their parents will cover the bulk of college costs. While the cost of attending college is incredibly high for most Gen Zers, according to NeaToday, 65% say the benefits of graduating college exceed the costs.[174] As of 2019, the total college debt has exceeded $1.5 trillion, and two out of three college graduates are saddled with debt. The average borrower owes $37,000, up $10,000 from ten years before. A 2019 survey by TD Ameritrade found that over 30% of Generation Z (and 18% of Millennials) said they have considered taking a gap year between high school and college.[175]
Generation Z is revolutionizing the educational system in many aspects. Thanks in part to a rise in the popularity of entrepreneurship and advancements in technology, high schools and colleges across the globe are including entrepreneurship in their curriculum.[176] According to the World Economic Forum, over one in five members of Generation Z are interested in attending a trade or technical school instead of a college or university.[177] In the United States today, high school students are generally encouraged to attend college or university after graduation while the options of technical school and vocational training are often neglected.[178] According to the 2018 CNBC All-American Economic Survey, only 40% of Americans believed that the financial cost of a four-year university degree is justified, down from 44% five years before. Moreover, only 50% believed a four-year program is the best kind of training, down from 60%, and the number of people who saw value in a two-year program jumped from 18% to 26%. These findings are consistent with other reports.[179]

Members of Generation Z are anxious to pick majors that teach them marketable skills.[180] According to the World Economic Forum (WEF), some 88% consider job preparation to be the point of college. 39% are aiming for a career in medicine or healthcare, 20% in the natural sciences, 18% in biology or biotechnology, and 17% in business.[181] A 2018 Gallup poll on over 32,000 university students randomly selected from 43 schools from across the United States found that just over half (53%) of them thought their chosen major would lead to gainful employment. STEM students expressed the highest confidence (62%) while those in the liberal arts were the least confident (40%). Just over one in three thought they would learn the skills and knowledge needed to become successful in the workplace.[182] Because jobs (that matched what one studied) were so difficult to find in the few years following the Great Recession, the value of getting a liberal arts degree and studying the humanities at university came into question, their ability to develop a well-rounded and broad-minded individual notwithstanding.[183] Moreover, institutions of higher education came under heightened skepticism in the 2010s due to high costs and disappointing results. People became increasingly concerned about debts and deficits. No longer were promises of educating "citizens of the world" or estimates of economic impact coming from abstruse calculations sufficient. Colleges and universities found it necessary to prove their worth by clarifying how much money from which industry and company funded research, and how much it would cost to attend.[184] While the number of students majoring in the humanities have fallen significantly, those in science, technology, engineering, and mathematics, or STEM, have risen sharply.[180] About a quarter of American university students failed to graduate within six years in the late 2010s and those who did faced diminishing wage premiums.[158]

According to the 2018 National Assessment of Educational Progress, 73% of American eighth and twelfth graders had deficient writing skills.[41] There have been numerous reports in the 2010s on how U.S. students were falling behind their international counterparts in the STEM subjects, especially those from (East) Asia. This is a source of concern for some because academically gifted students in STEM can have an inordinately positive impact on the national economy. In addition, while American students are less focused on STEM, students from China and India are not only outperforming them but are also coming to the United States in large numbers for higher education.[46]
Data from the Institute of International Education showed that compared to the 2013–14 academic year, the number of foreign students enrolling in American colleges and universities peaked in 2015–6, with about 300,000 students, before falling slightly in subsequent years. Compared to the 2017–18 academic year, 2018-19 saw a drop of 1% in the number of foreign students. This is a concern for institutions that have become reliant on international enrollment for revenue, as they typically charge foreign students more than their domestic counterparts. As of 2019, these were the first downturn in a decade. However, the number of foreign graduates staying for work or further training has increased. In 2019, there were 220,000 who were authorized to stay for temporary work, a 10% rise compared to fall 2017. Top sources of students studying abroad in the United States were China, South Korea, India, and Saudi Arabia (in that order). While the number of Chinese students on American soil has fallen noticeably—due to a variety of factors, such as reported difficulty of obtaining a U.S. visa amid the ongoing Sino-American trade war, more competition from Canada and Australia, and growing anti-Chinese sentiments due to concerns over intellectual property theft—students coming from elsewhere in Asia (though not South Korea and Japan), Latin America, and Africa have gone up. In particular, the number of Nigerian students climbed 6% while those from Brazil and Bangladesh rose 10%. The most popular majors have shifted, with business, an academic subject extremely popular among Chinese students, falling by 7% in the 2018–19 academic year. Meanwhile, mathematics and computer science jumped 9%, replacing business as the second most popular majors after engineering.[185]
In 2019, there were over 4,000 colleges and universities in the U.S. However, Harvard business professor Clayton Christensen, known for creating the theory of "disruptive innovation" and applying it to a variety of industries, including education, predicted that half of all American colleges will go bankrupt within the next ten to fifteen years because of innovations in online learning.[186] On the other hand, economist Michael Horn, also at Harvard, predicted in 2019 that 25% will close within the next 20 years.[187] Rising administrative costs, sluggish middle-class wages, demographic decline (especially in the Northeastern and Midwestern United States), new forms of learning, stronger competition from better endowed universities, and higher demands for technical training undermine the financial viability of many schools.[187][188] "It's going to be brutal across American higher education," Horn told CBS News.[187] A 2019 analysis by Moody's Investor Services estimated that about 20% of all small private liberal arts colleges in the United States were in serious financial trouble.[188] Historically, this is not unprecedented; the 1970s and the 1980s saw drops in college enrollment, too. But increased enrollment by women halted the decline. Today, higher enrollment by first-generation students and Hispanics could do the same.[189]
Historically, university students were more likely to be male than female. The difference was especially great during the second half of the twentieth century, when enrollment rose dramatically compared to the 1940s. This trend continues into the very early twenty-first century. By the late 2010s, however, the situation has reversed. Women are now more likely to enroll in university than men.[190] As a matter of fact, by the late 2010s, more than half of university students were women.[189] In 2018, upwards of one third of each sex is a university student.[190]
In Oceania
By the late 2010s, education has become Australia's fourth largest exports, after coal, iron ore, and natural gas. For Australia, foreign students are highly lucrative, bringing AU$9 billion into the Australian economy in 2018. That amount was also just over a quarter of the revenue stream for Australian universities. In 2019, Australian institutions of higher education welcomed 440,000 foreign students, who took up about 30% of all seats. 40% of non-Australian students hailed from China. In response to a surge in interest from prospective foreign students, Australian universities have invested lavishly in research laboratories, learning facilities, and art collections. Some senior bureaucrats saw their salaries rise tremendously. But the topic of international students is a contentious one in Australia. Proponents of accepting high numbers of foreign students said this was because the Australian government was not providing sufficient funding, forcing schools to take in more from other countries. Critics argued universities have made themselves too dependent on foreign revenue streams. In 2020, as SARS-CoV-2 spread around the globe, international travel restrictions were imposed, preventing foreign students from going to university in Australia, where the academic year begins in January. This proved to be a serious blow to the higher-education industry in Australia because it is more dependent on foreign students than its counterparts in other English-speaking countries. Australia's federal government excluded universities AU$60bn wage-subsidy scheme because it wanted to focus on domestic students, who, it said, will continue to receive funding. Federal and state governments were likely to provide relief to small regional institutions, but, like the big universities, they might need to shrink in order to survive.[191]
Employment prospects and economic trends
Global developments
In 2018, as the number of robots at work continued to increase, the global unemployment rate fell to 5.2%, the lowest in 38 years. Current trends suggest that developments in artificial intelligence and robotics will not result in mass unemployment but can actually create high-skilled jobs. However, in order to take advantage of this situation, one needs a culture and an education system that promote lifelong learning. Honing skills that machines have not yet mastered, such as teamwork and effective communication, will be crucial.[192][193]
Parents of Generation Z might have the image of their child's first business being a lemonade stand or car wash. While these are great first businesses, Generation Z now has access to social media platforms, website builders, 3D printers, and drop shipping platforms which provides them with additional opportunities to start a business at a young age. The internet has provided a store front for Generation Z to sell their ideas to people around the world without ever leaving their house.[194]
As technological progress continues, something that is made evident by the emergence of or breakthroughs in artificial intelligence, robotics, three-dimensional printing, nanotechnology, quantum computing, autonomous vehicles, among other fields, culminating in what economist Klaus Schwab calls the 'Fourth Industrial Revolution', the demand for innovative, well-educated, and highly skilled workers continues to rise, as do their incomes. Demand for low-pay and low-skilled workers, on the other hand, will continue to fall.[195]
By analyzing data from the United Nations and the Global Talent Competitive Index, KDM Engineering found that as of 2019, the top five countries for international high-skilled workers are Switzerland, Singapore, the United Kingdom, the United States, and Sweden. Factors taken into account included the ability to attract high-skilled foreign workers, business-friendliness, regulatory environment, the quality of education, and the standard of living. Switzerland is best at retaining talents due to its excellent quality of life. Singapore is home to a world-class environment for entrepreneurs. And the United States offers the most opportunity for growth due to the sheer size of its economy and the quality of higher education and training.[196] As of 2019, these are also some of the world's most competitive economies, according to the World Economic Forum (WEF). In order to determine a country or territory's economic competitiveness, the WEF considers factors such as the trustworthiness of public institutions, the quality of infrastructure, macro-economic stability, the quality of healthcare, business dynamism, labor market efficiency, and innovation capacity.[197]
In 2020, the COVID-19 global pandemic not only created a health crisis but also triggered a severe economic downturn. While they are less likely to suffer from the disease, many people born between the late 1990s and early 2000s now face rather dim economic prospects, as companies cut back on hiring, cancel internships, and fire their employees in order to stay in business. Low-skilled workers and those who just graduated are affected the most, but professionals who are able to work from home are spared.[198]
Asia
Statistics from the International Monetary Fund (IMF) reveal that between 2014 and 2019, Japan's unemployment rate went from about 4% to 2.4% and China's from almost 4.5% to 3.8%. These are some of the lowest rates among the top economies.[199]
When he came to power in 1949, Chairman Mao Zedong vowed to abolish capitalism and social classes. 'Old money' ceased to exist in China as a result of a centrally planned economy. But that changed in the 1980s when Deng Xiaoping introduced economic reforms; the middle and upper classes have blossoming ever since. In fact, he considered getting rich to be "glorious." Chinese cities have morphed into major shopping centers. The number of billionaires (in U.S. dollars) in China is growing faster than anywhere else in the world, so much so that butler academies, whose students will serve the 'new rich', and finishing schools, whose students were born to rich parents, have been established. However, according to the World Bank, 27% of Chinese still live below the poverty line. The Chinese Communist Party (CCP) promised to end poverty by 2020. CCP General Secretary Xi Jinping's anti-corruption campaign also cracks down on what he considered 'ostentatious displays of wealth'. Moreover, members of China's upper class must align themselves closely with the Communist Party. A number of young Chinese entrepreneurs have taken advantage of the Internet to become social media influencers to sell their products.[200]
Technology companies and startups are booming in China and Southeast Asia. Whereas in the past, Chinese firms copied the business strategies and models from their U.S. counterparts, now, they are developing their own approaches, and Southeast Asian companies are learning from their success and experience, a practice known as "Copy from China." E-commerce has been flourishing. In Singapore, for example, not only is it now possible to place orders online, one may also purchase groceries in person, pay by mobile phone, and have them packed by machines; there are no cashiers. Whereas Westerners were first introduced to the Internet via their personal computers, people in China and Southeast Asia first got online with their mobile phones. Consequently, the e-commerce industry's heavy usage of mobile phone applications has paid off handsomely. In particular, Chinese entrepreneurs invest in what are known as "super-apps," those that enable users to access all kinds of services within them, not just messaging, but also bike rentals and digital wallets. In Indonesia, relying on credit-card payments is difficult because the market penetration of this technology remains rather low (as of 2019). Nevertheless, e-commerce and ride-hailing are growing there, too. But it is Singapore that is the startup hub of the region, thanks to its excellent infrastructure, government support, and abundant capital. Furthermore, Singaporean technology firms are "uniquely positioned" to learn from both the U.S. and China.[201]
China's Generation Z has been taking advantage of the variety of lending options available to them, albeit at the cost of exceedingly high and possibly illegal interest rates. Although authorities have been cracking down on questionable money lenders, there is still a plethora of ways to borrow money. According to Bloomberg, China's household debt-to-GDP ratio jumped from 27% in 2010 to 57% in 2019. For comparison, household debt was 126% of GDP in Australia, 99% in South Korea, and 75% in the United States, according to Bank of America. However, Fitch Ratings estimated that the rate of growth was twice that of nominal GDP. According to the People's Bank of China, the nation's debt-to-disposable income ratio was 99.9% in 2019, up from 93.4% the previous year.[202]
Europe
In Europe, although the unemployment rates of France and Italy remained relatively high, they were markedly lower than previously. Meanwhile, the German unemployment rate dipped below even that of the United States, a level not seen since its unification almost three decades prior.[199] Eurostat reported in 2019 that overall unemployment rate across the European Union dropped to its lowest level since January 2000, at 6.2% in August, meaning about 15.4 million people were out of a job. The Czech Republic (3%), Germany (3.1%) and Malta (3.3%) enjoyed the lowest levels of unemployment. Member states with the highest unemployment rates were Italy (9.5%), Spain (13.8%), and Greece (17%). Countries with higher unemployment rates compared to 2018 were Denmark (from 4.9% to 5%), Lithuania (6.1% to 6.6%), and Sweden (6.3% to 7.1%).[203]
In November 2019, the European Commission expressed concern over the fact that some member states have "failed to put their finances in order." Belgium, France, and Spain had a debt-to-GDP ratio of almost 100% each while Italy's was 136%. Under E.U. rules, member nations must take steps to decrease public debt if it exceeds 60% of GDP. The Commission commended Greece for making progress in economic recovery.[204]
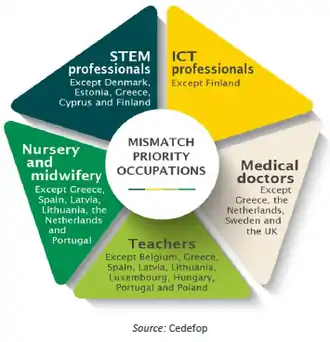
According to the European Centre for the Development of Vocational Training (Cedefop), the European Union in the late 2010s suffers from shortages of STEM specialists (including ICT professionals), medical doctors, nurses, midwives and schoolteachers. However, the picture varies depending on the country. In Italy, environmentally friendly architecture is in high demand. Estonia and France are running short of legal professionals. Ireland, Luxembourg, Hungary, and the United Kingdom need more financial experts. All member states except Finland need more ICT specialists, and all but Belgium, Greece, Spain, Hungary, Latvia, Lithuania, Luxembourg, Portugal and the United Kingdom need more teachers. The supply of STEM graduates has been insufficient because the dropout rate is high and because of an ongoing brain drain from some countries. Some countries need more teachers because many are retiring and need to be replaced. At the same time, Europe's aging population necessitates the expansion of the healthcare sector. Disincentives for (potential) workers in jobs in high demand include low social prestige, low salaries, and stressful work environments. Indeed, many have left the public sector for industry while some STEM graduates have taken non-STEM jobs.[205]
Spanish think-tank Fedea noted that there were not enough young Europeans enrolled in vocational programs that teach them skills favored by the job market. Many new entrants to the workforce lacked the necessary skills demanded by employers.[206]
Even though pundits predicted that the uncertainty due to the Brexit referendum would cause the British economy to falter or even fall into a recession, the unemployment rate has dipped below 4% while real wages have risen slightly in the late 2010s, two percent as of 2019. In particular, medical doctors and dentists saw their earnings bumped above the inflation rate in July 2019. Despite the fact that the government promised to an increase in public spending (£13 billion, or 0.6% of GDP) in September 2019, public deficit continues to decline, as it has since 2010. Nevertheless, uncertainty surrounding Britain's international trade policy suppressed the chances of an export boom despite the depreciation of the pound sterling.[207] According to the employment website Glassdoor, the highest paying entry level jobs in the United Kingdom in 2019 are investment banking analyst, software engineer, business analyst, data scientist, financial analyst, software developer, civil engineer, audit assistant, design engineer, mechanical engineer. Their median base salaries range from about £28,000 to £51,000 a year. In general, people with STEM degrees have the best chances of being recruited into a high-paying job. According to the Office for National Statistics, the median income of the United Kingdom in 2018 was £29,588.[208]
In the United Kingdom, the number of teenagers who owned businesses jumped from 491 in 2009 to 4,152 in 2019. These people primarily use social media platforms to establish their careers.[209]
Due to the strong correlation between economic growth and youth employment, recessions come with dire consequences for young people in the workforce. In the struggling Southern European economies, such as Greece and Spain, youth unemployment lingered on in the aftermath of the Great Recession, remaining stuck at around a third. With another recession induced by the COVID-19 global pandemic, it could rise to about half. Even the Czech Republic, which previously boasted the lowest youth unemployment rate in Europe, at about 5%, could see that number triple in 2020. Overall, European job markets are hostile towards new entrants, who, unlike their older counterparts, do not have permanent contracts and are often the first to be laid off during hard times. E.U. average unemployment has gone up, but youth unemployment went up even more; among workers below the age of 25, it stood at 15.7% in May 2020.[206]
North America

Between 2014 and 2019, Canada's overall unemployment rate fell from about 7% to below 6%, according to the IMF.[199] In 2017, the magazine Canadian Business analyzed publicly available data from Statistics Canada and Employment and Social Development Canada to determine the top occupations on the basis of growth and salaries. They included construction managers, mining and quarry managers, pilots and flying instructors, software engineers, police officers, firefighters, urban planners, petroleum, chemical, agricultural, biomedical, aerospace, and railroad engineers, business services managers, deck officers, corporate sales managers, pharmacists, elevator mechanics, lawyers, economic development directors, real-estate and financial managers, telecommunications managers, utilities managers, pipe-fitting managers, forestry managers, nurse practitioners, and public administration managers.[210] However, in the late 2010s, Canada's oil and gas industry has been in decline due to a lack of political support and unfavorable policies from Ottawa. The number of oil rigs in Western Canada, where most of the country's deposits are located, dropped from 900 in 2014 to 550 in 2019. Many Canadian companies have moved their crew and equipment to the United States, especially to Texas.[211] As the COVID-19 pandemic mauled the Canadian economy, Generation Z was one of the worst affected groups, with 70% being CAN$200 or less away from insolvency, a figure that includes 39% who were already insolvent.[212]
Americans aged 15 to 21 expect to be financially independent in their early twenties while their parents generally expect them to become so by their mid-twenties.[213] While the Millennials tend to prefer flexibility, Generation Z is more interested in certainty and stability.[214] Whereas 23% of Millennials would leave a job if they thought they were not appreciated, only 15% of Generation Z would do the same, according to a Deloitte survey.[215] According to the World Economic Forum (WEF), 77% of Generation Z expects to work harder than previous generations.[216] As a result, barely one in two recruits from Generation Z are willing to negotiate a higher salary, even though, as of 2019, the U.S. labor market is very tight, meaning the balance of power is currently in favor of job seekers, collectively.[217] Indeed, Employers are open to negotiations for higher salaries and better benefits in order to attract talents.[217] While there is agreement across generations that it is very important for employees to learn new skills, Millennials and Generation Z are overwhelmingly more likely than Baby Boomers to think that it is the job of employees to train themselves. Baby Boomers tend to think it is the employer's responsibility. Moreover, Millennials and Generation Z (74%) tend to have more colleagues working remotely for a significant portion of their time compared to the Baby Boomers (58%).[218] An overwhelming majority, 80%, prefers to work for a medium-sized or large company.[216] A Morgan Stanley report, called the Blue Paper, projected that the Millennials and Generation Z have been responsible in a surge in labor participation in the U.S., and that while the U.S. labor force expands, that of other G10 countries will contract. This development alleviates concerns over America's aging population which jeopardizes the solvency of various welfare programs.[219] As of 2019, Millennials and Generation Z account for 38% of the U.S. workforce; that number will rise to 58% in the incoming decade.[218]
According to the United States Department of Labor, the unemployment rate in September 2019 was 3.5%, a number not seen since December 1969.[220] At the same time, labor participation remained steady and most job growth tended to be full-time positions.[220] The number of people who ended up with part-time positions despite looking for full-time jobs dropped to 4.32 million, below the average of the previous three decades.[221] Economists generally consider a population with an unemployment rate lower than 4% to be fully employed. In fact, even people with disabilities or prison records are getting hired.[222] On average, they grew by 2.7% in 2016, 3.3% in 2018,[223] and 3.3% in 2019.[221] However, the Pew Research Center found that the average wage in the U.S. in 2018 remained more or less the same as it was in 1978, when the seasons and inflation are taken into consideration. Real wages grew only for the top 90th percentile of earners and to a lesser extent the 75th percentile (in 2018 dollars).[224] Nevertheless, these developments ease fears of an upcoming recession.[225] Moreover, economists believe that job growth could slow to an average of just 100,000 per month and still be sufficient to keep up with population growth and keep economic recovery going.[223] As long as firms keep hiring and wages keep growing, consumer spending should prevent another recession.[226] Appearing before Congress in November 2019, Chairman of the Federal Reserve Jerome Powell said that while the U.S. economy had taken a long time to recover from the Great Recession, it now enjoyed a strong labor market, low inflation, and moderate growth, and that his agency expected continued economic growth.[227] At the same time, U.S. household debt fell from 90% of GDP in 2010 to 75% in 2019, according to Bank of America.[202]
According to the Bureau of Labor Statistics, the occupations with the highest median annual pay in the United States in 2018 included medical doctors (especially psychiatrists, anesthesiologists, obstetricians and gynecologists, surgeons, and orthodontists), chief executives, dentists, information system managers, chief architects and engineers, pilots and flight engineers, petroleum engineers, and marketing managers. Their median annual pay ranged from about $134,000 (marketing managers) to over $208,000 (aforementioned medical specialties).[228] Meanwhile, the occupations with the fastest projected growth rate between 2018 and 2028 are solar cell and wind turbine technicians, healthcare and medical aides, cyber security experts, statisticians, speech-language pathologists, genetic counselors, mathematicians, operations research analysts, software engineers, forest fire inspectors and prevention specialists, post-secondary health instructors, and phlebotomists. Their projected growth rates are between 23% (medical assistants) and 63% (solar cell installers); their annual median pays range between roughly $24,000 (personal care aides) to over $108,000 (physician assistants).[229] Occupations with the highest projected numbers of jobs added between 2018 and 2028 are healthcare and personal aides, nurses, restaurant workers (including cooks and waiters), software developers, janitors and cleaners, medical assistants, construction workers, freight laborers, marketing researchers and analysts, management analysts, landscapers and groundskeepers, financial managers, tractor and truck drivers, and medical secretaries. The total numbers of jobs added ranges from 881,000 (personal care aides) to 96,400 (medical secretaries). Annual median pays range from over $24,000 (fast-food workers) to about $128,000 (financial managers).[230]
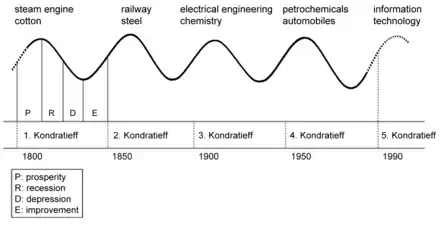
According to the Department of Education, people with technical or vocational trainings are slightly more likely to be employed than those with a bachelor's degree and significantly more likely to be employed in their fields of specialty.[178] The United States currently suffers from a shortage of skilled tradespeople.[178] If nothing is done, this problem will get worse as older workers retire and the market tightens due to falling unemployment rates. Economists argue that raising wages could incentivize more young people to pursue these careers. Many manufacturers are partnering with community colleges to create apprenticeship and training programs. However, they still have an image problem as people perceive manufacturing jobs as unstable, given the mass layoffs during the Great Recession of 2007–8.[231] After the Great Recession, the number of U.S. manufacturing jobs reached a minimum of 11.5 million in February 2010. It rose to 12.8 million in September 2019. It was 14 million in March 2007.[232] As of 2019, manufacturing industries made up 12% of the U.S. economy, which is increasingly reliant on service industries, as is the case for other advanced economies around the world.[233] Nevertheless, twenty-first-century manufacturing is increasingly sophisticated, using advanced robotics, 3D printing, cloud computing, among other modern technologies, and technologically savvy employees are precisely who employers need. Four-year university degrees are unnecessary; technical or vocational training, or perhaps apprenticeships would do.[234]
Quantitative historian Peter Turchin observed that demand for labor in the United States had been stagnant since 2000 and would likely continue to 2020 as the nation went through the negative part of the Kondratiev wave. (See above.) Moreover, the share of people in their 20s continued to grow till the end of the 2010s according projections by the U.S. Census Bureau, meaning the youth bulge would likely not fade away before the 2020s. As such the gap between the supply and demand in the labor market would likely not fall before then, and falling or stagnant wages generate sociopolitical stress.[235]
South America
Unlike some major economies, unemployment actually increased in Brazil, from about 6.7% in 2014 to about 11.4% in 2018. Although its economy remains growing, it is still recovering from a recession in 2015 and 2016. Wages have remained stagnant and the labor market has been weak.[199] Unemployment rose to 12.7% in March 2019, or about 13.4 million people. Underemployment also increased in the first quarter of 2019.[236]
Health issues
Mental
A 2020 meta-analysis found that the most common psychiatric disorders among adolescents were ADHD, anxiety disorders, behavioral disorders, and depression, consistent with a previous one from 2015.[32]
According to the OECD PISA surveys, 15-year-olds in 2015 had a tougher time making friends at school than ten years prior. European teenagers were becoming more and more like their Japanese and South Korean counterparts in social isolation. This might be due to intrusive parenting, heavy use of electronic devices, and concerns over academic performance and job prospects.[10]

Sleep deprivation is on the rise among contemporary youths,[237][29] thanks to a combination of poor sleep hygiene (having one's sleep disrupted by noise, light, and electronic devices), caffeine intake, beds that are too warm, a mismatch between biologically preferred sleep schedules at around puberty and social demands, insomnia, growing homework load, having too many extracurricular activities.[29][30] Consequences of sleep deprivation include low mood, worse emotional regulation, anxiety, depression, increased likelihood of self-harm, suicidal ideation, and impaired cognitive functioning.[29][30] In addition, teenagers and young adults who prefer to stay up late tend to have high levels of anxiety, impulsivity, alcohol intake, and tobacco smoking.[238]
A study by Glasgow University found that the number of schoolchildren in Scotland reporting sleep difficulties increased from 23% in 2014 to 30% in 2018. 37% of teenagers were deemed to have low mood (33% males and 41% females), and 14% were at risk of depression (11% males and 17% females). Older girls faced high pressure from schoolwork, friendships, family, career preparation, maintaining a good body image and good health.[239] Data from the British National Health Service (NHS) showed that between 1999 and 2017, the number children below the age of 16 suffering from at least one mental disorder increased from 11.4% to 13.6%. Researcher interviewed older adolescents (aged 17–19) for the first time in 2017 and found that girls were two thirds more likely than younger girls and twice more likely than boys from the same age group to suffer from a mental disorder. In England, hospitalizations for self-harm doubled among teenage girls between 1997 and 2018, but there was no parallel development among boys. While the number of children receiving medical attention for mental health problems has clearly gone up, this is not necessarily an epidemic as the number of self-reports went up even faster possibly due to the diminution of stigma. Furthermore, doctors are more likely than before to diagnose a case of self-harm when previously they only treated the physical injuries.[28]
In Canada, teenagers sleep on average between 6.5 and 7.5 hours each night, much less than what the Canadian Paediatric Society recommends, 10 hours.[240] According to the Canadian Mental Health Association, only one out of five children who needed mental health services received it. In Ontario, for instance, the number of teenagers getting medical treatment for self-harm doubled in 2019 compared to ten years prior. The number of suicides has also gone up. Various factors that increased youth anxiety and depression include over-parenting, perfectionism (especially with regards to schoolwork), social isolation, social-media use, financial problems, housing worries, and concern over some global issues such as climate change.[241]
In the United States, the number of teenagers who suffered from the classic symptoms of depression rose 33% between 2010 and 2015. During the same period, the number of those aged 13 to 21 who committed suicide jumped 31%. Psychologist Jean Twenge and her colleagues found that this growth of mental health issues was not divided along the lines of socioeconomic class, race/ethnicity, or geographical location. Rather, it was associated with spending more time in front of a screen. In general, suicide risk factors—depression, contemplating, planning, and attempting suicide—increase significantly if the subject spends more than two to three hours online. Especially, those who spent five or more hours had their suicide risk factors increase 71%. It is not clear, however, whether depression causes a teenager to spend more time online or the other way around. At the same time, teens who spent more time online were more likely to not have enough sleep, a major predictor of depression.[242] Many teenagers told researchers they used a smartphone or a tablet right before bed, kept the device close, and used it as an alarm clock. But the blue light emitted by these devices, texting, and social networking are known for perturbing sleep. Besides mental problems like depression and anxiety, sleep deprivation is also linked to reduced performance in school and obesity. Parents can address the problem of sleep deprivation simply by imposing limits on screen time and buying simple alarm clocks.[6]
Research from the American Academy of Pediatrics analyzing responses from the parents of caregivers of 49,050 children aged six to seventeen in the combined 2016-2017 National Survey of Children's Health revealed that only 47.6% of American children slept for nine hours one most days, meaning a significant number was sleep deprived. Compared with children who did not get enough sleep most nights, those who did were 44% more likely to be curious about new things, 33% more likely to finish their homework, 28% more likely to care about their academic performance, and 14% more likely to finish the tasks they started. The researchers identified the risk factors associated with sleep deprivation among children to be the low educational attainment of parents or caregivers, being from families living below the federal poverty line, higher digital media usage, more negative childhood experiences, and mental illnesses.[243]
In a 2019 study, Twenge and her collaborators examined surveys from the National Survey on Drug Use and Health of 200,000 adolescents aged 13 to 17 from 2005 to 2017 and 400,000 adults aged 18 and over from 2008 to 2017. They found that while there was a marked increase in the number of teenagers and young adults reporting mental illness, there was no corresponding development among those of 26 years and up.[27]
Physical
Multidisciplinary research in the early twenty-first century suggests that ongoing human evolution could help explain the rise of certain medical conditions such as autism and autoimmune disorders among children. Autism and schizophrenia may be due to genes inherited from the mother and the father that are over-expressed and that fight a tug-of-war in the child's body. Allergies, asthma, and autoimmune disorders appear linked to higher standards of sanitation, which prevent the immune systems of modern humans from being exposed to various parasites and pathogens the way their ancestors' were, making them hypersensitive and more likely to overreact. The human body is not built from a professionally engineered blueprint, but rather is a system shaped over long periods of time by evolution with all kinds of trade-offs and imperfections. Understanding the evolution of the human body can help medical doctors better understand and treat various disorders. Research in evolutionary medicine suggests that diseases are prevalent because natural selection favors reproduction over health and longevity. In addition, biological evolution is slower than cultural evolution and humans evolve more slowly than pathogens.[244]

A 2015 study found that the frequency of nearsightedness has doubled in the United Kingdom within the last 50 years. Ophthalmologist Steve Schallhorn, chairman of the Optical Express International Medical Advisory Board, noted that research have pointed to a link between the regular use of handheld electronic devices and eyestrain. The American Optometric Association sounded the alarm on a similar vein.[245] According to a spokeswoman, digital eyestrain, or computer vision syndrome, is "rampant, especially as we move toward smaller devices and the prominence of devices increase in our everyday lives." Symptoms include dry and irritated eyes, fatigue, eye strain, blurry vision, difficulty focusing, headaches. However, the syndrome does not cause vision loss or any other permanent damage. In order to alleviate or prevent eyestrain, the Vision Council recommends that people limit screen time, take frequent breaks, adjust screen brightness, change the background from bright colors to gray, increase text sizes, and blinking more often. Parents should not only limit their children's screen time but should also lead by example.[246]
While food allergies have been observed by doctors since ancient times and virtually all foods can be allergens, research by the Mayo Clinic in Minnesota found they are becoming increasingly common since the early 2000s. Today, one in twelve American children has a food allergy, with peanut allergy being the most prevalent type. Reasons for this remain poorly understood.[25] Nut allergies in general have quadrupled and shellfish allergies have increased 40% between 2004 and 2019. In all, about 36% of American children have some kind of allergy. By comparison, this number among the Amish in Indiana is 7%. Allergies have also risen ominously in other Western countries. In the United Kingdom, for example, the number of children hospitalized for allergic reactions increased by a factor of five between 1990 and the late 2010s, as did the number of British children allergic to peanuts. In general, the better developed the country, the higher the rates of allergies.[26] Reasons for this remain poorly understood.[25] One possible explanation, supported by the U.S. National Institute of Allergy and Infectious Diseases, is that parents keep their children "too clean for their own good." They recommend exposing newborn babies to a variety of potentially allergenic foods, such as peanut butter, before they reach the age of six months. According to this "hygiene hypothesis," such exposures give the infant's immune system some exercise, making it less likely to overreact. Evidence for this includes the fact that children living on a farm are consistently less likely to be allergic than their counterparts who are raised in the city, and that children born in a developed country to parents who immigrated from developing nations are more likely to be allergic than their parents are.[26]
A research article published in 2019 in the Lancet journal reported that the number of South Africans aged 15 to 19 being treated for HIV increased by a factor of ten between 2019 and 2010. This is partly due to improved detection and treatment programs. However, less than 50% of the people diagnosed with HIV went onto receive antiviral medication due to social stigma, concerns about clinical confidentiality, and domestic responsibilities. While the annual number of deaths worldwide due to HIV/AIDS has declined from its peak in the early 2000s, experts warned that this venereal disease could rebound if the world's booming adolescent population is left unprotected.[247]
Data from the Australian Bureau of Statistics reveal that 46% of Australians aged 18 to 24, about a million people, were overweight in 2017 and 2018. That number was 39% in 2014 and 2015. Obese individuals face higher risks of type II diabetes, heart disease, osteoarthritis and stroke. The Australian Medical Associated and Obesity Coalition have urged the federal government to levy a tax on sugary drinks, to require health ratings, and to regulate the advertisement of fast foods. In all, the number of Australian adults who are overweight or obese rose from 63% in 2014–15 to 67% in 2017–18.[248]
Puberty
In Europe and the United States, the average age of the onset of puberty among girls was around 13 in the early twenty-first century, down from about 16 a hundred years earlier. Early puberty is associated with a variety of mental health issues—such as anxiety and depression, as people at this age tend to strongly desire conformity with their peers—,early sexual activity, substance abuse, tobacco smoking, eating disorders, and disruptive behavioral disorders.[20] Girls who mature early also face higher risks of sexual harassment. Moreover, in some cultures, pubertal onset remains a marker of readiness for marriage, for, in their point of view, a girl who shows signs of puberty might engage in sexual intercourse or risks being assaulted, and marrying her off is how she might be 'protected'.[22] To compound matters, factors known for prompting mental health problems are themselves linked to early pubertal onset; these are early childhood stress, absent fathers, domestic conflict, and low socioeconomic status. Possible causes of early puberty could be positive, namely improved nutrition, or negative, such as obesity and stress.[20] Other triggers include genetic factors, high body-mass index (BMI), exposure to endocrine-disrupting substances that remain in use, such as Bisphenol A (found in some plastics) and dichlorobenzene (used in mothballs and air deodorants), and to banned but persistent chemicals, such as dichlorodiphenyl-trichloroethane (DDT) and dichlorodiphenyldichloroethylene (DDE), and perhaps a combination thereof (the 'cocktail effect').[21][249]
A 2019 meta-analysis and review of the research literature from all inhabited continents found that between 1977 and 2013, the age of pubertal onset among girls has fallen by an average of almost three months per decade, but with significant regional variations, ranging from 10.1 to 13.2 years in Africa to 8.8 to 10.3 years in the United States. This investigation relies on measurements of thelarche (initiation of breast tissue development) using the Tanner scale rather than self-reported menarche (first menstruation) and MRI brain scans for signs of the hypothalamic-pituitary-gonadal axis being reactivated.[21] Furthermore, there is evidence that sexual maturity and psychosocial maturity no longer coincide; twenty-first-century youths appear to be reaching the former before the latter. Neither adolescents nor societies are prepared for this mismatch.[23][24][note 1]
In the United States, African girls on average enter puberty first, followed by those of Hispanic, European, and Asian extraction, in that order. But African-American girls are less likely to face the negative effects of puberty than their counterparts of European descent.[20]
Unlike the case of girls, pubertal onset in boys is more difficult to determine and study, though the literature suggests that boys, too, are reaching puberty earlier than their predecessors.[20] In 2012, the American Academy of Pediatrics reported that American boys were reaching puberty between six months to two years earlier than a few decades before, with Africans entering that stage the soonest, at around nine years of age, followed by Caucasians and Hispanics, at about ten.[249]
Political views and participation
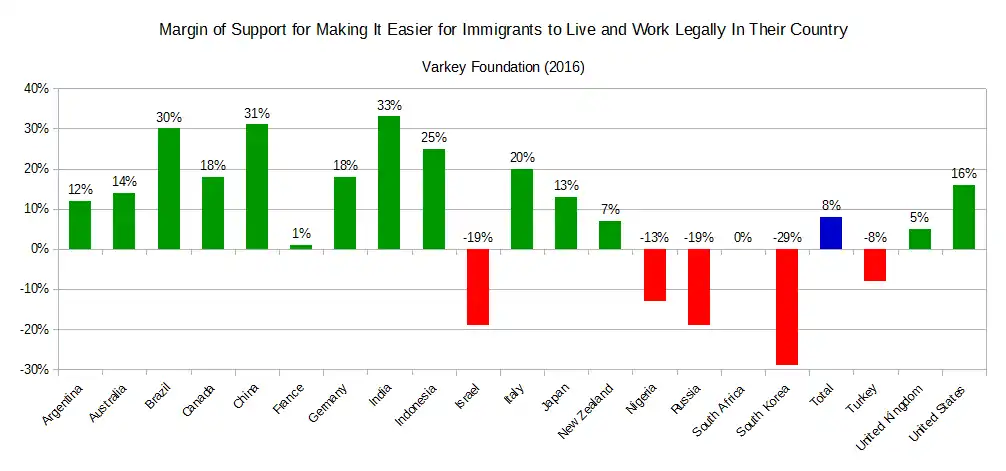
In 2016, the Varkey Foundation and Populus conducted an international study examining the attitudes of 20,000 people aged 15 to 21 in twenty countries: Argentina, Australia, Brazil, Canada, China, France, Germany, India, Indonesia, Israel, Italy, Japan, New Zealand, Nigeria, Russia, South Africa, South Korea, Turkey, the U.K, and the U.S.A. They found that young people's support for free speech dwindled if it was deemed offensive to a religion (56%) or a minority group (49%). The question of whether or not they favored legal migration received mixed responses, with 27% saying 'yes' in France, 31% in the U.K., 37% in Germany, and 38% in Italy and the U.S.[250] Overall, 31% believed their governments should make it easier for immigrants to work and live legally in their countries while 23% said it should be more difficult, a margin of 8%. (See chart above.)[84] While 72% of Brazilian youths thought their government was doing too little to address the international refugee crisis, only 16% of young Turks did; in the U.K. that number was 48%. Overall, their top concerns for the future included extremism and terrorism (83%), war (81%), the widening gap between the rich and the poor (69%), the lack of access to education (69%), climate change (63%), and the risk of a global pandemic (62%).[250]
.png.webp)
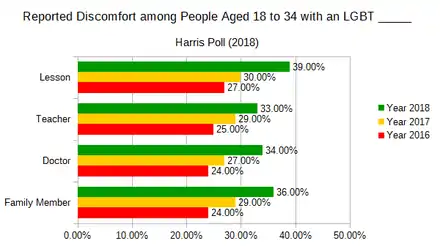
The same international survey also asked about people's viewpoints on moral questions regarding sex and gender. Overall 89% supported sexual equality, with support being the highest in Canada and China (both 94%), and the lowest in Japan (74%) and Nigeria (68%). 74% favored recognizing transgender rights, but with large national differences, from an overwhelming majority of 83% in Canada to a bare majority of 57% in Nigeria. 63% approved of same-sex marriage. There were again huge variations among countries. 81% of young Germans and 80% of young Canadians agreed that same-sex couples should be allowed to marry, compared to only 33% of young Turks and 16% of young Nigerians who did.[250][84] A 2018 poll conducted by Harris on behalf of the LGBT advocacy group GLAAD found that despite being frequently described as the most tolerant segment of society, Americans aged 18 to 34—most Millennials and the oldest members of Generation Z—have become less accepting LGBT individuals compared to previous years. In 2016, 63% of Americans in that age group said they felt comfortable interacting with members of the LGBT community; that number dropped to 53% in 2017 and then to 45% in 2018. On top of that, more people reported discomfort learning that a family member was LGBT (from 29% in 2017 to 36% in 2018), having a child learning LGBT history (30% to 39%), or having an LGBT doctor (27% to 34%). Harris found that young women were driving this development; their overall comfort levels dived from 64% in 2017 to 52% in 2018. In general, the fall of comfort levels was the steepest among people aged 18 to 34 between 2016 and 2018. (Seniors aged 72 or above became more accepting of LGBT doctors and having their (grand) children taking LGBT history lessons during the same period, albeit with a bump in discomfort levels in 2017.)[251] Results from this Harris poll were released on the 50th anniversary of the riots that broke out in Stonewall Inn,[251] New York City, in June 1969, thought to be the start of the LGBT rights movement.[252] At that time, homosexuality was considered a mental illness or a crime in many U.S. states.[252]
.png.webp)
The aforementioned international survey by the Varkey Foundation showed that 66% of people aged 15 to 21 favored legal abortion. But there was significant variation among the countries surveyed. Support for this procedure was strongest in France (84%), the United Kingdom (80%), and Canada (79%), but lowest in Argentina (50%), Brazil (45%), and Nigeria (24%). (See chart above.) (As of 2016, it remained illegal in Nigeria.)[84] Gallup polls conducted in 2019 in the U.S. revealed that 62% of people aged 18 to 29—older members of Generation Z and younger Millennials—support giving women access to abortion while 33% opposed. In general, the older someone was, the less likely that they supported abortion. 56% of people aged 65 or over did not approve of abortion compared to 37% who did. (See chart to the right.) Gallup found in 2018 that nationwide, Americans were split on the issue of abortion, with equal numbers of people considering themselves "pro-life" or "pro-choice", 48%.[253] Goldman Sachs analysts Robert Boroujerdi and Christopher Wolf described Generation Z as "more conservative, more money-oriented, more entrepreneurial and pragmatic about money compared with Millennials."[254] In 2018, the International Federation of Accountants released a report on a survey of 3,388 individuals aged 18 to 23 hailing from G20 countries, with a sample size of 150 to 300 per country. They found that members of Generation Z prefer a nationalist to a globalist approach to public policy by a clear margin, 51% to 32%. Nationalism was strongest in China (by a 44% margin), India (30%), South Africa (37%), and Russia (32%), while support for globalism was strongest in France (20% margin) and Germany (3%). In general, for members of Generation Z, the top three priorities for public policy are the stability of the national economy, the quality of education, and the availability of jobs; the bottom issues, on the other hand, were addressing income and wealth inequality, making regulations smarter and more effective, and improving the effectiveness of international taxation. Moreover, healthcare is a top priority for Generation Z in Canada, France, Germany, and the United States. Addressing climate change is very important for Generation Z in India, and South Korea, and tackling wealth and income inequality is of vital importance to the same in Indonesia, Saudi Arabia, and Turkey.[255]
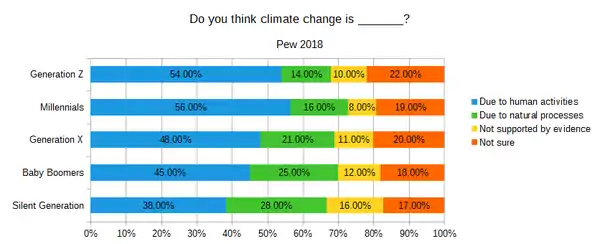
2018 surveys of American teenagers 13 to 17 and adults aged 18 or over conducted by the Pew Research Center found that Generation Z had broadly similar views to the Millennials on various political and social issues. More specifically, 54% of Generation Z believed that climate change is real and is due to human activities while only 10% reject the scientific consensus on climate change. (See chart.) 70% wanted the government to play a more active role in solving their problems. 67% were indifferent towards pre-nuptial cohabitation. 49% considered single motherhood to be neither a positive or a negative for society. 62% saw increased ethnic or racial diversity as good for society. As did 48% for same-sex marriage, and 53% for interracial marriage. In most cases, Generation Z and the Millennials tended hold quite different views from the Silent Generation, with the Baby Boomers and Generation X in between. In the case of financial responsibility in a two-parent household, though, majorities from across the generations answered that it should be shared, with 58% for the Silent Generation, 73% for the Baby Boomers, 78% for Generation X, and 79% for both the Millennials and Generation Z. Across all the generations surveyed, at least 84% thought that both parents ought to be responsible for rearing children. About 13% of Generation Z thought that mothers should be the primary caretaker of children, with similar percentages for the other demographic cohorts. Very few thought that fathers should be the ones mainly responsible for taking care of children.[256]
In a study conducted in 2015 the Center for Generational Kinetics found that American Generation Zers, defined here as those born 1996 and onwards, are less optimistic about the state of the US economy than their generation predecessors, Millennials.[257]
Despite reports of a surge in turnouts among young voters in the 2015 and 2017 United Kingdom general elections, statistical scrutiny by the British Elections Study revealed that the margin of error was too large to determine whether or not there was a significant increase or decrease in the number of young participants. In both cases, turnouts among those aged 18 to 24 was between 40% and 50%. Winning the support of young people does not necessarily translate to increasing young voters' turnouts,[258] and positive reactions on social media may not lead to success at the ballot box.[259] Initial reports of a youth surge came from constituency-level survey data, which has a strong chance of over-representing voters rather than the Kingdom as a whole. In addition, higher turnouts generally came from constituencies where there were already large proportions of young people, both toddlers and young adults, and such surges did not necessarily come from young voters. In 2017, there was indeed an increase in overall voter turnout, but only by 2.5%.[258] Similarly, in the United States, despite the hype surrounding the political engagement and record turnout among young voters, their voting power has actually declined. In round terms, the share of voters between the ages of 18 and 24 will fall from 13% in 2000 to 12% in 2020 while that of voters aged 65 and over will rise from 18% to 23% during the same period, according to Richard Fry of the Pew Research Center.[146] A consistent trend in the U.K. and many other countries is that older people are more likely to vote than their younger countrymen, and they tend to vote for more right-leaning (or conservative) candidates.[258][259][146] This is a consistent trend since after the Second World War.[260] According to Sean Simpsons of Ipsos, people are more likely to vote when they have more at stake, such as children to raise, homes to maintain, and income taxes to pay.[261] Political scientist George Tilley notes that in the United Kingdom, while older people tend to vote for the Conservative Party, young people tend to choose the Labour Party, the Liberal Democratic Party, or the Green Party. He suggests that this generational gap is due to the fact that today's youths grew up in a completely different sociopolitical environments from their parents and grandparents and are more likely to have university experience, well known for making people socially liberal.[260]
A 2017 survey produced by MTV and the Public Religion Research Institute found that 72% of Americans aged 15 to 24 held unfavorable views of President Donald Trump.[262][263] In a 2016 poll of Gen Z-aged students by the Hispanic Heritage Foundation, 32% of participants supported Donald Trump, while 22% supported Hillary Clinton with 31% declining to choose.[264] By contrast, in a 2016 mock election of upper elementary, middle, and high school students conducted by Houghton Mifflin Harcourt, Hillary Clinton beat Donald Trump among the students, with Clinton receiving 46% of the vote, Donald Trump receiving 41%, and other candidates receiving 12%.[265]

The March for Our Lives was a 2018 demonstration demanding stricter gun-control legislation following the Stoneman Douglas High School shooting.[266] An opinion piece titled "Dear National Rifle Association: We Won't Let You Win, From, Teenagers" published in March 2018 in The New York Times describes Generation Z as the generation after Millennials who will "not forget the elected officials who turned their backs on their duty to protect children."[267][268] However, according to a field survey by The Washington Post interviewing every fifth person at the protest, only ten percent of the participants were 18 years of age or younger. Meanwhile, the adult participants of the protest had an average age of just under 49.[269] Polls conducted by Gallup and the Pew Research Center found that support for stricter gun laws among people aged 18 to 29 and 18 to 36, respectively, is statistically no different from that of the general population. According to Gallup, 57% of Americans are in favor of stronger gun control legislation.[270] In a 2017 poll, Pew found that among the age group 18 to 29, 27% personally owned a gun and 16% lived with a gun owner, for a total of 43% living in a household with at least one gun. Nationwide, a similar percentage of American adults lived in a household with a gun. (See chart.)[271]
A YouGov poll conducted in the spring of 2018 revealed that 41% of Britons between the ages of 18 to 24 thought that immigration to their country was "too high," compared to 58% of those 25 and 49.[272] Another YouGov 2018 poll asked British voters whether leaving the European Union was a good idea in hindsight. They found that 42% said yes while 45% said no. Among them, 19% of those between the ages of 18 to 24 said yes, as did 61% of pensioners. Overall the British public has not changed their minds on the issue.[273]
By analyzing voter data, political scientists Roger Eatwell and Matthew Goodwin came to the conclusion that the popular narrative that the rise of national-populist movements seen across much of the Western world is due largely to angry old white men who would soon be demographically displaced by younger and more liberal voters is flawed. In many European democracies, national-populist politicians and political parties tend to be the most popular among voters below the age of 40. In France, Marine Le Pen and her National Rally (formerly the National Front) won more votes from people between the ages of 18 and 35 during the first round of the 2017 Presidential election than any other candidates. Moreover, the share of women aged 18 to 26 who backed the Le Pen political family rose from 9% in 1988 to 32% in 2017, closing the gender gap in the process. In Italy, Matteo Salvini and his League have a base of support with virtually no generational gap. In Austria, more than one in two men between the ages of 18 and 29 voted for the Freedom Party in 2016. The Sweden Democrats were the second most popular political party for voters aged 18 to 24 and the most popular for the 35 and 54 in 2018.[272]
The year of 2020 marks the entry of Generation Z into the Brazilian electoral race, with the youngest group being between 18 and 20 years old.[274]
Religious tendencies
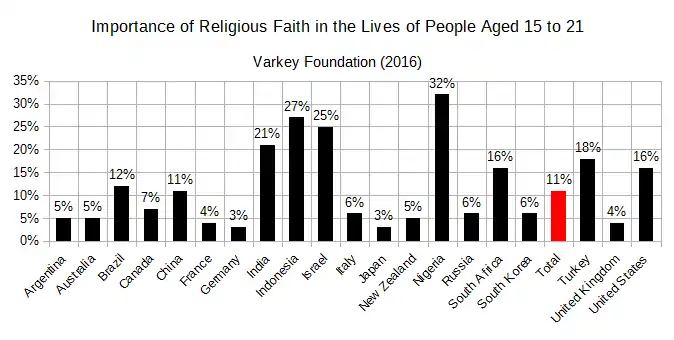
A 2016 survey by Varkey Foundation and Populus conducted on 20,000 people aged 15 to 21 from twenty countries from all inhabited continents revealed that religious faith was influential to 42% of the respondents and inconsequential to 39%. There was, however, a clear difference along the age subgroups, with people 15-16 slightly more likely to value religion as important than those aged 19–21 (47% vs. 43%). Nevertheless, for 53%, religion influenced the values they hold. In order to further determine the role of religion in young people's lives, the pollsters asked them (1) whether or not it was important to them personally, (2) to their parents, (3) whether their parents' religion determined whom they would marry, and (4) if religion helps them decide whether to be friends with someone. Overall, religion was important to 11% of respondents. But there was a large gap among countries with Nigeria at one end (32%) and Germany and Japan on the other (3%). (See above.)[84]
The 2016 British Social Attitudes Survey found that 71% of people between the ages of 18 and 24 had no religion, compared to 62% the year before. A 2018 ComRes survey found that slightly more than one in two of those aged 18 to 24 reported a positive experience with Christians and Christianity. Two-thirds of the same age group have never attended church; among the remaining third, 20% went a few times a year, and 2% multiple times per week. 12% of respondents aged 18 to 24 agreed with the claim that Christians were a bad influence on society, compared to just over half who disagreed. For comparison, 14% of those aged 25 to 34 agreed. In all, 51% of Britons disagreed with the same while 10% agreed. Results from the 2018 the ComRes survey were released a day after the Church of England announced it was going to establish more than a hundred churches, mainly in urban areas, to attract new followers.[275]
.png.webp)
A 2016 U.S. study found that church attendance during young adulthood was 41% among Generation Z, compared to 18% for Millennials, 21% of Generation X, and 26% of the Baby Boomers when they were at the same age.[276] A 2016 survey by Barna and Impact 360 Institute on about 1,500 Americans aged 13 and up suggests that the percentage of atheists and agnostics was 21% among Generation Z, compared to 15% for Millennials, 13% for Generation X, and 9% for Baby Boomers. 59% of Generation Z were Christians (including Catholics), compared to 65% for the Millennials, 65% for Generation X, and 75% for the Baby Boomers. Researchers also asked over 600 non-Christian teenagers and almost 500 adults what their biggest barriers to faith were. They found that for Generation Z, these were what they perceived as internal contradictions of the religion and its believers, yet only six percent reported an unpleasant personal experience with a Christian or at church. Indeed, perception of this establishment tended to be overwhelmingly positive. 82% believed the church was relevant and helped them live a meaningful life. 77% thought they could be themselves at church, and 63% deemed the church to be tolerant of different beliefs. Only 27% considered the church to be unsafe for expressing doubts. 24% argued that religion and religious thought were shallow, and 17% thought it was too exclusive. 46% of adolescents require factual evidence before believing in something, on par with Millennials. 41% of teens believed that science and the Bible are fundamentally at odds with one another, with 27% taking the side of science and 17% picking religion. For comparison, 45% of Millennials, 34% of Generation X, and 29% of the Baby Boomers believed such a conflict exists. 31% of Generation Z believed that science and religion refer to different aspects of reality, on par with Millennials and Generation X (both 30%), and above the Baby Boomers (25%). 28% of Generation Z thought that science and religion are complementary, compared to 25% of Millennials, 36% of Generation X, and 45% for Baby Boomers.[277]
Globally, religion is in decline in North America and Western Europe, but is growing in the rest of the world.[278] Although the number of atheists, agnostics, and people not affiliated with organized religion continues to grow in Europe and the United States, their percentage of the world population is falling because of their comparatively low fertility rate (1.7).[279] In general, the growth or decline of a given religion is due more to age and fertility rather than conversion.[278][128] Besides the level of education and income, how religious a woman is determines how many children she will bear in her lifetime. For example, in the cities of the Middle East, women who supported Sharia law had a 50% fertility advantage over those who opposed it the most at the turn of the century.[128] According to the World Religious Database, the proportion of the human population identifying with a religion increased from 81% in 1970 to 85% in 2000 and is predicted to rise to 87% in 2025. In addition, the Catholic Church has gained 12% additional followers between 2000 and 2010, mainly from Asia and Africa.[128] In 2018, Muslims had a median age of 23, Hindus 26, Christians 30, Buddhists and the religiously unaffiliated 34, and Jews 36. For comparison, the median age of the global population was 28 in 2018. Overall, Christians have a fertility rate of 2.6, and Muslims 2.9. Islam is the world's fastest growing religion.[278] Meanwhile, the expansion of secularism will slow in Europe as the twenty-first century progresses.[128]
But religion can grow even in otherwise secular societies.[128] For example, in Israel, the ultra-Orthodox Jews comprised just about five percent of the nation's primary schoolchildren in 1960, but by the start of the twenty-first century, one third of Jewish first graders in Israel came from this religious sect.[127] Ultra-Orthodox Jewish women in Israel had on average 7.5 children compared to their more mainstream counterparts with just over two in the early 2000s.[128] In Europe, immigration from the Middle East and Africa is an engine of religious growth. Children of immigrants tend to be about as religious as their parents and consider their religion to be a marker of their ethnic identity, thereby insulating themselves from the secularizing forces of the host society. The other engine is comparatively high fertility and religious endogamy. In France, a white Catholic woman had half a child more than her secular counterparts in the early 2000s; in Spain, that number was 0.77.[128] In the Netherlands, the youngest villages belong to Orthodox Calvinists,[128] who comprised 7% of the Dutch population by the early 2000s.[127] In Austria, the number of people below the age of 15 who were Muslims rose past the 10%-mark in the first decade of the twenty-first century. In the United Kingdom, over 90% of Muslims married other Muslims by the turn of the millennium, and it is well known that children born into an interfaith marriage tend to be less religious than their parents. Interfaith marriage is in fact a vehicle of secularization.[128] Ultra-Orthodox Jews comprised just 12% of the British Jewish population but three quarters of Jewish births at the start of the twenty-first century. (This group is projected to make up the majority of Anglo-American Jews by 2050.)[127] In the United States, Catholicism will become the largest religion by 2040 despite considerable losses to secularization and conversion to Protestantism thanks in no small part to the fact that Latino Catholics had a fertility rate of 2.83 compared to the national average of 2.03 in 2003. Such religious demographic changes will bring about social and political ramifications later in the century.[128]
Risky behaviors
Generation Z is generally more risk-averse in certain activities than earlier generations. In 2013, 66% of American teenagers (older members of Generation Z) had tried alcohol, down from 82% in 1991 (younger Generation X). Also, in 2013, 8% of teenagers never or rarely wore a seat belt when riding in a car with someone else, as opposed to 26% in 1991.[3] Research from the Annie E. Casey Foundation conducted in 2016 found Generation Z youth had lower teen pregnancy rates, less substance abuse, and higher on-time high school graduation rates compared with Millennials. The researchers compared teens from 2008 and 2014 and found a 40% drop in teen pregnancy, a 28% drop in the percentage of teens who did not graduate on time from high school, and a 38% drop in drug and alcohol abuse.[280][281] Three quarters of American twelfth-graders believed their peers disapproved of binge drinking.[14] American adolescents maintained their abstinence from alcohol and sexual intercourse through early adulthood.[10]
In fact, adolescent pregnancy was in decline during the early twenty-first century all across the industrialized world thanks to the widespread availability of contraception and the growing avoidance of sexual intercourse among teenagers. In New Zealand, the pregnancy rate for females aged 15 to 19 dropped from 33 per 1,000 in 2008 to 16 in 2016. Highly urbanized regions had adolescent pregnancy rates well below the national average whereas Maori communities had much higher than average rates. In Australia, it was 15 per 1,000 in 2015.[282]
2020 data from the U.K. Office for National Statistics (ONS) showed on a per-capita basis, members of Generation Z binged on alcohol 20% less often than Millennials. However, 9.9% of people aged 16 to 24 consumed at least one drug in the past month, usually cannabis, or more than twice the share of the population between the ages of 16 and 59. "Cannabis has now taken over from the opiates in terms of the most people in treatment for addiction," psychopharmacologist Val Curran of the University College London (UCL) told The Telegraph. Moreover, the quality and affordability of various addictive drugs have improved in recent years, making them an appealing alternative to alcoholic beverages for many young people, who now have the ability to arrange a meeting with a deal via social media. Addiction psychiatrist Adam Winstock of UCL found using his Global Drug Survey that young people rated cocaine more highly than alcohol on the basis of value for money, 4.8 compared to 4.7 out of 10.[15]
As of 2019, cannabis was legal for both medical and recreational use in Uruguay, Canada, and 33 U.S. states.[283] In the United States, Generation Z is the first to be born into a time when the legalization of marijuana at the federal level is being seriously considered.[284] While adolescents (people aged 12 to 17) in the late 2010s were more likely to avoid both alcohol and marijuana compared to their predecessors from 20 years before, college-aged youths are more likely than their elders to consume marijuana.[14] Shortly before the full legalization of marijuana, the Government of Canada commissioned a study from health-policy analyst Fiona Clement and her colleagues at the University of Calgary in order to guide their regulations of the substance. After surveying the literature, Clement and her team found that pregnant women, teenagers, and people prone to mental illnesses are especially vulnerable to the negative effects of marijuana usage, including, among other things, impaired driving, higher risks of stroke testicular cancer, memory loss, and certain mental illnesses, such as psychosis. Compared to those who do not use cannabis or those who start after they reach 16 years, people who start before that age suffer from reduced cognitive functioning (including planning and decision-making skills), and higher levels of impulsivity.[283] According to the U.S. National Institute on Drug Abuse, heavy use of marijuana is linked to low life satisfaction, mental health issues, and relationship problems; second-hand smoke could harm children and people with asthma. Heavy use is also correlated with schizophrenia, but a causal link has not been established. About one in ten marijuana users developed a substance use disorder, meaning they continue to use it even though it causes problems in their lives, and those who use it before the age of 18 are more likely to suffer from it.[285] A 2016 analysis of two longitudinal studies of twins ( and ) reveals a noticeable decline in crystallized intelligence between pre-adolescence and late adolescence among marijuana smokers but no significant effects on IQ, as those can be attributed to other factors, namely genetics and familial environments conducive to low intellectual achievement and marijuana use initiation.[286]


During the 2010s, when most of Generation Z experienced some or all of their adolescence, reductions in youth crime were seen in some Western countries. A report looking at statistics from 2018 to 2019 noted that the numbers of young people aged ten to seventeen in England and Wales being cautioned or sentenced for criminal activity had fallen by 83% over the previous decade, while those entering the youth justice system for the first time had fallen by 85%.[287] In 2006, 3,000 youths in England and Wales were detained for criminal activity; ten years later, that number fell below 1,000.[10] In Europe, teenagers were less likely to fight than before.[10] Research from Australia suggested that crime rates among adolescents had consistently declined between 2010 and 2019.[288] In a 2014 report, Statistics Canada stated that police-reported crimes committed by persons between the ages of 12 and 17 had been falling steadily since 2006 as part of a larger trend of decline from a peak in 1991. Between 2000 and 2014, youth crimes plummeted 42%, above the drop for overall crime of 34%. In fact, between the late 2000s and mid-2010s, the fall was especially rapid. This was primarily driven by a 51% drop in theft of items worth no more than CAN$5,000 and burglary. The most common types of crime committed by Canadian adolescents were theft and violence. At school, the most frequent offenses were possession of cannabis, common assault, and uttering threats. Overall, although they made up only 7% of the population, adolescents stood accused of 13% of all crimes in Canada. In addition, mid- to late-teens were more likely to be accused of crimes than any other age group in the country.[289]
A 2020 report by the British Board of Film Classification (BBFC)—available only by request due to the presence of graphic materials—suggests that parents are either in denial or are completely oblivious to the prevalence of pornography viewership by adolescents, with three quarters telling researchers they do not believe their children consumed such materials. Meanwhile, teenagers are increasingly turning to pornography as a source of information on sexuality, especially what do to during a sexual encounter, as teachers tend to focus on contraception. Over half of the teenagers interviewed told researchers they had viewed pornography, though the actual number might be higher due to the sensitivity of this topic. While parents generally believe adolescents who view pornography for pleasure tend to be boys, the surveys and interviews reveal that this behavior is also common among girls. Most teenagers encounter pornography on a dedicated website, but an increasing number watches it on social media platforms such as Snapchat and WhatsApp. Many told researchers they felt anxious about their body image and the expectations of their potential sexual partners as a result of viewing, and their concerns over violent behavior. About one third of the U.K. population watches these films, according to industry estimates. This report came as part of an ill-fated attempt by the U.K. government to introduce age verification to pornographic websites.[290]
Social tendencies
Inborn family structures
Sociologists Judith Treas and Giulia M. Dotti Sani analyzed the diaries of 122,271 parents (68,532 mothers, 53,739 fathers) aged 18 to 65 in households with at least one child below the age of 13 from 1965 to 2012 in eleven Western countries—Canada, the United States, the United Kingdom, Spain, Italy, France, the Netherlands, Germany, Denmark, Norway, and Slovenia—and discovered that in general, parents had been spending more and more time with their children. In 1965, a mother spent on average 54 minutes on childcare activities each day whereas one from 2012 spent almost twice as much 104 minutes. Among fathers, the amount of time spent on childcare roughly quadrupled, from 16 minutes in 1965 to 59 in 2012. Parents of all education levels were represented, though those with higher education typically spent much more time with their children, especially university-educated mothers. France was the only exception. French mothers were spending less time with their children whereas fathers were spending more time. This overall trend reflects the dominant ideology of "intensive parenting" and the fact that contemporary fathers tend to hold more egalitarian views with regards to gender roles and are more likely than their predecessors to want to play an active role in their children's lives.[291]
In the United States, the Pew Research Center's analysis of data from the American Community Survey and the Decennial Census revealed that the number of children living outside of the traditional ideal of parents marrying young and staying together till death has risen precipitously between the mid- to late-twentieth century and the early twenty-first century. In 2013, only 43% of children lived with married parents in their first marriage, down from 61% in 1980 and 73% in 1960. Meanwhile, the share of children living with a single parent was 34% in 2013, up from 19% in 1980 and 9% in 1960. The proportion of children not living with their parents barely changed, standing at 5% in 2013; most of them lived with their grandparents. 15% of American children lived with married parents at least one of whom remarried in 2013, with little change from previous decades.[292]
Fashions of courtship
In Australia, growing numbers of older teenage boys and young men are now eschewing romantic relationships altogether, citing concerns over the traumatic experiences of older male family members, including false accusations of sexual misconduct or loss of assets and money after a divorce. This social trend—Men Going Their Own Way (MGTOW)—is an outgrowth of the men's rights movement, but one that emphasizes detachment from women rather than the issues. "Both sexes have different challenges; we’ve lost sight of that. We’re stuck in a gender war and it’s harming our children," psychologist Meredith Fuller told News.com.au.[293]
Family life
According to a 2014 report from UNICEF, some 250 million females were forced into marriage before the age of 15, especially in South Asia and sub-Saharan Africa. Problems faced by child brides include loss of educational opportunity, less access to medical care, higher childbirth mortality rates, depression, and suicidal ideation.[22][294]
Use of information and communications technologies (ICT)
Use of ICT in general
.jpg.webp)

Generation Z is the first cohort to have Internet technology readily available at a young age.[295] With the Web 2.0 revolution that occurred throughout the mid-late 2000s and 2010s, they have been exposed to an unprecedented amount of technology in their upbringing, with the use of mobile devices growing exponentially over time. Anthony Turner characterizes Generation Z as having a "digital bond to the Internet", and argues that it may help youth to escape from emotional and mental struggles they face offline.[5]
According to U.S. consultants Sparks and Honey in 2014, 41% of Generation Z spend more than three hours per day using computers for purposes other than schoolwork, compared with 22% in 2004.[296] In 2015, an estimated 150,000 apps, 10% of those in Apple's App Store, were educational and aimed at children up to college level,[297] though opinions are mixed as to whether the net result will be deeper involvement in learning[297] and more individualized instruction, or impairment through greater technology dependence[298] and a lack of self-regulation that may hinder child development.[298] Parents of Gen Zers fear the overuse of the Internet, and dislike the ease of access to inappropriate information and images, as well as social networking sites where children can gain access to people worldwide. Children reversely feel annoyed with their parents and complain about parents being overly controlling when it comes to their Internet usage.[299]
A 2015 study by Microsoft found that 77% of respondents aged 18 to 24 said yes to the statement, "When nothing is occupying my attention, the first thing I do is reach for my phone," compared to just 10% for those aged 65 and over.[300]
In a TEDxHouston talk, Jason Dorsey of the Center for Generational Kinetics stressed the notable differences in the way that Millennials and Generation Z consume technology, with 18% of Generation Z feeling that it is okay for a 13-year-old to have a smartphone, compared with just 4% for the previous generation.[301][302][303] An online newspaper about texting, SMS and MMS writes that teens own cellphones without necessarily needing them; that receiving a phone is considered a rite of passage in some countries, allowing the owner to be further connected with their peers, and it is now a social norm to have one at an early age.[304] An article from the Pew Research Center stated that "nearly three-quarters of teens have or have access to a smartphone and 30% have a basic phone, while just 12% of teens 13 to 15 say they have no cell phone of any type".[305] These numbers are only on the rise and the fact that the majority own a cell phone has become one of this generations defining characteristics. Consequently, "24% of teens go online 'almost constantly'."[305]
A survey of students from 79 countries by the OECD found that the amounts of time spent using an electronic device has increased, from under two hours per weekday in 2012 to close to three in 2019, at the expense of extracurricular reading.[34]
Psychologists have observed that sexting—or the transmission of sexually explicit contents via electronic devices—has seen noticeable growth among contemporary adolescents. The older the teenager, the more he or she participates in sexting. Besides some cultural and social factors such as the desire for acceptance and popularity among peers, the falling age at which a child receives a smartphone may contribute to the growth in this activity. However, while it is clear that sexting has an emotional impact on adolescents, it is still not clear how it precisely affects them. Some consider it a high-risk behavior because of the ease of dissemination to third parties leading to reputational damage and the link to various psychological conditions including depression and even suicidal ideation. Others defend youths' freedom of expression over the Internet. In any case, there is some evidence that at least in the short run, sexting brings positive feelings of liveliness or satisfaction. However, girls are more likely than boys to be receiving insults, social rejections, or reputational damage as a result of sexting.[17]
Digital literacy
Despite being labeled as 'digital natives', the 2018 International Computer and Information Literacy Study (ICILS), conducted on 42,000 eighth-graders (or equivalents) from 14 countries and education systems, found that only two percent of these people were sufficiently proficient with information devices to justify that description, and only 19% could work independently with computers to gather information and to manage their work.[7] ICILS assesses students on two main categories: Computer and Information Literacy (CIL), and Computational Thinking (CT). For CIL, there are four levels, one to four, with Level 4 being the highest. Although at least 80% students from most countries tested reached Level 1, only two percent on average reached Level 4. Countries or education systems whose students scored near or above the international average of 496 in CIL were, in increasing order, France, North Rhine-Westphalia, Portugal, Germany, the United States, Finland, South Korea, Moscow, and Denmark. CT is divided into four levels, the Upper, Middle, and Lower Regions. International averages for the proportions of students reaching each of these were 18%, 50%, and 32%, respectively. Countries or education systems whose students scored near or above the international average of 500 were, in increasing order, the United States, France, Finland, Denmark, and South Korea. In general, female eighth-graders outperformed their male counterparts in CIL by an international average of 18 points but were narrowly outclassed by their male counterparts in CT. (Narrow gaps made estimates of averages have higher coefficients of variation.)[306] In the United States, where the computer-based tests were administered by the National Center for Education Statistics,[7] 72% of eighth-graders said they searched for information on the Internet at least once a week or every school day, and 65% reported they were autodidactic information finders on the Internet.[306]
Use of social media networks
The use of social media has become integrated into the daily lives of most Gen Zers with access to mobile technology, who use it primarily to keep in contact with friends and family. As a result, mobile technology has caused online relationship development to become a new generational norm.[307] Gen Z uses social media and other sites to strengthen bonds with friends and to develop new ones. They interact with people who they otherwise would not have met in the real world, becoming a tool for identity creation.[299] The negative side to mobile devices for Generation Z, according to Twenge, is they are less "face to face", and thus feel more lonely and left out.[308]
Focus group testing found that while teens may be annoyed by many aspects of Facebook, they continue to use it because participation is important in terms of socializing with friends and peers. Twitter and Instagram are seen to be gaining popularity among members of Generation Z, with 24% (and growing) of teens with access to the Internet having Twitter accounts.[309] This is, in part, due to parents not typically using these social networking sites.[309] Snapchat is also seen to have gained attraction in Generation Z because videos, pictures, and messages send much faster on it than in regular messaging. Speed and reliability are important factors in members of Generation Z choice of social networking platform. This need for quick communication is presented in popular Generation Z apps like Vine and the prevalent use of emojis.[3]
A study by Gabrielle Borca, et al found that teenagers in 2012 were more likely to share different types of information than teenagers in 2006.[309] However, they will take steps to protect information that they do not want being shared, and are more likely to "follow" others on social media than "share".[111] A survey of U.S. teenagers from advertising agency J. Walter Thomson likewise found that the majority of teenagers are concerned about how their posting will be perceived by people or their friends. 72% of respondents said they were using social media on a daily basis, and 82% said they thought carefully about what they post on social media. Moreover, 43% said they had regrets about previous posts.[310]
A 2019 Childwise survey of 2,000 British children aged five to sixteen found that the popularity Facebook halved compared to the previous year. Children of the older age group, fifteen to sixteen, reported signs of online fatigue, with about three of ten saying they wanted to spend less time on the Internet.[92]
Effects of screen time
In his 2017 book Irresistible, professor of marketing Adam Alter explained that not only are children addicted to electronic gadgets, but their addiction jeopardizes their ability to read non-verbal social cues.[311]
_(2).jpg.webp)
A 2019 meta-analysis of thousands of studies from almost two dozens countries suggests that while as a whole, there is no association between screen time and academic performance, when the relation between individual screen-time activity and academic performance is examined, negative associations are found. Watching television is negatively correlated with overall school grades, language fluency, and mathematical ability while playing video games was negatively associated with overall school grades only. According to previous research, screen activities not only take away the time that could be spent on homework, physical activities, verbal communication, and sleep (the time-displacement hypothesis) but also diminish mental activities (the passivity hypothesis). Furthermore, excessive television viewing is known for harming the ability to pay attention as well as other cognitive functions; it also causes behavioral disorders, such as having unhealthy diets, which could damage academic performance. Excessive video gaming, on the other hand, is known for impairing social skills and mental health, and as such could also damage academic performance. However, depending on the nature of the game, playing it could be beneficial for the child; for instance, the child could be motivated to learn the language of the game in order to play it better. Among adolescents, excessive Internet surfing is well known for being negatively associated with school grades, though previous research does not distinguish between the various devices used. Nevertheless, one study indicates that Internet access, if used for schoolwork, is positively associated with school grades but if used for leisure, is negatively associated with it. Overall, the effects of screen time are stronger among adolescents then children.[8]
Research conducted in 2017 reports that the social media usage patterns of this generation may be associated with loneliness, anxiety, and fragility, and that girls may be more affected than boys by social media. According to 2018 CDC reports, girls are disproportionately affected by the negative aspects of social media than boys.[312] Researchers at the University of Essex analyzed data from 10,000 families, from 2010 to 2015, assessing their mental health utilizing two perspectives: Happiness and Well-being throughout social, familial, and educational perspectives. Within each family, they examined children who had grown from 10 to 15 during these years. At age 10, 10% of female subjects reported social media use, while this was only true for 7% of the male subjects. By age 15, this variation jumped to 53% for girls, and 41% for boys. This percentage influx may explain why more girls reported experiencing cyberbullying, decreased self-esteem, and emotional instability more than their male counterparts.[313]
Other researchers hypothesize that girls are more affected by social media usage because of how they use it. In a study conducted by the Pew Research Center in 2015, researchers discovered that while 78% girls reported to making a friend through social media, only 52% of boys could say the same.[314] However, boys are not explicitly less affected by this statistic. They also found that 57% of boys claimed to make friends through video gaming, while this was only true for 13% of girls.[314] Another Pew Research Center survey conducted in April 2015, reported that women are more likely to use Pinterest, Facebook, and Instagram than men. In counterpoint, men were more likely to utilize online forums, e-chat groups, and Reddit than women.[314]
Cyberbullying is more common now than among Millennials, the previous generation. It is more common among girls, 22% compared to 10% for boys. This results in young girls feeling more vulnerable to being excluded and undermined.[315][316]
According to a 2020 report by the British Board of Film Classification, "many young people felt that the way they viewed their overall body image was more likely the result of the kinds of body images they saw on Instagram."[290]
See also
- 9X Generation (Vietnam)
- Boomerang Generation
- Cusper
- Generation gap
- Post-90s and Little Emperor Syndrome (China)
- Strawberry Generation (Taiwan)
- List of generations
- Thumb tribe
Notes
- More broadly, contemporary human females are evolving to reach menarche earlier and menopause later compared to their ancestral counterparts. See human evolution from the Industrial Revolution to present.
References
- "Words We're Watching: 'Zoomer'". Merriam-Webster. January 13, 2020. Retrieved January 30, 2020.
- "zoomer". Dictionary.com. Retrieved June 14, 2020.
- Williams, Alex (September 18, 2015). "Move Over, Millennials, Here Comes Generation Z". The New York Times. Retrieved April 8, 2016.
- Quigley, Mary (July 7, 2016). "The Scoop on Millennials' Offspring – Gen Z". AARP. Retrieved July 9, 2016.
- Turner, Anthony (2015). "Generation Z: Technology And Social Interest". Journal of Individual Psychology. 71 (2): 103–113. doi:10.1353/jip.2015.0021. S2CID 146564218.
- Twenge, Jean (October 19, 2017). "Teens are sleeping less – but there's a surprisingly easy fix". The Conversation. Retrieved November 11, 2020.
- Strauss, Valerie (November 16, 2019). "Today's kids might be digital natives — but a new study shows they aren't close to being computer literate". Education. The Washington Post. Retrieved November 21, 2019.
- Adelantado-Renau, Mireia; Moliner-Urdiales, Diego; et al. (September 23, 2019). "Association Between Screen Media Use and Academic Performance Among Children and Adolescents: A Systematic Review and Meta-analysis". JAMA Pediatrics. American Medical Association. 173 (11): 1058–1067. doi:10.1001/jamapediatrics.2019.3176. hdl:10234/186798. PMC 6764013. PMID 31545344.
- "Generation Z is stressed, depressed and exam-obsessed". The Economist. February 27, 2019. ISSN 0013-0613. Retrieved March 28, 2019.
- "Teenagers are better behaved and less hedonistic nowadays". International. The Economist. January 10, 2018. Retrieved September 29, 2020.
- Twenge, Jean (September 19, 2017). "Why today's teens aren't in any hurry to grow up". The Conversation. Retrieved November 13, 2020.
- Chandler-Wilde, Helen (August 6, 2020). "The future of Gen Z's mental health: How to fix the 'unhappiest generation ever'". The Telegraph. ISSN 0307-1235. Retrieved August 8, 2020.
- UCL (August 6, 2020). "How to fix the 'unhappiest generation ever'". UCL News. Retrieved August 8, 2020.
- Schepis, Ty (November 19, 2020). "College-age kids and teens are drinking less alcohol – marijuana is a different story". The Conversation. Retrieved November 21, 2020.
- Hymas, Charles (December 9, 2020). "Generation Z swap drink for drugs as class A use by 16-24 year olds rises by half in seven years". The Telegraph. Archived from the original on December 10, 2020. Retrieved December 19, 2020.
- Protzko, John (May–June 2020). "Kids These Days! Increasing delay of gratification ability over the past 50 years in children". Intelligence. 80 (101451). doi:10.1016/j.intell.2020.101451.
- Del Rey, Rosario; Ojeda, Mónica; Casas, José A.; Mora-Merchán, Joaquín A.; Elipe, Paz (August 21, 2019). Rey, Lourdes (ed.). "Sexting Among Adolescents: The Emotional Impact and Influence of the Need for Popularity". Educational Psychology. Frontiers in Psychology. 10 (1828): 1828. doi:10.3389/fpsyg.2019.01828. PMC 6712510. PMID 31496968.
- Petridis, Alexis (March 20, 2014). "Youth subcultures: what are they now?". The Guardian. Retrieved January 4, 2021.
- Watts, Peter (April 10, 2017). "Is Youth Culture A Thing of the Past?". Apollo Magazine. Retrieved January 4, 2021.
- Weir, Kirsten (March 2016). "The risks of earlier puberty". Monitor. American Psychological Association. 47 (3): 40.
- Eckert-Lind, Camilla; Busch, Alexander S.; Petersen, Jørgen H.; Biro, Frank M.; Butler, Gary; Bräuner, Elvira V.; Juul, Anders (2020). "Worldwide Secular Trends in Age at Pubertal Onset Assessed by Breast Development Among Girls: A Systematic Review and Meta-analysis". JAMA Pediatrics. American Medical Association. 174 (4). doi:10.1001/jamapediatrics.2019.5881.
- Lamothe, Cindy (June 12, 2018). "The health risks of maturing early". BBC Future. Retrieved January 9, 2021.
- University Of Southampton (December 1, 2005). "New Research Shows How Evolution Explains Age Of Puberty". Science Daily. Retrieved December 28, 2020.
- Hochberg, Ze′ev; Konner, Melvin (2020). "Emerging Adulthood, a Pre-adult Life-History Stage". Frontiers in Endocrinology. 10 (918). doi:10.3389/fendo.2019.00918.
- Graphic Detail (October 3, 2019). "The prevalence of peanut allergy has trebled in 15 years". Daily Chart. The Economist. Retrieved October 3, 2019.
- "Why everybody is suddenly allergic to everything". Health. National Post. July 30, 2019. Retrieved November 24, 2019.
- American Psychological Association (March 15, 2019). "Mental health issues increased significantly in young adults over last decade". Science Daily. Retrieved December 31, 2020.
- Schraer, Rachel (February 11, 2019). "Is young people's mental health getting worse?". Health. BBC. Retrieved December 26, 2020.
- Kansagra, Sujay (May 2020). "Sleep Disorders in Adolescents". Pediatrics. American Academy of Pediatrics. 145 (Supplement 2): S204–S209. doi:10.1542/peds.2019-2056I.
- University of Rochester (January 9, 2020). "Parents aren't powerless when it comes to sleep-deprived teenagers". Science Daily. Retrieved January 1, 2021.
- Maulik, Pallab K.; Mascarenhas, Maya N.; Mathers, Colin D.; Dua, Tarun; Saxena, Shekhar (2011). "Prevalence of intellectual disability: A meta-analysis of population-based studies". Research in Developmental Disabilities. 32 (2): 419–436. doi:10.1016/j.ridd.2010.12.018. PMID 21236634.
- Buckley, Nicholas; Glasson, Emma J.; et al. (May 30, 2020). "Prevalence estimates of mental health problems in children and adolescents with intellectual disability: A systematic review and meta-analysis". Australian and New Zealand Journal of Psychiatry. The Royal Australian and New Zealand College of Psychiatrists. 54 (10): 970–984. doi:10.1177/0004867420924101.
- Flynn, James R.; Shayer, Michael (January–February 2018). "IQ decline and Piaget: Does the rot start at the top?". Intelligence. 66: 112–121. doi:10.1016/j.intell.2017.11.010.
- Thomas, Leigh (December 3, 2019). "Education levels stagnating despite higher spending: OECD survey". World News. Reuters. Retrieved February 5, 2020.
- Ferguson, Donna (February 29, 2020). "Children are reading less than ever before, research reveals". The Guardian. Retrieved November 7, 2020.
- Sliwa, Jim (August 20, 2018). "Teens Today Spend More Time on Digital Media, Less Time Reading". American Psychological Association. Retrieved November 8, 2020.
- Massey University (September 20, 2010). "Vocabulary on decline due to fewer books". Social Sciences. Phys.org. Retrieved November 7, 2020.
- Adams, Richard (April 19, 2018). "Teachers in UK report growing 'vocabulary deficiency'". The Guardian. Retrieved November 11, 2020.
- Busby, Eleanor (April 19, 2018). "Children's grades at risk because they have narrow vocabulary, finds report". Education. The Independent. Retrieved November 22, 2020.
- Anderson, Porter (October 25, 2017). "YA Reading and Writing Trends from Wattpad's 60 Million Users". Publishing Perspectives. Retrieved December 29, 2020.
- Aragon, Cecilia (December 27, 2019). "What I learned from studying billions of words of online fan fiction". MIT Technology Review. Retrieved December 29, 2020.
- Clynes, Tom (September 7, 2016). "How to raise a genius: lessons from a 45-year study of super-smart children". Nature. 537 (7619): 152–155. doi:10.1038/537152a. PMID 27604932. S2CID 4459557.
- Chhor, Khatya (December 8, 2016). "French students rank last in EU for maths, study finds". France24. Retrieved December 9, 2020.
- Alphonso, Caroline (December 3, 2019). "Canadian high school students among top performers in reading, according to new international ranking". The Globe and Mail. Retrieved November 13, 2019.
- DeSilver, Drew (February 15, 2017). "U.S. students' academic achievement still lags that of their peers in many other countries". Pew Research Center. Retrieved November 21, 2020.
- Wai, Jonathan; Makel, Matthew C. (September 4, 2015). "How do academic prodigies spend their time and why does that matter?". The Conversation. Retrieved December 19, 2020.
- Zimmer, Ben (February 1, 2019). "'Z' Is for the Post-Millennial Generation". Retrieved August 22, 2020 – via www.wsj.com.
- Horovitz, Bruce (May 4, 2012). "After Gen X, Millennials, what should next generation be?". USA Today. Retrieved November 24, 2012.
- Howe, Neil (October 27, 2014). "Introducing the Homeland Generation (Part 1 of 2)". Forbes. Retrieved May 2, 2016.
- Thomas, Michael (April 19, 2011). Deconstructing Digital Natives: Young People, Technology, and the New Literacies. Taylor & Francis. ISBN 978-1-136-73900-2.
- Takahashi, Toshie T. "Japanese Youth and Mobile Media". Rikkyo University. Retrieved May 10, 2016.
- "Generations in Canada". www12.statcan.gc.ca.
- "Meet Generation Z". CBS News. Retrieved January 15, 2021.
Generation Z is also hugely synonymous with technology because Centennials grew up in the era of smartphones. In fact, most of today's youth can't even remember a time before social media.
- "Millennials overtake Baby Boomers as America's largest generation". Pew Research Center. Pew Research. April 25, 2016. Retrieved September 18, 2016.
- Dimmock, Michael (January 17, 2019). "Defining generations: Where Millennials end and post-Millennials begin". Pew Research Center. Retrieved December 21, 2019.
- "Close Modal". Ascap.com. Retrieved January 3, 2020.
- Tiffany, Kaitlyn (February 3, 2020). "The Misogynistic Joke That Became a Goth-Meme Fairy Tale". The Atlantic.
- "ᐅ Zoomers – Meaning & origin of the term". SlangLang. January 21, 2020.
- "generation z". OxfordDictionaries.com. Retrieved August 17, 2019.
- "Definition of Generation Z". Merriam-Webster. Retrieved March 18, 2019.
- Generations Defined Archived June 16, 2016, at the Wayback Machine. Mark McCrindle
- "Move Over, Millennials: How 'iGen' Is Different From Any Other Generation". The California State University. August 22, 2017.
- Waldmeir, Patti. "Gen Z isn't all that into lab-grown meat, according to new study". UPI. Retrieved October 17, 2020.
- "Gen Z to drive produce growth". Blue Book Services. Retrieved October 19, 2020.
- "Beyond Binary: The lives and choices of Generation Z" (PDF). Ipsos. Ipsos MORI. Retrieved April 20, 2020.
- "Generation Z News LATEST CHARACTERISTICS, RESEARCH, AND FACTS". Business Insider. Archived from the original on October 7, 2020. Retrieved October 19, 2020.
Generation Z is broadly defined as the 72 million people born between 1996 and 2010, but Pew Research has recently defined Gen Z as anyone born after 1997.
- "A Survey of 19 Countries Shows How Generations X, Y, and Z Are — and Aren't — Different". The Harvard Business Review. August 25, 2017.
- "New global poll documents the pandemic's impact on inequality". BBC News. September 10, 2020. Retrieved January 1, 2021.
- Astor, Maggie. "Gen Z, Tell Us About Your Political Views". The New York Times. The New York Times. Retrieved April 20, 2020.
- "MTV launches 2020 '+1thevote' campaign to mobilize Millennials and Gen Z". Reuters. November 19, 2019.
- Frey, William H. (July 30, 2020). "Now, more than half of Americans are millennials or younger". Retrieved August 22, 2020.
- "A Millennial Sized Problem Stands in Front of Gen Z Homebuyers". Bloomberg. Retrieved April 21, 2020.
- McCusker, Carolyn; Pasquantonio, Victoria (November 2, 2020). "Teaching Resources for Election Day: Gen Z's Prom at the Polls!". PBS Newshour Extra. Retrieved January 3, 2021.
- Van Dam, Andrew (June 5, 2020). "The unluckiest generation in U.S. history". Business. The Washington Post. Retrieved December 29, 2020.
- "At the Spelling Bee, a New Word Is M-O-N-E-Y". The Wall Street Journal. May 24, 2019.
- Aratani, Lauren (July 6, 2020). "Why the Covid-19 financial crisis will leave lasting scars on Gen Z". BBC News. Retrieved January 3, 2021.
- Davies, Anna (November 10, 2020). "Will Gen Z ever recover from the COVID-19 recession?". Al Jazeera. Retrieved January 3, 2021.
- Siddiqui, Sarah (November 4, 2020). "COVID-19 Pressures Could Reverberate in Gen Z Futures". Federal Reserve Bank of St. Louis. Retrieved January 1, 2021.
- "Dublin ranked 39th best city for 'generation Z'". The Irish Times. September 4, 2019. Retrieved January 1, 2021.
- "Stress in America: Generation Z" (PDF). American Psychological Association. October 2018. Retrieved March 13, 2019.
- Van Paassen, Kevin (May 15, 2018). "The Generation Z effect". The Globe and Mail. Retrieved December 24, 2019.
- "Generations in Canada". Statistics Canada. 2011. Retrieved July 28, 2016.
- "What I (really) think about millennials: confessions of a gen Xer". Randstad Canada. May 12, 2019. Retrieved January 1, 2021.
- Broadbent, Emma; Gougoulis, John; Lui, Nicole; Pota, Vikas; Simons, Jonathan (January 2017). "Generation Z: Global Citizenship Survey" (PDF). Varkey Foundation. Retrieved November 15, 2019.
- Collie, Meghan (September 5, 2019). "Toronto is the 4th best city in the world for Gen Z. But can they afford it?". Global News. Retrieved September 14, 2019.
- "Germany's youth 'have lost their sense of fun', study finds". The Local (Germany). July 24, 2020. Retrieved January 4, 2021.
- Brandeis University (March 1, 2019). "The hipster effect: Why anti-conformists always end up looking the same". Phys.org. Retrieved December 31, 2020.
- Feingold, Lindsey; Garcia-Navarro, Lulu (March 10, 2019). "Man Inadvertently Proves That Hipsters Look Alike By Mistaking Photo As Himself". NPR. Retrieved December 31, 2020.
- Rowland, Miles (December 10, 2018). "Museums are most popular heritage attraction among young people". Museum Association. Retrieved December 4, 2020.
- Jacobs, Bel (November 26, 2020). "Why buying vintage clothes is 'the new luxury'". BBC Culture. Retrieved January 5, 2021.
- Ayto, John (May 1, 2019). "Words from the 21st century". Oxford English Dictionary. Retrieved December 29, 2020.
- Coughlan, Sean (January 30, 2019). "The one about Friends still being most popular". BBC News. Retrieved December 4, 2020.
- Low, Elaine (April 9, 2020). "Nickelodeon, Cartoon Network and other kids cable channels see viewership declines as streaming grows". Chicago Tribune. Retrieved December 19, 2020.
- "Disney Channels Lose 33% Of Its Audience In 2020". What's on Disney Plus. December 29, 2020. Retrieved January 1, 2021.
- Clements, Mikaella (August 8, 2018). "From Star Trek to Fifty Shades: how fanfiction went mainstream". The Guardian. Retrieved December 29, 2020.
- Knorr, Catharine (July 5, 2017). "Inside the racy, nerdy world of fanfiction". CNN. Retrieved January 4, 2021.
- Beck, Julia (October 1, 2019). "What Fan Fiction Teaches That the Classroom Doesn't". The Atlantic. Retrieved January 4, 2021.
- Hodak, Brittany. "New Study Spotlights Gen Z's Unique Music Consumption Habits". Forbes. Forbes. Retrieved March 6, 2018.
- Wickham, Chris (July 26, 2012). "Pop music too loud and all sounds the same: official". Reuters. Retrieved October 27, 2019.
- Serrà, Joan; Corral, Álvaro; Haro, Martín; Arcos, Josep Ll. (July 26, 2012). "Measuring the Evolution of Contemporary Western Popular Music". Scientific Reports. Nature. 2 (521). doi:10.1038/srep00521.
- CTV News Staff (July 27, 2012). "New study says pop music getting louder, blander". Entertainment. CTV News. Retrieved June 29, 2020.
- McAlpine, Fraser (February 12, 2018). "Has pop music lost its fun?". BBC. Retrieved December 29, 2020.
- Dredge, Stuart (September 26, 2013). "Children's reading shrinking due to apps, games and YouTube". The Guardian. Retrieved November 7, 2020.
- Coughlan, Sean (January 30, 2020). "Most children sleep with mobile phone beside bed". Education. BBC News. Retrieved October 14, 2020.
- Twenge, Jean; Martin, Gabrielle; Spitzberg, Brian (2018). "Trends in U.S. Adolescents' Media Use, 1976-2016: The Rise of Digital Media, the Decline of TV, and the (Near) Demise of Print". Psychology of Popular Media Culture. 8 (4): 329–345. doi:10.1037/ppm0000203.
- McCarthy, Daniel (December 9, 2020). "5 Things Travel Advisors Need to Know About Generation Z". Travel Market Report. Retrieved December 27, 2020.
- "Column: High-maintenance Generation Z heads to work". USATODAY.COM. Retrieved December 17, 2015.
- Palmer, Alun (August 1, 2014). "Are you X, Y, Z, Boomer or Silent Generation – what does it mean for you?".
- Henderson, J Maureen (July 31, 2013). "Move Over, Millennials: Why 20-Somethings Should Fear Teens". Forbes. Retrieved November 5, 2015.
- Dupont, Stephen (December 10, 2015). "Move Over Millennials, Here Comes Generation Z: Understanding the 'New Realists' Who Are Building the Future". Public Relations Tactics. Public Relations Society of America.
- Seemiller, Corey (2016). Generation Z Goes to College. Jossey-Bass. ISBN 978-1-119-14345-1.
- University College London (April 18, 2013). "Learning disabilities affect up to 10 percent of children". Science Daily. Retrieved September 13, 2020.
- Butterworth, Brian; Kovas, Yulia (April 19, 2013). "Understanding Neurocognitive Developmental Disorders Can Improve Education for All". Science. 340 (6130): 300–305. doi:10.1126/science.1231022. PMID 23599478. S2CID 15050021.
- Amiama-Espaillat, Cristina; Mayor-Ruiz, Cristina (2017). "Digital Reading and Reading Competence – The influence in the Z Generation from the Dominican Republic". Comunicar (in Spanish). 25 (52): 105–114. doi:10.3916/c52-2017-10. ISSN 1134-3478.
- Kim, Kyung Hee (2011). "The Creativity Crisis: The Decrease in Creative Thinking Scores on the Torrance Tests of Creative Thinking". Creativity Research Journal. 23 (4): 285–95. doi:10.1080/10400419.2011.627805. S2CID 10855765.
- Bronson, Po; Merryman, Ashley (July 10, 2010). "The Creativity Crisis". Education. Newsweek. Retrieved October 10, 2020.
- Dutton, Edward; Woodley of Menie, Michael (2018). "Chapter 9: Is There Really Hard Evidence That Intelligence Is Declining?". At Our Wits' End: Why We're Becoming Less Intelligent And What It Means for the Future. Great Britain: Imprint Academic. pp. 140–41. ISBN 9781845409852.
- Myers, Joe (August 30, 2019). "19 of the world's 20 youngest countries are in Africa". World Economic Forum. Retrieved December 6, 2019.
- Zhang, Wei (September 20, 2012). "Ageing China: Changes and challenges". Asia. BBC News. Retrieved February 15, 2020.
- Deyner, Simon; Gowen, Annie (April 24, 2018). "Too many men: China and India battle with the consequences of gender imbalance". South China Morning Post. Retrieved December 6, 2019.
- Mackie, Nick (January 24, 2005). "Japan's ageing workforce: built to last". Business. BBC News. Retrieved December 22, 2019.
- "Japan child numbers at record low". Asia-Pacific. BBC News. May 4, 2007. Retrieved December 22, 2019.
- "Japan eyes demographic time bomb". Asia-Pacific. BBC News. November 19, 2007. Retrieved December 22, 2019.
- Sin, Yuen (March 2, 2018). "Govt aid alone not enough to raise birth rate: Minister". Singapore. Strait Times. Retrieved December 27, 2019.
- Sin, Yuen (July 22, 2019). "Number of babies born in Singapore drops to 8-year low". Singapore. Strait Times. Retrieved December 27, 2019.
- Wodarz, Dominik; Stipp, Shaun; Hirshleifer, David; Komarova, Natalia L. (April 15, 2020). "Evolutionary dynamics of culturally transmitted, fertility-reducing traits". Proceedings of the Royal Society B. 287 (1925). doi:10.1098/rspb.2019.2468. PMC 7211447. PMID 32290801.
- Kaufmann, Eric (2013). "Chapter 7: Sacralization by Stealth? The Religious Consequences of Low Fertility in Europe". In Kaufmann, Eric; Wilcox, W. Bradford (eds.). Whither the Child? Causes and Consequences of Low Fertility. Boulder, Colorado, United States: Paradigm Publishers. pp. 135–56. ISBN 978-1-61205-093-5.
- Kaufmann, Eric (Winter 2010). "Shall the Religious Inherit the Earth?". Studies: An Irish Quarterly Review. 99 (396, the future of religion): 387–94. JSTOR 27896504.
- "Two new books explain the Brexit revolt". Britain. The Economist. November 3, 2018. Retrieved December 21, 2019.
- Livesay, Christopher (November 25, 2019). "In Italy, rising anxiety over falling birth rates". PBS Newshour. Retrieved December 21, 2019.
- Brabant, Malcolm (November 13, 2017). "Brain drain and declining birth rate threaten the future of Greece". PBS Newshour. Retrieved December 21, 2019.
- Eke, Stephen (June 23, 2005). "Russia's population falling fast". Europe. BBC News. Retrieved December 22, 2019.
- "Vladimir Putin reveals plan to boost Russia birth rate". Business. BBC News. April 20, 2011. Retrieved January 1, 2020.
- "Britain's baby bust". Demography. The Economist. July 23, 2020. Retrieved August 7, 2020.
- Teivainen, Aleksi (February 6, 2020). "Finland hit harder by demographic changes than other Nordics, shows report". Finland. Helsinki Times. Retrieved February 8, 2020.
- Patel, Arti (June 18, 2018). "Generation Z: Make room for Canada's connected, open and optimistic generation". Global News. Retrieved December 24, 2019.
- Hutchins, Aaron (June 4, 2016). "Why being a grandparent is more complicated than ever". Society. Macleans. Retrieved February 25, 2020.
- Garraty, John A. (1991). "Chapter XXXI: The Best of Times, The Worst of Times". The American Nation: A History of the United States. Harper Collins Publishers. pp. 857–8. ISBN 0-06-042312-9.
- Kight, Stef W. (December 14, 2019). "Immigration is shaping the youngest generation of voters". Axios. Retrieved December 24, 2019.
- Frey, William H. (January 2018). "The millennial generation: A demographic bridge to America's diverse future". The Brookings Institution. Retrieved September 9, 2019.
- Frey, William (June 24, 2019). "Less than half of US children under 15 are white, census shows". Brookings Institution. Retrieved December 4, 2020.
- Kight, Stef W. (December 14, 2019). "Immigration is shaping the youngest generation of voters". Axios. Retrieved December 24, 2019.
- Hart, Kim (September 11, 2019). "America's sweeping tide of diversity". Axios. Retrieved September 16, 2019.
- "Early Benchmarks Show 'Post-Millennials' on Track to Be Most Diverse, Best-Educated Generation Yet". Pew Research Center. November 15, 2018. Retrieved May 11, 2019.
- Wang, Hansi (November 15, 2018). "Generation Z Is The Most Racially And Ethnically Diverse Yet". NPR. Retrieved August 6, 2019.
- Kight, Stef W. (December 14, 2019). "Young people are outnumbered and outvoted by older generations". Axios. Retrieved December 24, 2019.
- Dill, Kathryn (November 6, 2015). "7 Things Employers Should Know About The Gen Z Workforce". Forbes. Retrieved May 11, 2019.
- Howard, Jacqueline (January 10, 2019). "US fertility rate is below level needed to replace population, study says". CNN. Retrieved January 1, 2020.
- Macunovich, Diane J. (September 8, 2015). "Baby booms and busts: how population growth spurts affect the economy". The Conversation. Retrieved November 14, 2020.
- "When the niños run out". The Economist. April 22, 2010. Retrieved May 3, 2020.
- Fensom, Anthony (December 1, 2019). "Australia's Demographic 'Time Bomb' Has Arrived". The National Interest. Yahoo! News. Retrieved December 24, 2019.
- Kohler, Alan; Hobday, Liz. "So many baby boomers are retiring this doctor quit his job to go build them luxury homes". 7.30. ABC News (Australia). Retrieved December 24, 2019.
- Worthman, Carol; Trang, Kathy (2018). "Dynamics of body time, social time and life history at adolescence". Nature. 554: 451–457. doi:10.1038/nature25750.
- Rushe, Dominic (September 7, 2018). "The US spends more on education than other countries. Why is it falling behind?". The Guardian. Retrieved November 14, 2020.
- Rimfeld, Kaili; Kovas, Yulia; Dale, Philip S.; Plomin, Robert (July 23, 2015). "Pleiotropy across academic subjects at the end of compulsory education". Nature. 5 (11713): 11713. doi:10.1038/srep11713. PMC 4512149. PMID 26203819.
- Strauss, Valerie (March 26, 2020). "1.5 billion children around globe affected by school closure. What countries are doing to keep kids learning during pandemic". The Washington Post. Retrieved January 2, 2020.
- Birrell, Hamish (November 17, 2020). "A golden age for universities will come to an end". The Economist. Retrieved December 31, 2020.
- "Covid-19 will be painful for universities, but also bring change". The Economist. August 8, 2020. Retrieved December 3, 2020.
- Floch, Benoît (May 31, 2012). "Why do the French excel at maths? Thank the écoles normales supérieures". The Guardian. Retrieved December 9, 2020.
- "How France created a university to rival MIT". The Economist. August 29, 2020. Retrieved December 29, 2020.
- Davies, Pascale (June 27, 2018). "On Macron's orders: France will bring back compulsory national service". France. EuroNews. Retrieved November 5, 2019.
- Villeminot, Florence (July 11, 2019). "National civic service: A crash course in self-defence, emergency responses and French values". French Connection. France 24. Retrieved November 5, 2019.
- "Poll says 80% of French want a return to national service". France 24. January 26, 2015. Retrieved November 5, 2019.
- Richardson, Hannah (July 2, 2012). "Boys' reading skills 'must be tackled'". BBC News. Retrieved November 12, 2020.
- Richardson, Hannah (May 17, 2011). "Boys 'can't read past 100th page', study says". BBC News. Retrieved November 12, 2020.
- Adams, Richard (September 28, 2017). "Almost half of all young people in England go on to higher education". Higher Education. The Guardian. Retrieved October 28, 2019.
- Turchin, Peter (July 2, 2008). "Arise 'cliodynamics'". Nature. 454 (7200): 34–5. doi:10.1038/454034a. PMID 18596791. S2CID 822431.
- Turchin, Peter (February 3, 2010). "Political instability may be a contributor in the coming decade". Nature. 403 (7281): 608. doi:10.1038/463608a. PMID 20130632.
- "Can too many brainy people be a dangerous thing?". The Economist. October 24, 2020. Retrieved December 1, 2020.
- Eaton, Sarah Elaine (January 15, 2020). "Cheating may be under-reported across Canada's universities and colleges". Education. The Conversation. Retrieved November 13, 2020.
- Danovich, Tove (June 14, 2018). "Despite A Revamped Focus On Real-Life Skills, 'Home Ec' Classes Fade Away". NPR. Retrieved November 14, 2020.
- Mathewson, Tara Garcia (October 23, 2019). "Nearly all American classrooms can now connect to high-speed internet, effectively closing the "connectivity divide"". Future of Learning. Hechinger Report. Retrieved November 10, 2019.
- "'Generation Z' is entrepreneurial, wants to chart its own future | news @ Northeastern". www.northeastern.edu. Retrieved December 10, 2015.
- Hawkins, B. Denise (July 13, 2015). "Here Comes Generation Z. What Makes Them Tick?". NEA Today. Retrieved December 10, 2015.
- Wellemeyer, James (August 6, 2019). "Half of young Americans say college is no longer necessary". Market Watch. Retrieved August 6, 2019.
- "'Generation Z' is entrepreneurial, wants to chart its own future". news.northeastern.edu.
- "Why Generation Z has a totally different approach to money". World Economic Forum. November 30, 2018. Retrieved May 15, 2019.
- Krupnick, Matt (August 29, 2017). "After decades of pushing bachelor's degrees, U.S. needs more tradespeople". PBS Newshour. Retrieved May 17, 2019.
- Paterson, James (July 3, 2018). "Yet another report says fewer Americans value 4-year degree". Education Dive. Retrieved August 2, 2019.
- Solman, Paul (March 28, 2019). "Anxious about debt, Generation Z makes college choice a financial one". PBS Newshour. Retrieved May 12, 2019.
- "Why Generation Z has a totally different approach to money". World Economic Forum. November 30, 2018. Retrieved May 15, 2019.
- Aucter, Zack (January 17, 2018). "Half of College Students Say Their Major Leads to a Good Job". Gallup. Retrieved August 2, 2019.
- "So You Have a Liberal Arts Degree and Expect a Job?". PBS Newshour. January 3, 2011. Retrieved October 4, 2019.
- Marcus, Jon (January 22, 2016). "Facing skepticism, colleges set out to prove their value". PBS Newshour. Retrieved October 2, 2019.
- Binkey, Collin (November 18, 2019). "US draws fewer new foreign students for 3rd straight year". Associated Press. Retrieved November 18, 2019.
- Hess, Abigail (August 30, 2018). "Harvard Business School professor: Half of American colleges will be bankrupt in 10 to 15 years". Careers. CNBC. Retrieved November 28, 2019.
- "Expert predicts 25% of colleges will "fail" in the next 20 years". CBS News. August 31, 2019. Retrieved August 28, 2019.
- Cohn, Scott (December 3, 2019). "The other college debt crisis: Schools are going broke". Education. CNBC. Retrieved January 29, 2020.
- Nadworny, Elissa (May 25, 2018). "Why Is Undergraduate College Enrollment Declining?". Education. NPR. Retrieved November 28, 2019.
- Duffin, Erin (August 9, 2019). "Percentage of the U.S. population who have completed four years of college or more from 1940 to 2018, by gender". Statista. Retrieved October 25, 2019.
- "Australia's foreign-student bubble has burst". Asia. The Economists. May 28, 2020. Retrieved July 12, 2020.
- Kasriel, Stephane (January 10, 2019). "What the next 20 years will mean for jobs – and how to prepare". World Economic Forum. Retrieved October 25, 2019.
- Zao-Sanders, Marc; Palmer, Kelly (September 26, 2019). "Why Even New Grads Need to Reskill for the Future". Harvard Business Review. Harvard Business School Publishing. Retrieved October 25, 2019.
- "Can a kid start a business?". Entrepreneur School. Archived from the original on October 26, 2017. Retrieved October 26, 2017.
- Schwab, Klaus (January 14, 2016). "The Fourth Industrial Revolution: what it means, how to respond". World Economic Forum. Retrieved November 5, 2019.
- Desjardins, Jeff (March 20, 2019). "Which countries are best at attracting high-skilled workers?". World Economic Forum. Retrieved October 27, 2019.
- Geiger, Thierry; Crotti, Roberto (October 9, 2019). "These are the world's 10 most competitive economies in 2019". World Economic Forum. Retrieved October 27, 2019.
- "Zoomers, zeros and Gen Z". Business. The Economist. May 23, 2020. Retrieved July 13, 2020.
- Edmond, Charlotte (June 12, 2019). "Unemployment is down across the world's largest economies". World Economic Forum. Retrieved June 19, 2019.
- Yu, Katrina (September 29, 2019). "China is producing billionaires faster than any other nation". PBS Newshour. Retrieved November 5, 2019.
- Soo, Zen (October 26, 2018). "From supermarkets to super apps, Southeast Asian tech start-ups are looking to China not Silicon Valley". South China Morning Post. Retrieved November 5, 2019.
- Gopalan, Nisha (December 27, 2019). "News Analysis: China takes a risk with Gen Z's love affair with debt". Business. Bloomberg (via LA Times). Retrieved January 3, 2019.
- "EU unemployment drops to lowest level in nearly two decades: Eurostat". Euronews. October 1, 2019. Retrieved October 18, 2019.
- Rios, Beatriz (December 3, 2019). "EU concerned over France, Italy and Spain debts". Euroactiv. Retrieved January 4, 2020.
- "Skill shortages in Europe: Which occupations are in demand – and why". Cedefop. October 25, 2016. Retrieved November 6, 2019.
- Kahn, Michael (July 9, 2020). "Coronavirus 'Class of 2020': Europe's lost generation?". World News. Reuters. Retrieved July 18, 2020.
- "Britain's economy is holding up well—for now". Britain. The Economist. October 31, 2019. Retrieved November 6, 2019.
- Taylor, Chloe (July 24, 2019). "These are the highest paying entry level jobs in the UK". Work. CNBC. Retrieved November 6, 2019.
- "Surge in teenagers setting up businesses, study suggests". Newsbeat. BBC News. December 30, 2019. Retrieved January 3, 2020.
- "Canada's Best Jobs 2017: The Top 25 Jobs in Canada". Jobs. Maclean's. May 29, 2017. Retrieved November 5, 2019.
- Bakx, Kyle (October 30, 2019). "'It's the smart thing to do': Canadian oil driller moves all its rigs to the U.S." Business. CBC News. Retrieved November 5, 2019.
- Breen, Kerri (October 13, 2020). "Majority of Gen Z Canadians close to insolvency amid coronavirus pandemic, poll finds". Canada. Global News. Retrieved January 5, 2021.
- Brown, Dalvin (July 16, 2019). "Gen Z, millennials: It's 'embarrassing' to rely on parents for money after 27". USA Today. Retrieved July 23, 2019.
- Piore, Adam (June 13, 2019). "Gen Zs are Anxious, Entrepreneurial and Determined to Avoid Their Predecessor's Mistakes". Newsweek. Retrieved June 26, 2019.
- Boyle, Matthew; Townsend, Matthew (July 31, 2019). "Reality bites back: To understand Gen Z, look to the Gen X parents". Bloomberg (via MSN). Retrieved August 4, 2019.
- Desjardins, Jeff (February 19, 2019). "Generation Z: What to expect from the newest addition to the workforce". World Economic Forum. Retrieved June 16, 2019.
- Booth, Barbara (June 3, 2019). "Gen Z is hitting the job market — what they need to know to get the best salary and benefits". CNBC. Retrieved June 7, 2019.
- Gilchrist, Karen (March 5, 2019). "How millennials and Gen Z are reshaping the future of the workforce". CNBC. Retrieved July 11, 2019.
- McHugh, Calder (June 11, 2019). "Morgan Stanley: Millennials, Gen Z set to boost the US economy". Yahoo Finance. Retrieved June 15, 2019.
- Cox, Jeff (October 4, 2019). "September unemployment rate falls to 3.5%, a 50-year low, as payrolls rise by 136,000". CNBC. Retrieved October 19, 2019.
- "US jobs growth jumps in November". Business. BBC News. December 6, 2019. Retrieved December 7, 2019.
- Gogoi, Pallavi (May 20, 2019). "America Is In Full Employment, So Why Aren't We Celebrating?". NPR. Retrieved August 16, 2019.
- Newman, Rick (July 8, 2019). "Trump vs. Obama on jobs". Yahoo Finance. Retrieved July 9, 2019.
- DeSilver, Drew (August 7, 2018). "For most U.S. workers, real wages have barely budged in decades". Pew Research Center. Retrieved October 30, 2019.
- Herron, Janna; Davidson, Paul (July 5, 2019). "June jobs report: Economy adds 224,000 jobs, easing recession fears". USA Today. Retrieved July 7, 2019.
- "America's economy is resisting the pull of recession". The Economist. October 30, 2019. Retrieved October 30, 2019.
- Schneider, Howard; Dunsmuir, Lindsay (November 13, 2019). "Fed chief Powell pushes back on negative interest rates". Business News. Reuters. Retrieved November 14, 2019.
- "Occupational Handbook Outlook: Highest Paying Occupations". Bureau of Labor Statistics. United States Department of Labor. September 4, 2019. Retrieved October 30, 2019.
- "Occupational Outlook Handbook: Fastest Growing Occupations". Bureau of Labor Statistics. United States Department of Labor. September 4, 2019. Retrieved October 30, 2019.
- "Occupational Handbook Outlook: Most New Jobs". Bureau of Labor Statistics. United States Department of Labor. September 4, 2019. Retrieved November 3, 2019.
- Frazee, Gretchen (November 16, 2018). "Manufacturers say their worker shortage is getting worse. Here's why". PBS Newshour. Retrieved May 17, 2019.
- Horsley, Scott (October 4, 2019). "Hiring Steady As Employers Add 136,000 Jobs; Unemployment Dips To 3.5%". NPR. Retrieved October 19, 2019.
- "US unemployment rate falls to 50-year low of 3.5%". BBC News. October 4, 2019. Retrieved October 20, 2019.
- Mindlin, Alan (October 30, 2019). "Gen Z Is the Answer to the Skills Gap— They Just Don't Know It Yet". Talent. Industry Week. Retrieved November 3, 2019.
- Turchin, Peter (2013). "Modeling Social Pressures Toward Political Instability". Cliodynamics. 4 (2). doi:10.21237/C7clio4221333.
- McGeever, John (April 30, 2019). "UPDATE 1-Brazil's unemployment rate rises to 12.7%, reflects weak labor market". Reuters. Retrieved November 5, 2019.
- Lo, June; Chee, Michael WL (June 2020). "Cognitive effects of multi-night adolescent sleep restriction: current data and future possibilities". Current Opinion in Behavioral Sciences. 33: 34–41. doi:10.1016/j.cobeha.2019.12.005.
- University of Surrey (December 14, 2020). "Young people who go to bed later drink and smoke more due to their impulsivity". Science Daily. Retrieved January 5, 2021.
- "Sleep deprivation makes Scots teenage girls' anxiety worse". BBC News. January 30, 2020. Retrieved December 4, 2020.
- McCue, Duncan (January 29, 2019). "Lack of sleep is 'epidemic' among Canadian teens. Here's why it has doctors worried". CBC News. Retrieved December 4, 2020.
- CBC Radio (December 13, 2019). "The mental health crisis among young Canadians". Sunday Magazine. CBC Radio. Retrieved December 26, 2020.
- Twenge, Jean (November 14, 2017). "With teen mental health deteriorating over five years, there's a likely culprit". The Conversation. Retrieved November 10, 2020.
- American Academy of Pediatrics (October 25, 2019). "Only half of US children get enough sleep during the week". Science Daily. Retrieved November 21, 2020.
- Harvard University (January 11, 2010). "Ongoing human evolution could explain recent rise in certain disorders". Science Daily. Retrieved May 24, 2020.
- Stevens, Heidi (July 16, 2015). "Too much screen time could be damaging kids' eyesight". Chicago Tribune. Retrieved September 8, 2019.
- Hellmich, Nanci (January 25, 2014). "Digital device use leads to eye strain, even in kids". USA Today. Retrieved September 8, 2019.
- "10-fold surge in South Africa teens treated for HIV: Study". Channel News Asia. October 2, 2019. Retrieved October 16, 2019.
- McCauley, Dana (September 30, 2019). "Almost half young adults now overweight or obese, new ABS data shows". Sydney Morning Herald. Retrieved October 18, 2019.
- EarthTalk (October 19, 2013). "Rises in Early Puberty May Have Environmental Roots". Scientific American. Archived from the original on November 20, 2020. Retrieved January 9, 2021.
- Weale, Sally (February 8, 2017). "UK second only to Japan for young people's poor mental wellbeing". The Guardian. Retrieved April 18, 2018.
- Miller, Susan (June 24, 2019). "The young are regarded as the most tolerant generation. That's why results of this LGBTQ survey are 'alarming'". Nation. USA Today. Retrieved December 26, 2019.
- Miller, Susan (June 5, 2019). "Stonewall Forever: 50 years after the raid that sparked the LGBTQ movement, monument goes digital". USA Today. Retrieved June 25, 2019.
- ""Pro-Choice" or "Pro-Life," 2018 Demographic Table". Gallup. 2019. Retrieved November 16, 2019.
- "Goldman Sachs chart of the generations". Business Insider. Retrieved February 6, 2016.
- "Identifying What Matters Most to the Next Generation" (PDF). International Federation of Accountants. 2019. Retrieved July 10, 2019.
- "Generation Z Looks a Lot Like Millennials on Key Social and Political Issues | Pew Research Center". January 17, 2019. Retrieved November 22, 2019.
- "Infographic: Gen Z Voter and Political Views Election 2016". The Center for Generational Kinetics.
- "The myth of the 2017 'youthquake' election". UK. BBC News. January 29, 2018. Retrieved December 15, 2019.
- Sopel, Jon (December 15, 2019). "Will UK provide light bulb moment for US Democrats?". US & Canada. BBC News. Retrieved December 15, 2019.
- Tilley, James (October 4, 2015). "Hard Evidence: do we become more conservative with age?". The Conversation. Retrieved November 16, 2020.
- Dhaliwal, Taz (September 30, 2019). "For the 1st time, millennial voters will make up the biggest voting bloc in a federal election". Global News. Retrieved October 15, 2019.
- Vandermaas-Peeler, Alex; Cox, Daniel; Fisch-Friedman, Molly; Jones, Robert P. (January 10, 2018). "Diversity, Division, Discrimination: The State of Young America | MTV/PRRI Report". Public Religion Research Institute. Retrieved March 18, 2018.
- Scott, Eugene (January 11, 2018). "The state of America, according to Generation Z". The Washington Post. Retrieved March 18, 2018.
- "50k 'Gen Z' Students Identify as Republican – Hispanic Heritage Foundation". hispanicheritage.org. October 27, 2016. Retrieved December 23, 2016.
- "America's Youth Have Spoken: Hillary Clinton Is Generation Z's Choice for President". Retrieved February 26, 2017.
- Wierson, Arick (March 23, 2018). "March for our Lives gun control rally only hints at the political power of Generation Z". CNBC. Retrieved March 24, 2018.
- Anapol, Avery (March 14, 2018). "NJ student march organizers pen op-ed to NRA We Wont Let You Win". The Hill. Retrieved March 24, 2018.
- "Dear National Rifle Association: We Won't Let You Win. From, Teenagers". The New York Times. March 13, 2018. Retrieved March 24, 2018.
- Fisher, Dana (March 28, 2018). "Here's who actually attended the March for Our Lives. (No, it wasn't mostly young people.)". The Washington Post. Retrieved January 20, 2019.
- "Millennials Are No More Liberal On Gun Control Than Elders, Polls Show". NPR. February 24, 2018. Retrieved June 9, 2019.
- Parker, Kim; Horowitz, Julianna Menasce; Igielnik, Ruth; Oliphant, J. Baxter; Brown, Anna (June 22, 2017). "America's Complex Relationship With Guns". Social Trends. Pew Research Center. Retrieved November 13, 2019.
- Eatwell, Roger; Goodwin, Matthew (2018). "Chapter 1: Myths". National Populism - The Revolt Against Liberal Democracy. Great Britain: Pelican Book. ISBN 978-0-241-31200-1.
- Eatwell, Roger; Goodwin, Matthew (2018). "Chapter 10: Towards Post-populism". National Populism - The Revolt Against Liberal Democracy. Great Britain: Pelican Book. ISBN 978-0-241-31200-1.
- "A estreia dos candidatos da geração Z" [The debut of the Z generation candidates] (in Portuguese). September 28, 2020. Archived from the original on October 5, 2020. Retrieved October 5, 2020.
- Sherwood, Harriet (July 12, 2018). "Post-millennial generation 'more tolerant' of Christianity". Religion. The Guardian. Retrieved November 24, 2019.
- Hope, J (2016). "Get your campus ready for Generation Z". Dean & Provost. 17 (8): 1–7. doi:10.1002/dap.30174.
- "Atheism Doubles Among Generation Z". Barna.com. Barna Group. January 24, 2018. Retrieved October 31, 2019.
- Sherwood, Harriet (August 27, 2018). "Religion: why faith is becoming more and more popular". The Guardian. Retrieved June 19, 2019.
- Whitehead, Nadia (December 25, 2015). "A Religious Forecast For 2050: Atheism Is Down, Islam Is Rising". Goats and Soda. NPR. Retrieved November 19, 2019.
- "Generation Z Breaks Records in Education and Health Despite Growing Economic Instability of Their Families". PR Newswire. June 21, 2016. Retrieved June 22, 2016.
- Blad, Evie (June 21, 2016). "Teenagers' Health, Educational Outcomes Improving, Report Finds". Education Week. Retrieved June 22, 2016.
- Cooke, Henry (May 16, 2017). "Teen birth rate halves since 2008". Stuff. Retrieved November 15, 2020.
- Sohn, Emily (August 28, 2019). "Weighing the dangers of cannabis". Nature. 572 (7771): S16–S18. Bibcode:2019Natur.572S..16S. doi:10.1038/d41586-019-02530-7. PMID 31462789. S2CID 201665162.
- Ayesh, Rashaan (April 20, 2019). "Survey: Gen Z twice as likely to use marijuana than national average". Axios. Retrieved September 5, 2019.
- McCoppin, Robert (December 24, 2019). "Thinking of buying pot in Illinois on Jan. 1? Here's how experts say it could affect your health — for better and for worse". Chicago Tribune. Retrieved December 24, 2019.
- Jackson, Nicholas J.; Isen, Joshua D.; Khoddam, Rubin; Irons, Daniel; Tuvblad, Catherine; Iacono, William G.; McGue, Matt; Raine, Adrian; Baker, Laura A. (February 2, 2016). "Impact of adolescent marijuana use on intelligence: Results from two longitudinal twin studies". Proceedings of the National Academy of Sciences of the United States of America. 113 (5): E500–E508. doi:10.1073/pnas.1516648113. PMC 4747759. PMID 26787878.
- "Youth Justice Statistics 2018/19" (PDF). gov.uk. Youth Justice Board under the direction of the Ministry of Justice. January 30, 2020. Archived (PDF) from the original on June 9, 2020. Retrieved June 29, 2020.
- "Youth Offenders". Australian Bureau of Statistics. February 6, 2020. Archived from the original on June 9, 2020. Retrieved June 9, 2020.
- Allen, Marry K.; Superle, Tammy (February 17, 2016). "Youth crime in Canada, 2014". Statistics Canada. Retrieved September 29, 2020.
- Waterson, Jim (January 31, 2020). "Porn survey reveals extent of UK teenagers' viewing habits". The Guardian. Retrieved November 21, 2020.
- University of California, Irvine (September 28, 2016). "Today's parents spend more time with their kids than moms and dads did 50 years ago". Science Daily. Retrieved November 3, 2020.
- Livingston, Gretchen (December 22, 2014). "Fewer than half of U.S. kids today live in a 'traditional' family". Pew Research Center. Retrieved November 15, 2020.
- Barraclough, Corrine (April 3, 2017). "First men, now boys are 'Going Their Own Way'". News.com.au. Retrieved January 1, 2021.
- United Nations Children's Fund (2014). "Ending Child Marriage: Progress and Prospects" (PDF). UNICEF. Retrieved January 9, 2021.
- Prensky, Marc (2001). "Digital Natives, Digital Immigrants Part 1". On the Horizon.
- "Meet Generation Z: Forget Everything You Learned About Millennials". Sparks and Honey. June 17, 2014. p. 39. Retrieved December 16, 2015.
- "Should CellPhones Be Allowed in School?". education.cu-portland.edu. November 9, 2012. Retrieved December 1, 2015.
- "Mobile and interactive media use by young children: The good, the bad and the unknown". EurekAlert!. Retrieved December 1, 2015.
- Borca, Gabriella; Bina, Manuela; Keller, Peggy S.; Gilbert, Lauren R.; Begotti, Tatiana (November 1, 2015). "Internet use and developmental tasks: Adolescents' point of view". Computers in Human Behavior. 52: 49–58. doi:10.1016/j.chb.2015.05.029.
- MacSpadden, Kevin (May 14, 2015). "You Now Have a Shorter Attention Span Than a Goldfish". Time. Retrieved December 9, 2020.
- "Jason Dorsey TEDx Talk On Generation After Millennials: iGen Gen Z". Jason Dorsey. Retrieved April 6, 2016.
- TEDx Talks (November 18, 2015), What do we know about the generation after millennials? | Jason Dorsey | TEDxHouston, retrieved April 6, 2016
- Dorsey, Jason (2016). "iGen Tech Disruption" (PDF). Center for Generational Kinetics. Retrieved April 6, 2016.
- Regine (28 March 2005). "Owning a cell phone is rite of passage for teenagers". Textuality.org. Archived from the original on 11 December 2015. Retrieved 7 December 2015.
- Lenhart, Amanda (April 8, 2015). "Teens, Social Media & Technology Overview 2015". Pew Research Center. Pew Research Center Internet Science Tech RSS. Retrieved December 5, 2015.
- "ICILS 2018 U.S. Results". National Center for Education Statistics. 2019. Retrieved November 21, 2019.
- Borca. "Internet Use". Cite journal requires
|journal=(help) - Inc., MTR at CareerPlanner.com. "The Generations - Which Generation are You?". www.careerplanner.com.
- Madden, Mary; et al. (May 21, 2013). "Teens, Social Media, and Privacy". Pew Research Center. Retrieved December 10, 2015.
- J. Walter Thompson. "CONSUMER INSIGHTS, J. WALTER THOMPSON INTELLIGENCE Meet Generation Z". Retrieved May 22, 2017.
- Stevens, Heidi (March 13, 2017). "'Irresistible' technology is making our kids miss social cues". Chicago Tribune. Retrieved December 10, 2020.
- Centers for Disease Control and Prevention. 2015. Youth Risk Behavior Survey Data. Available at: cdc.gov/yrbs.
- Booker, Cara L.; Kelly, Yvonne J.; Sacker, Amanda (March 20, 2018). "Gender differences in the associations between age trends of social media interaction and well-being among 10-15 year olds in the UK". BMC Public Health. 18 (1): 321. doi:10.1186/s12889-018-5220-4. PMC 5859512. PMID 29554883.
- "Men catch up with women on overall social media use". Pew Research Center. August 28, 2015. Retrieved May 30, 2018.
- "Smartphones and Social Media". Child Mind Institute.
- Twenge, Jean (August 22, 2017). IGen: Why Today's Super-Connected Kids Are Growing Up Less Rebellious, More Tolerant, Less Happy--and Completely Unprepared for Adulthood--and What That Means for the Rest of Us.
Further reading
- Palfrey, John; Gasser, Urs (2008). Born Digital: Understanding the First Generation of Digital Natives. Basic Books.
- Arum, Richard; Roksa, Josipa (2011). Academically Adrift - Limited Learning on College Campuses. Chicago, IL: The University of Chicago Press. ISBN 9780226028569.
- McCrindle, Mark; Wolfinger, Emily (2014). The ABC of XYZ: Understanding the Global Generations. McCrindle Research.
- Combi, Chloe (2015). Generation Z: Their Voices, Their Lives. London: Hutchinson. OCLC 910606762.
- Greenspan, Louise; Deardorff, Julianna (2015). The New Puberty: How to Navigate Early Development in Today's Girls. Rodale Books. ISBN 978-1623365981.
External links
- The Downside of Diversity. Michael Jonas. The New York Times. August 5, 2007.
- The Next America: Modern Family. Pew Research Center. April 30, 2014. (Video, 2:16)
- Meet Generation Z: Forget Everything You Learned About Millennials – 2014 presentation by Sparks and Honey
- Is a University Degree a Waste of Money? CBC News: The National. March 1, 2017. (Video, 14:39)
- A Generation Z Exploration. (Web version) Rubin Postaer and Associates (RPA). 2018.
- We asked teenagers what adults are missing about technology. This was the best response. Taylor Fang. MIT Technology Review. December 21, 2019.
- The Amish use tech differently than you think. We should emulate them. Jeff Smith. The Washington Post. February 17, 2020.
| Authority control |
|---|
