Greenhouse gas emissions by the United Kingdom
In 2018, net greenhouse gas emissions in the United Kingdom were 451.1 million tonnes CO2 equivalent.[3] Emission in the UK decreased in the 2010s due to the closure of almost all coal-fired power stations,[4] but as of 2018 emissions per person were still above the world average.[5]
.jpg.webp)
.png.webp)
The UK has committed to carbon neutrality by 2050[6] and the Energy and Climate Intelligence Unit (ECIU) has said it would be affordable.[7] However, as of March 2020 the UK was not on track for its 2030 commitments of 61% of 1990 levels.[8] As part of an economic stimulus to attempt to get out of the coronavirus recession a green industrial policy is being considered.[9] One of the methods of reducing emissions is the UK Emissions Trading Scheme.[10]
UK carbon neutral plan
The Climate Change Act 2008 set the country's emission reduction targets.
Before 2019 the UK was legally bound by the Climate Change Act to reduce emissions 80% by 2050, but a new law mandating a 100% cut was under discussion in 2019. According to the Committee on Climate Change, the UK can cut its carbon emissions down to near zero and so become carbon neutral, at no extra cost if done gradually from 2019 to 2050.[11] The law was adopted by the parliament in June 2019.[12]
The "legally binding" targets are a reduction of at least 100% by 2050 (against the 1990 baseline).[13]
It also mandates interim, 5-year budgets. The first five are as follows:[14]
| Budget | Carbon budget level | Reduction below 1990 levels |
|---|---|---|
| 1st carbon budget (2008 to 2012) | 3,018 MtCO2e | 25% |
| 2nd carbon budget (2013 to 2017) | 2,782 MtCO2e | 31% |
| 3rd carbon budget (2018 to 2022) | 2,544 MtCO2e | 37% by 2020 |
| 4th carbon budget (2023 to 2027) | 1,950 MtCO2e | 51% by 2025 |
| 5th carbon budget (2028 to 2032) | 1,725 MtCO2e | 57% by 2030 |
Criticism of targets
Production targets have been criticised for ignoring the emissions embodied in imports, thereby attributing them to other countries, such as China.[15] One report showed that Britain's imports are responsible for more overseas emissions than those of any other European country, and should add an extra 4.3 tonnes CO
2 to the average 5.4 tonnes per capita.[16][17]
Past performance
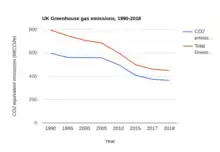
The graph above shows the annual figures for carbon dioxide emissions since 1990. It excludes carbon emissions from international aviation and international shipping, which together rose by 74.2% from 22.65 to 39.45 million tonnes of carbon dioxide between 1990 and 2004.[18] Reductions in methane emissions are largely due to a decline in the country's coal industry and to improved landfilling technologies.[19]
Tax policy
It has been suggested that value added tax (VAT) on natural gas used for heating should be raised from 5% to the usual 20% and the proceeds used to help poor people.[20]
Cumulative emissions
| Country | Emissions (tonnes CO2) |
|---|---|
| Luxembourg | 1,429 |
| The United States of America | 1,127 |
| The United Kingdom of Great Britain and Northern Ireland | 1,126 |
| Belgium | 1,026 |
| The Czech Republic | 1,006 |
| Germany | 987 |
| Estonia | 877 |
| Canada | 779 |
| Kazakhstan | 682 |
| Russia | 666 |
| Denmark | 653 |
| Bahrain | 631 |
| Kuwait | 629 |
| Australia | 622 |
| Poland | 594 |
| Qatar | 584 |
| Trinidad & Tobago | 582 |
| Slovakia | 579 |
| The Netherlands | 576 |
The emissions for 2012 were 581 MtCO2e in total and 7.7 tonnes per capita. Carbon dioxide (CO
2) emissions have reduced 17% from 1990 to 2012 compared to 21% in Germany.[22]
Import related emissions of the United Kingdom were 35% in 1992 and 67% in 2004. Consumer emissions have risen steadily over the period 1992–2004 and are in 2004 18% higher than in 1992, while the national total emissions reported to the UNFCCC in 1992–2004 have declined by 5%.[23]
According to reports, 40% of the emissions in the UK come from individuals, energy being used up in homes, motor vehicle driving, and air travel.[24] Almost a decade ago, UK had passed the Climate Change Act which requires the ministers to cut down the carbon emissions by 80% till 2050.[25]
The Committee on Climate Change, an independent body which advises the UK and devolved Government, publish annual progress reports in respect to control the climate change in the United Kingdom. Meeting future carbon budgets UK will require reducing emissions by at least 3% a year. According to the report in June 2013 emissions of greenhouse gases increased by 3.5% in 2012 due to cold winter compared to 2011 and coal in power generation. UK 594 MtCO2e emissions by sectors in 2011 were 24% power, 19% industry, 18% land transport, 14% buildings, ca 1% agriculture and LULUCF and ca 1% aviation.[26] Emission increase was biggest in aviation: Air transport in the United Kingdom CO
2 emissions increased from ca 17 MtCO2 in 1990 to 35 MtCO2 in 2011.[27][28]
Peat
UK peatlands cover around 23,000 km2 or 9.5% of the UK land area and store at least 3.2 billion tonnes of carbon. A loss of only 5% of UK peatland carbon would equate to the total annual UK anthropogenic greenhouse gas emissions. Healthy peat bogs have a net long-term ‘cooling’ effect on the climate. Peatlands rely on water. When drained, peatlands waste away through oxidation, adding carbon dioxide to the atmosphere. Damaged and degraded peatlands place a substantial financial burden on society because of increased greenhouse gas emissions, poorer water quality and loss of other ecosystem services.[29]
Coal
UK will phase-out coal in 2024. UK's Eggborough's plant was closed in 2018. The UK had two weeks in May 2019 with all its coal plants switched off for the first time since the Industrial Revolution began.[30]
Buildings
40% of UK greenhouse gas emissions are caused by the built environment. Design of buildings and the planning of cities can do much to counter climate crisis.[31] If the cement industry were a country, it would be the third largest carbon dioxide emitter in the world with up to 2.8bn tonnes, surpassed only by China and the US. Among materials, only coal, oil and gas are a greater source of greenhouse gases. In cities, concrete also adds to the heat-island effect by absorbing the warmth of the sun and trapping gases from car exhausts and air-conditioner units – though it is, at least, better than darker asphalt. [32]
See also
Notes
- As of September 2020, published figures for 2019 are still provisional.
References
- "2018 UK Greenhouse gas emissions, Provisional figures" (PDF). 28 March 2019. Retrieved 12 January 2020.
- "2019 UK Greenhouse gas emissions, Provisional figures". 26 March 2020. Retrieved 2 September 2020.
- "2018 UK Greenhouse Gas Emissions, Final figures" (PDF). 26 March 2020. Retrieved 2 September 2020.
- Harrabin, Roger (5 February 2019). "Climate change: UK CO2 emissions fall again". Retrieved 5 January 2020.
- "Where in the world do people emit the most CO2?". Our World in Data. Retrieved 25 January 2020.
- Harrabin, Roger (12 June 2019). "UK commits to 'net zero' emissions by 2050". BBC News. Retrieved 26 January 2020.
- "Net zero: economy and jobs". Energy & Climate Intelligence Unit. Retrieved 5 January 2020.
- "Meaningless or sensible? Net zero by 2050 divides climate community". Reuters. 6 March 2020. Retrieved 7 June 2020.
- Harrabin, Roger (6 May 2020). "UK warned over coronavirus climate trap". BBC News. Retrieved 9 May 2020.
- Ng, Gabriel (23 January 2021). "Introducing the UK Emissions Trading System". Cherwell. Retrieved 2 February 2021.
- Harrabin, Roger (2 May 2019). "UK 'can cut emissions to nearly zero'". Retrieved 2 May 2019.
- Shepheard, Marcus. "UK net zero target". Institute for government. Retrieved 29 December 2020.
- "Carbon budgets: how we monitor emissions targets". committee on climate change. Retrieved 8 January 2020.
- Carbon budgets - Department of Energy and Climate Change. Decc.gov.uk. Retrieved on 2010-11-04.
- Black, Richard (9 March 2010). "Third of EU emissions 'imported'". BBC News.
- Sample, Ian (8 March 2010). "UK import emissions are the highest in Europe, figures show". The Guardian. London.
- "Analysis: UK's CO2 emissions fell for record sixth consecutive year in 2018". Carbon Brief. 4 March 2019. Retrieved 13 January 2020.
- defra Archived 26 September 2007 at the Wayback Machine, published January 2006.
- Environmental Change Institute (ECI) - Oxford University Archived 23 February 2010 at the Wayback Machine. Eci.ox.ac.uk (2006-10-24). Retrieved on 2010-11-04.
- Harrabin, Roger (24 September 2020). "Low tax on heating is bad for climate, report says". BBC News. Retrieved 24 September 2020.
- Which nations are really responsible for climate change – interactive map The Guardian 8 December 2011 (All goods and services consumed, source: Peters et al PNAS, 2011)
- Oliver, Christine (17 February 2014). "Greenhouse gas emissions from the UK". The Guardian.
- Kenen ilmasto Like Helsinki 2010: Ville Veikko Hirvelä: Päästöjä lisäävät päästövähennykset ja päästöjä aiheuttava kuluttaminen pages 35–39, ref Wiedmann, T., Wood, R., Lenzen, M., Minx, J., Guan, D. and Barrett, J. (2008) Development of an embedded carbon emissions indicator
- "What is climate change and how will it affect the UK?". City Of Bradford.
- "Climate change and the UK: Five good and bad things". BBC News. 10 December 2018.
- "UK Emissions by Sectors 2011". Archived from the original on 12 June 2013. Retrieved 26 June 2013.
- Aviation in UK June 2013
- SUMMARY: Fifth statutory report to Parliament on progress towards meeting carbon budgets REPORT June 2013
- SUMMARY IUCN UK Commission of Inquiry on Peatlands Summary of Findings October 2011
- Europe's Great Coal Collapse of 2019 Sandbag UK 18 September 2019
- Where are the architects who will put the environment first? The Guardian 31.8. 2019
- Concrete: the most destructive material on Earth The Guardian 31.8. 2019
External links