List of countries by carbon dioxide emissions
This is a list of sovereign states and territories by carbon dioxide emissions due to certain forms of human activity, based on the EDGAR database created by European Commission and Netherlands Environmental Assessment Agency released in 2018. The following table lists the 1990, 2005 and 2017 annual CO
2 emissions estimates (in Megatonnes of CO
2 per year) along with a list of calculated emissions per km2 (in tonnes of CO
2 per year) and emissions per capita (in tonnes of CO
2 per year).
%252C_variwide_chart.png.webp)
The data only consider carbon dioxide emissions from the burning of fossil fuels and cement manufacture, but not emissions from land use, land-use change and forestry. Emissions from international shipping or bunker fuels are also not included in national figures,[1] which can make a large difference for small countries with important ports. When carbon dioxide emissions from land-use change are factored in, the majority of carbon emissions since 1905 occurred in Asia, Central and Southern America, reflecting the fact that developed nations cleared their forests in earlier centuries. Land-use factors have contributed nearly a third of total cumulative anthropogenic emissions of carbon dioxide since 1850, and until as recently as 1965 was actually a greater source of emissions than the combustion of fossil fuels and production of cement.[2] The methodology for the calculations is public.[3]
The top 10 largest emitter countries account for 67.6% of the world total. Since 2006, China has been emitting more CO
2 than any other country,[4][5][6][7][8] but all being equal, to make a fair comparison of contributions, emissions in terms of CO2 per person have to be made.[9] When looking at per capita estimates, China's figures are about one eighth of the biggest CO
2 emitter and half of the United States.[10]
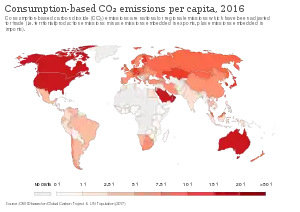
Territorial-based emissions do not account for global trade, where emissions may be imported or exported in the form of traded goods. Accordingly, a proportion of the CO
2 produced and reported in Asia and Eastern Europe is for the production of goods consumed in Western Europe and North America.[11]
According to the review of the scientific literature conducted by the Intergovernmental Panel on Climate Change (IPCC), carbon dioxide is the most important anthropogenic greenhouse gas.[12] The other major anthropogenic greenhouse gases (methane, nitrous oxide (N2O) and some fluorinated gases (sulfur hexafluoride (SF6), hydrofluorocarbons (HFCs), and perfluorocarbons (PFCs))[13]:147[14]), are not included in the following list, nor are humans emissions of water vapor (H2O), the most important greenhouse gases, as they are negligible compared to naturally occurring quantities.[15] Space-based measurements of carbon dioxide should allow independent monitoring in the mid-2020s.[16]
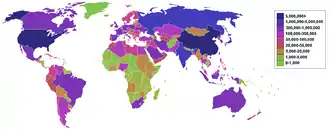
Per capita CO
2 emissions
2 emissions
.svg.png.webp) Total CO2 emissions by country/region in 2017 vs per capita emissions (top 40 countries)
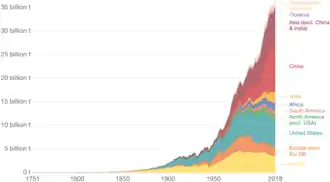
Total CO2 emissions by country/region in 2017 vs per capita emissions (top 40 countries)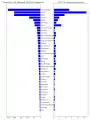 Total CO2 emissions for the period 1970 to 2017 and 2017 emissions, by country/region
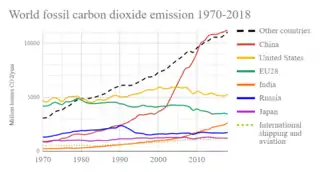
Fossil CO
2 emissions by country/region
2 emissions by country/region
.svg.png.webp)

| Country[18] | Fossil CO 2 emissions (Mt CO 2) |
Fossil CO 2 emissions |
2017 – Fossil CO 2 emissions | ||||
|---|---|---|---|---|---|---|---|
| 1990 | 2005 | 2017 | 2017 (% of world) |
2017 vs 1990: change (%) |
Per land area (t CO 2/km2/yr) |
Per capita (t CO 2/cap/yr) | |
| World | 22,674.116 | 30,049.809 | 37,077.404 | 100.00% | 63.5% | 73 | 4.9 |
| World – International Aviation | 258.941 | 422.777 | 543.381 | 1.47% | 109.8% | n/a | n/a |
| World – International Shipping | 371.804 | 572.169 | 677.248 | 1.83% | 82.2% | n/a | n/a |
| 2.546 | 1.063 | 11.422 | 0.03% | 348.6% | 18 | 0.3 | |
| 6.583 | 4.196 | 5.026 | 0.01% | -23.7% | 175 | 1.7 | |
| 65.677 | 98.197 | 159.929 | 0.43% | 143.5% | 67 | 3.9 | |
| 5.851 | 15.975 | 30.876 | 0.08% | 427.7% | 25 | 1.0 | |
| 0.006 | 0.014 | 0.028 | 0.00% | 366.7% | 308 | 1.9 | |
| 0.223 | 0.283 | 0.624 | 0.00% | 179.8% | 1,412 | 6.1 | |
| 112.434 | 165.429 | 209.968 | 0.57% | 86.7% | 76 | 4.7 | |
| 20.699 | 4.542 | 4.832 | 0.01% | -76.7% | 162 | 1.6 | |
| 0.297 | 0.470 | 0.959 | 0.00% | 222.9% | 5,328 | 9.1 | |
| 275.408 | 391.590 | 402.253 | 1.08% | 46.1% | 52 | 16.5 | |
| 62.918 | 80.994 | 72.249 | 0.19% | 14.8% | 861 | 8.3 | |
| 58.077 | 30.485 | 32.544 | 0.09% | -44.0% | 376 | 3.3 | |
| 1.524 | 2.068 | 2.997 | 0.01% | 96.7% | 215 | 7.6 | |
| 11.988 | 23.388 | 35.775 | 0.10% | 198.4% | 46,643 | 24.0 | |
| 13.868 | 38.834 | 84.546 | 0.23% | 509.6% | 573 | 0.5 | |
| 0.776 | 2.162 | 3.172 | 0.01% | 308.8% | 7,377 | 11.1 | |
| 109.069 | 61.396 | 62.340 | 0.17% | -42.8% | 300 | 6.6 | |
| 115.903 | 118.708 | 104.221 | 0.28% | -10.1% | 3,414 | 9.1 | |
| 0.188 | 0.440 | 0.440 | 0.00% | 134.0% | 19 | 1.2 | |
| 0.415 | 2.839 | 7.097 | 0.02% | 1,610.1% | 62 | 0.6 | |
| 0.335 | 0.284 | 0.429 | 0.00% | 28.1% | 7,944 | 7.0 | |
| 0.208 | 0.515 | 1.454 | 0.00% | 599.0% | 38 | 1.8 | |
| 6.287 | 9.998 | 20.462 | 0.06% | 225.5% | 19 | 1.9 | |
| 24.559 | 16.890 | 25.618 | 0.07% | 4.3% | 500 | 7.3 | |
| 2.818 | 4.465 | 7.913 | 0.02% | 180.8% | 14 | 3.5 | |
| 228.603 | 380.765 | 492.791 | 1.33% | 115.6% | 58 | 2.4 | |
| 0.026 | 0.032 | 0.149 | 0.00% | 473.1% | 987 | 4.8 | |
| 3.397 | 5.174 | 6.711 | 0.02% | 97.6% | 1,164 | 15.7 | |
| 82.271 | 52.032 | 49.568 | 0.13% | -39.8% | 447 | 7.0 | |
| 0.380 | 1.038 | 3.399 | 0.01% | 794.5% | 12 | 0.2 | |
| 0.210 | 0.307 | 0.289 | 0.00% | 37.6% | 10 | 0.0 | |
| 0.407 | 2.686 | 10.560 | 0.03% | 2,494.6% | 58 | 0.7 | |
| 7.097 | 5.520 | 9.768 | 0.03% | 37.6% | 21 | 0.4 | |
| 455.827 | 581.267 | 617.301 | 1.66% | 35.4% | 62 | 16.9 | |
| 0.049 | 0.227 | 0.955 | 0.00% | 1,849.0% | 237 | 1.7 | |
| 0.148 | 0.188 | 0.493 | 0.00% | 233.1% | 1,867 | 8.0 | |
| 0.159 | 0.246 | 0.486 | 0.00% | 205.7% | 1 | 0.1 | |
| 0.268 | 0.383 | 0.925 | 0.00% | 245.1% | 1 | 0.1 | |
| 32.654 | 59.747 | 90.325 | 0.24% | 176.6% | 119 | 5.0 | |
| 2,397.048 | 6,263.064 | 10,877.218 | 29.34% | 353.8% | 1,133 | 7.7 | |
| 51.919 | 60.610 | 74.954 | 0.20% | 44.4% | 66 | 1.5 | |
| 0.049 | 0.115 | 0.206 | 0.00% | 320.4% | 111 | 0.3 | |
| 0.902 | 4.359 | 5.514 | 0.01% | 511.3% | 16 | 1.0 | |
| 0.043 | 0.058 | 0.047 | 0.00% | 9.3% | 199 | 2.7 | |
| 2.913 | 6.306 | 8.138 | 0.02% | 179.4% | 159 | 1.7 | |
| 25.164 | 23.634 | 17.466 | 0.05% | -30.6% | 309 | 4.2 | |
| 37.109 | 26.165 | 31.277 | 0.08% | -15.7% | 285 | 2.7 | |
| 5.474 | 4.774 | 7.519 | 0.02% | 37.4% | 16,935 | 46.8 | |
| 4.540 | 7.883 | 7.035 | 0.02% | 55.0% | 760 | 6.0 | |
| 162.835 | 127.157 | 109.756 | 0.30% | -32.6% | 1,392 | 10.3 | |
| 3.441 | 2.589 | 3.496 | 0.01% | 1.6% | 1 | 0.0 | |
| 53.705 | 51.485 | 33.573 | 0.09% | -37.5% | 779 | 5.9 | |
| 1.101 | 1.469 | 1.014 | 0.00% | -7.9% | 44 | 1.1 | |
| 0.033 | 0.035 | 0.122 | 0.00% | 269.7% | 162 | 1.7 | |
| 8.024 | 19.409 | 23.111 | 0.06% | 188.0% | 475 | 2.1 | |
| 0.130 | 0.272 | 0.422 | 0.00% | 224.6% | 28 | 0.3 | |
| 16.119 | 28.320 | 39.507 | 0.11% | 145.1% | 143 | 2.4 | |
| 90.783 | 176.329 | 258.668 | 0.70% | 184.9% | 258 | 2.7 | |
| 2.633 | 6.905 | 7.857 | 0.02% | 198.4% | 373 | 1.2 | |
| 0.097 | 3.371 | 2.469 | 0.01% | 2,445.4% | 88 | 1.9 | |
| 0.214 | 0.688 | 0.737 | 0.00% | 244.4% | 6 | 0.1 | |
| 38.467 | 19.643 | 17.890 | 0.05% | -53.5% | 396 | 13.7 | |
| 0.602 | 1.541 | 1.247 | 0.00% | 107.1% | 72 | 0.9 | |
| 2.390 | 5.327 | 14.900 | 0.04% | 523.4% | 13 | 0.1 | |
| 4,409.339 | 4,249.995 | 3,548.345 | 9.57% | -19.5% | 793 | 7.0 | |
| 0.013 | 0.016 | 0.038 | 0.00% | 192.3% | 3 | 13.1 | |
| 0.001 | 0.002 | 0.002 | 0.00% | 100.0% | 1 | 23.1 | |
| 1.028 | 2.174 | 1.440 | 0.00% | 40.1% | 79 | 1.6 | |
| 57.242 | 58.360 | 46.846 | 0.13% | -18.2% | 138 | 8.5 | |
| 386.214 | 408.158 | 338.193 | 0.91% | -12.4% | 528 | 5.2 | |
| 0.371 | 0.491 | 0.719 | 0.00% | 93.8% | 9 | 2.5 | |
| 0.839 | 0.785 | 0.636 | 0.00% | -24.2% | 153 | 2.2 | |
| 4.857 | 6.394 | 6.564 | 0.02% | 35.1% | 25 | 3.2 | |
| 34.745 | 4.979 | 11.558 | 0.03% | -66.7% | 166 | 3.0 | |
| 1,018.097 | 837.284 | 796.529 | 2.15% | -21.8% | 2,230 | 9.7 | |
| 3.195 | 7.329 | 18.626 | 0.05% | 483.0% | 78 | 0.6 | |
| 0.144 | 0.406 | 0.627 | 0.00% | 335.4% | 104,500 | 18.1 | |
| 79.201 | 104.835 | 72.145 | 0.19% | -8.9% | 547 | 6.5 | |
| 0.003 | 0.631 | 0.518 | 0.00% | 17,166.7% | 0 | 9.2 | |
| 0.075 | 0.125 | 0.280 | 0.00% | 273.3% | 814 | 2.6 | |
| 0.875 | 1.035 | 2.257 | 0.01% | 157.9% | 1,386 | 5.0 | |
| 3.874 | 11.674 | 17.760 | 0.05% | 358.4% | 163 | 1.1 | |
| 1.074 | 1.119 | 2.731 | 0.01% | 154.3% | 11 | 0.2 | |
| 0.196 | 0.289 | 0.409 | 0.00% | 108.7% | 11 | 0.2 | |
| 0.337 | 0.725 | 1.771 | 0.00% | 425.5% | 8 | 2.3 | |
| 1.147 | 2.234 | 3.521 | 0.01% | 207.0% | 127 | 0.3 | |
| 2.351 | 7.806 | 10.562 | 0.03% | 349.3% | 94 | 1.1 | |
| 34.182 | 41.916 | 44.715 | 0.12% | 30.8% | 16,230 | 6.1 | |
| 71.929 | 59.758 | 50.856 | 0.14% | -29.3% | 547 | 5.2 | |
| 2.346 | 3.170 | 4.097 | 0.01% | 74.6% | 40 | 12.2 | |
| 605.968 | 1,210.754 | 2,454.774 | 6.62% | 305.1% | 747 | 1.8 | |
| 162.000 | 359.989 | 511.327 | 1.38% | 215.6% | 268 | 1.9 | |
| 206.780 | 467.905 | 671.450 | 1.81% | 224.7% | 407 | 8.3 | |
| 69.262 | 89.103 | 199.296 | 0.54% | 187.7% | 455 | 5.2 | |
| 32.852 | 47.277 | 38.914 | 0.10% | 18.5% | 554 | 8.2 | |
| 35.291 | 62.149 | 66.916 | 0.18% | 89.6% | 3,222 | 8.0 | |
| 430.762 | 498.205 | 361.176 | 0.97% | -16.2% | 1,198 | 6.1 | |
| 3.020 | 6.392 | 12.505 | 0.03% | 314.1% | 39 | 0.5 | |
| 7.525 | 10.631 | 7.546 | 0.02% | 0.3% | 687 | 2.6 | |
| 1,149.400 | 1,276.863 | 1,320.776 | 3.56% | 14.9% | 3,494 | 10.4 | |
| 10.208 | 19.755 | 24.565 | 0.07% | 140.6% | 275 | 2.5 | |
| 250.382 | 182.369 | 266.207 | 0.72% | 6.3% | 98 | 14.6 | |
| 6.467 | 8.787 | 18.594 | 0.05% | 187.5% | 32 | 0.4 | |
| 0.020 | 0.033 | 0.030 | 0.00% | 50.0% | 37 | 0.3 | |
| 31.414 | 75.218 | 97.151 | 0.26% | 209.3% | 5,452 | 23.5 | |
| 23.696 | 5.475 | 11.180 | 0.03% | -52.8% | 56 | 1.8 | |
| 0.211 | 1.038 | 2.818 | 0.01% | 1,235.5% | 12 | 0.4 | |
| 20.141 | 8.242 | 8.049 | 0.02% | -60.0% | 125 | 4.1 | |
| 5.977 | 16.505 | 23.102 | 0.06% | 286.5% | 2,210 | 3.8 | |
| 0.100 | 0.175 | 0.754 | 0.00% | 654.0% | 25 | 0.3 | |
| 0.416 | 0.473 | 1.129 | 0.00% | 171.4% | 10 | 0.2 | |
| 37.143 | 56.700 | 57.584 | 0.16% | 55.0% | 33 | 9.0 | |
| 35.314 | 14.075 | 15.311 | 0.04% | -56.6% | 234 | 5.3 | |
| 11.750 | 12.156 | 9.540 | 0.03% | -18.8% | 3,689 | 16.4 | |
| 0.982 | 1.624 | 1.280 | 0.00% | 30.3% | 40,895 | 2.1 | |
| 0.700 | 2.220 | 4.156 | 0.01% | 493.7% | 7 | 0.2 | |
| 0.457 | 1.437 | 1.572 | 0.00% | 244.0% | 13 | 0.1 | |
| 59.225 | 182.503 | 258.783 | 0.70% | 336.9% | 782 | 8.2 | |
| 0.065 | 0.479 | 0.964 | 0.00% | 1,383.1% | 3,213 | 2.2 | |
| 0.383 | 0.543 | 0.951 | 0.00% | 148.3% | 1 | 0.1 | |
| 2.352 | 2.769 | 1.876 | 0.01% | -20.2% | 5,937 | 4.4 | |
| 0.944 | 1.120 | 2.374 | 0.01% | 151.5% | 2,105 | 6.2 | |
| 0.684 | 2.911 | 2.962 | 0.01% | 333.0% | 3 | 0.7 | |
| 1.191 | 2.977 | 3.993 | 0.01% | 235.3% | 1,957 | 3.2 | |
| 290.355 | 448.171 | 507.183 | 1.37% | 74.7% | 258 | 3.9 | |
| 31.957 | 8.139 | 8.263 | 0.02% | -74.1% | 244 | 2.0 | |
| 13.151 | 11.083 | 25.747 | 0.07% | 95.8% | 16 | 8.4 | |
| 22.386 | 44.368 | 61.584 | 0.17% | 175.1% | 138 | 1.7 | |
| 1.183 | 2.703 | 7.754 | 0.02% | 555.5% | 10 | 0.3 | |
| 4.401 | 11.146 | 28.462 | 0.08% | 546.7% | 42 | 0.5 | |
| 1.542 | 2.504 | 4.299 | 0.01% | 178.8% | 5 | 1.7 | |
| 1.066 | 3.298 | 8.218 | 0.02% | 670.9% | 56 | 0.3 | |
| 161.447 | 181.433 | 174.770 | 0.47% | 8.3% | 4,176 | 10.3 | |
| 1.623 | 2.453 | 5.912 | 0.02% | 264.3% | 318 | 21.4 | |
| 24.006 | 36.746 | 36.795 | 0.10% | 53.3% | 136 | 7.8 | |
| 1.945 | 4.312 | 5.919 | 0.02% | 204.3% | 45 | 1.0 | |
| 0.875 | 0.796 | 2.497 | 0.01% | 185.4% | 2 | 0.1 | |
| 68.581 | 100.196 | 94.847 | 0.26% | 38.3% | 103 | 0.5 | |
| 131.365 | 79.568 | 37.774 | 0.10% | -71.2% | 313 | 1.5 | |
| 11.189 | 9.694 | 8.049 | 0.02% | -28.1% | 313 | 3.9 | |
| 51.454 | 55.403 | 52.492 | 0.14% | 2.0% | 145 | 10.0 | |
| 11.884 | 32.964 | 78.421 | 0.21% | 559.9% | 253 | 16.9 | |
| 66.270 | 130.354 | 197.297 | 0.53% | 197.7% | 224 | 1.0 | |
| 2.155 | 1.734 | 1.411 | 0.00% | -34.5% | 3,074 | 64.9 | |
| 2.735 | 7.204 | 12.256 | 0.03% | 348.1% | 163 | 3.0 | |
| 2.307 | 4.379 | 4.351 | 0.01% | 88.6% | 9 | 0.5 | |
| 2.263 | 3.934 | 6.535 | 0.02% | 188.8% | 16 | 1.0 | |
| 21.039 | 31.692 | 55.931 | 0.15% | 165.8% | 44 | 1.7 | |
| 43.623 | 81.261 | 137.154 | 0.37% | 214.4% | 457 | 1.3 | |
| 371.139 | 316.256 | 319.028 | 0.86% | -14.0% | 1,020 | 8.4 | |
| 43.672 | 68.077 | 56.771 | 0.15% | 30.0% | 616 | 5.5 | |
| 2.064 | 2.272 | 2.164 | 0.01% | 4.8% | 238 | 0.6 | |
| 16.291 | 43.435 | 97.787 | 0.26% | 500.3% | 8,440 | 37.1 | |
| 1.010 | 2.367 | 2.916 | 0.01% | 188.7% | 1,161 | 3.3 | |
| 187.142 | 104.713 | 81.131 | 0.22% | -56.6% | 340 | 4.1 | |
| 2,378.921 | 1,733.950 | 1,764.866 | 4.76% | -25.8% | 103 | 12.3 | |
| 0.525 | 0.748 | 1.106 | 0.00% | 110.7% | 42 | 0.1 | |
| 0.010 | 0.010 | 0.015 | 0.00% | 50.0% | 49 | 3.7 | |
| 0.034 | 0.063 | 0.238 | 0.00% | 600.0% | 912 | 4.3 | |
| 0.076 | 0.158 | 0.364 | 0.00% | 378.9% | 591 | 2.0 | |
| 0.148 | 0.031 | 0.075 | 0.00% | -49.3% | 310 | 11.9 | |
| 0.038 | 0.095 | 0.179 | 0.00% | 371.1% | 460 | 1.6 | |
| 0.129 | 0.121 | 0.147 | 0.00% | 14.0% | 52 | 0.7 | |
| 0.047 | 0.057 | 0.157 | 0.00% | 234.0% | 163 | 0.8 | |
| 166.172 | 339.441 | 638.762 | 1.72% | 284.4% | 297 | 19.4 | |
| 2.397 | 5.800 | 9.689 | 0.03% | 304.2% | 49 | 0.6 | |
| 66.388 | 61.497 | 62.487 | 0.17% | -5.9% | 612 | 6.6 | |
| 0.288 | 0.678 | 0.968 | 0.00% | 236.1% | 2,142 | 10.2 | |
| 0.741 | 0.493 | 1.309 | 0.00% | 76.7% | 18 | 0.2 | |
| 31.623 | 42.998 | 55.018 | 0.15% | 74.0% | 76,841 | 9.6 | |
| 60.537 | 42.194 | 37.855 | 0.10% | -37.5% | 772 | 6.9 | |
| 16.623 | 18.300 | 15.209 | 0.04% | -8.5% | 750 | 7.3 | |
| 0.133 | 0.187 | 0.146 | 0.00% | 9.8% | 5 | 0.2 | |
| 0.695 | 0.765 | 0.927 | 0.00% | 33.4% | 1 | 0.1 | |
| 312.463 | 433.170 | 467.654 | 1.26% | 49.7% | 383 | 8.2 | |
| 270.056 | 514.946 | 673.324 | 1.82% | 149.3% | 6,719 | 13.2 | |
| 229.966 | 368.948 | 282.364 | 0.76% | 22.8% | 558 | 6.1 | |
| 4.187 | 14.421 | 23.978 | 0.06% | 472.7% | 365 | 1.1 | |
| 5.536 | 10.773 | 21.056 | 0.06% | 280.3% | 8 | 0.4 | |
| 0.908 | 1.686 | 2.213 | 0.01% | 143.7% | 14 | 3.9 | |
| 58.117 | 55.877 | 50.874 | 0.14% | -12.5% | 113 | 5.1 | |
| 44.955 | 47.161 | 39.738 | 0.11% | -11.6% | 959 | 4.7 | |
| 33.876 | 25.582 | 28.377 | 0.08% | -16.2% | 153 | 1.6 | |
| 124.383 | 269.099 | 279.740 | 0.75% | 124.9% | 7,729 | 11.8 | |
| 12.267 | 3.263 | 5.699 | 0.02% | -53.5% | 40 | 0.6 | |
| 2.096 | 5.780 | 14.650 | 0.04% | 599.0% | 16 | 0.3 | |
| 93.009 | 225.613 | 279.296 | 0.75% | 200.3% | 544 | 4.0 | |
| 0.149 | 0.235 | 0.554 | 0.00% | 271.8% | 49 | 0.3 | |
| 0.765 | 1.327 | 2.843 | 0.01% | 271.6% | 50 | 0.4 | |
| 0.064 | 0.120 | 0.136 | 0.00% | 112.5% | 182 | 1.3 | |
| 14.895 | 34.450 | 37.745 | 0.10% | 153.4% | 7,358 | 27.6 | |
| 14.705 | 23.355 | 31.630 | 0.09% | 115.1% | 193 | 2.7 | |
| 149.893 | 246.169 | 429.563 | 1.16% | 186.6% | 548 | 5.3 | |
| 45.628 | 52.851 | 72.474 | 0.20% | 58.8% | 148 | 12.6 | |
| 0.007 | 0.005 | 0.165 | 0.00% | 2,257.1% | 174 | 4.7 | |
| 0.644 | 1.664 | 5.042 | 0.01% | 682.9% | 21 | 0.1 | |
| 783.210 | 354.429 | 205.723 | 0.55% | -73.7% | 341 | 4.7 | |
| 56.922 | 122.395 | 202.802 | 0.55% | 256.3% | 2,426 | 21.6 | |
| 589.038 | 561.543 | 379.150 | 1.02% | -35.6% | 1,564 | 5.7 | |
| 5,085.897 | 5,971.571 | 5,107.393 | 13.77% | 0.4% | 519 | 15.7 | |
| 3.893 | 5.483 | 6.930 | 0.02% | 78.0% | 39 | 2.0 | |
| 123.106 | 116.386 | 95.350 | 0.26% | -22.5% | 213 | 3.0 | |
| 0.130 | 0.063 | 0.091 | 0.00% | -30.0% | 7 | 0.3 | |
| 109.268 | 152.464 | 145.877 | 0.39% | 33.5% | 159 | 4.6 | |
| 20.182 | 99.231 | 218.729 | 0.59% | 983.8% | 660 | 2.3 | |
| 0.144 | 0.227 | 0.276 | 0.00% | 91.7% | 1 | 0.5 | |
| 6.887 | 21.768 | 12.503 | 0.03% | 81.5% | 24 | 0.4 | |
| 2.955 | 2.457 | 4.967 | 0.01% | 68.1% | 7 | 0.3 | |
| 17.178 | 11.388 | 12.087 | 0.03% | -29.6% | 31 | 0.7 | |
See also
- List of countries by carbon dioxide emissions per capita
- List of countries by electricity production from renewable sources
- List of countries by greenhouse gas emissions
- List of countries by greenhouse gas emissions per capita
- List of companies by carbon dioxide emissions per year
General:
Notes and references
- Schrooten, L; De Vlieger, Ina; Int Panis, Luc; Styns, R. Torfs, K; Torfs, R (2008). "Inventory and forecasting of maritime emissions in the Belgian sea territory, an activity based emission model". Atmospheric Environment. 42 (4): 667–676. Bibcode:2008AtmEn..42..667S. doi:10.1016/j.atmosenv.2007.09.071.
- Oak Ridge National Laboratory. "TRENDS Online - Carbon Flux to the Atmosphere from Land-Use Change". cdiac.ess-dive.lbl.gov. Carbon Dioxide Information Analysis Center. Retrieved 19 January 2020.
- "EDGAR - Methodology - European Commission". edgar.jrc.ec.europa.eu. Retrieved 31 December 2019.
- "China's Emissions: More Than U.S. Plus Europe, and Still Rising". The New York Times. 25 January 2018.
- "Chinese coal fuels rise in global carbon emissions". The Times. 14 November 2017.
- "Yes, The U.S. Leads All Countries in Reducing Carbon Emissions". Forbes. 24 October 2017.
- "World carbon dioxide emissions data by country: China speeds ahead of the rest". The Guardian. 31 January 2011.
- "China now no. 1 in CO2 emissions; USA in second position". PBL Netherlands Environmental Assessment Agency. Archived from the original on 15 August 2014.
- Roser, Max; Ritchie, Hannah (11 May 2017). "CO₂ and other Greenhouse Gas Emissions". Our World in Data. Archived from the original on 4 July 2019.
The key drawback of measuring the total national emissions is that it takes no account of the nation's population size. China is currently the world’s largest emitter and is also home to the largest population. This is expected, but this figure does not take into account China’s construction at home and abroad where new projects all over the world that are taking place as part of China’s Belt and Road Initiative. To make a population based comparison of contributions, we can only compare emissions in terms of CO2 emitted per person, but this does not include the CO2 emitted as part of these valuable infrastructure projects world wide.
- Palau at 64.9, US at 15.7, and China at 7.7 tonnes per capita in 2017. See "Fossil CO2 emissions of all world countries - 2018 Report". Publications Office of the European Union. 22 November 2018. Retrieved 10 March 2019.
- See the "CO2 embedded in trade" paragraph in Roser, Max; Ritchie, Hannah (11 May 2017). "CO₂ and other Greenhouse Gas Emissions". Our World in Data. Archived from the original on 4 July 2019.
- IPCC AR5 WG1, 2013: Summary for Policymakers, pp. 13–14. In: Climate Change 2013: The Physical Science Basis. Contribution of Working Group I to the Fifth Assessment Report of the Intergovernmental Panel on Climate Change [Stocker, T.F., D. Qin, G.-K. Plattner, M. Tignor, S.K. Allen, J. Boschung, A. Nauels, Y. Xia, V. Bex and P.M. Midgley (eds.)]. Cambridge University Press, Cambridge, United Kingdom and New York, NY, USA. Read online (pdf). From website : AR5 Synthesis Report: Climate Change 2014. Retrieved 19 January 2020
- Grubb, M. (July–September 2003). "The economics of the Kyoto protocol" (PDF). World Economics. 4 (3). Archived from the original (PDF) on 17 July 2011.
- Lerner & K. Lee Lerner, Brenda Wilmoth (2006). "Environmental issues: essential primary sources". Thomson Gale. Retrieved 11 September 2006.
- "Are our water vapour emissions warming the climate?". Physics World. 15 November 2018. Retrieved 19 January 2020.
- Pan, Guanna; Xu, Yuan; Ma, Jieqi (1 January 2021). "The potential of CO2 satellite monitoring for climate governance: A review". Journal of Environmental Management. 277: 111423. doi:10.1016/j.jenvman.2020.111423. ISSN 0301-4797. PMID 33031999.
- "Where in the world do people emit the most CO2?". Our World in Data. Retrieved 7 October 2019.
- "Fossil CO2 emissions of all world countries - 2018 Report". Publications Office of the European Union. 22 November 2018. Retrieved 10 March 2019.
External links
- Millennium Development Goals Indicators – United Nations Statistics Division
- GHG data from UNFCCC – United Nations Framework Convention on Climate Change greenhouse gas (GHG) emissions data
- CO2 emissions in kilotons – World Bank
- CO2 emissions in metric tons per capita – Google Public Data Explorer
| |||||||||||||
| |||||||||||||
| |||||||||||||
| |||||||||||||
| |||||||||||||
| |||||||||||||
| |||||||||||||