Methane emissions
Increasing methane emissions are a major contributor to the rising concentration of greenhouse gases in earth's atmosphere, and are responsible for up to one-third of near-term climate warming.[1][2] During year 2019, about 360 million tons (60 percent) of methane were released globally through human activities, while natural sources contributed about 230 million tons (40 percent).[3][4] Reducing methane emissions by capturing and utilizing the gas can produce simultaneous environmental and economic benefits.[1][5]
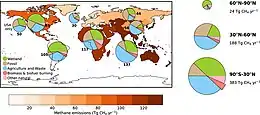
Sources of methane emissions due to human activity:
year 2020 estimates [1]
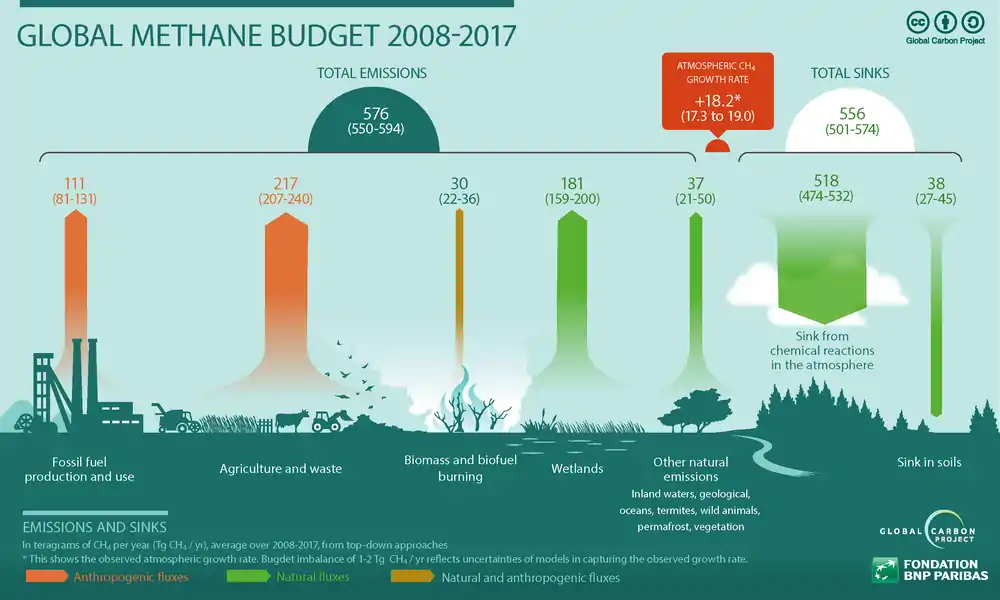
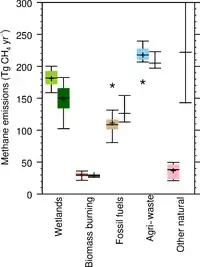
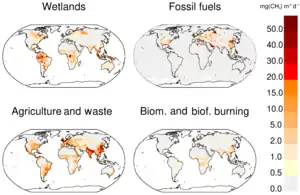
About one-third (33%) of anthropogenic emissions are from gas release during the extraction and delivery of fossil fuels; mostly due to gas venting and gas leaks. Animal agriculture is a similarly large source (30%); primarily because of enteric fermentation by ruminant livestock such as cattle and sheep. Human consumer waste flows, especially those passing through landfills and wastewater treatment, have grown to become a third major category (18%). Plant agriculture, including both food and biomass production, constitutes a fourth group (15%), with rice production being the largest single contributor.[1][6]
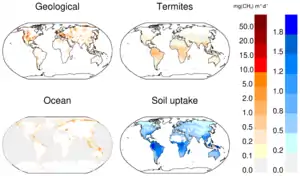
The world's wetlands contribute about three-quarters (75%) of the enduring natural sources of methane.[3][4] Seepages from near-surface fossil-fuel and clathrate hydrate deposits (unrelated to direct human action), volcanic releases, wildfires, and termite emissions account for much of the remainder.[6] Contributions from the surviving wild populations of ruminant mammals are vastly overwhelmed by those of cattle, humans, and other livestock animals.[7]
Atmospheric concentration and warming influence
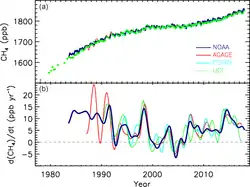
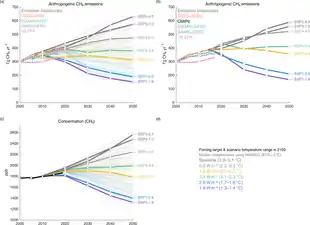
The atmospheric methane (CH4) concentration is increasing and has exceeded 1860 parts per billion as of year 2019, equal to two-and-a-half times the pre-industrial level.[9] The methane itself enables a direct radiative forcing that is second only to that of carbon dioxide (CO2).[10] Due to interactions with oxygen compounds stimulated by sunlight, CH4 can also increase the atmospheric presence of shorter-lived ozone and water vapour, which are also potent warming gases that amplify methane's near-term warming influence in a mechanism that atmospheric researchers distinguish as indirect radiative forcing.[11] When such interactions occur, longer-lived and less-potent CO2 is also produced. Including both the direct and indirect forcings, the increase in atmospheric methane is responsible for about one-third of near-term climate warming. [1][2]
To compare the warming to that from carbon dioxide over a given time period, methane in the atmospheric has an estimated 20-year global warming potential (GWP) of 85, meaning that a ton of CH4 emitted into the atmosphere creates approximately 85 times the atmospheric warming as a ton of CO2 over a period of 20 years.[12] On a 100-year timescale, the GWP is in the range of 28-34. Though methane causes far more heat to be trapped than the same mass of carbon dioxide, less than half of the emitted CH4 remains in the atmosphere after a decade. On average, carbon dioxide warms for a much longer time period assuming no change in rates of carbon sequestration.[13] [12]
List of emission sources
Abiogenic methane is stored in rocks and soil stems from the geologic processes that convert ancient biomass into fossil fuels. Biogenic methane is actively produced by microorganisms in a process called methanogenesis. Under certain conditions, the process mix responsible for a sample of methane may be deduced from the ratio of the isotopes of carbon, and through analysis methods similar to carbon dating.[14][15]
Anthropogenic
A comprehensive systems method from describing the sources of methane due to human society is known as anthropogenic metabolism. As of year 2020, the emission volumes from some sources remain more uncertain than others; due in part to localized emission spikes not captured by the limited global measurement capability. The time required for a methane emission to become well-mixed throughout earth's troposphere is about 1-2 years.[16]
| Category | Major Sources | IEA Annual Emission[3] (Million Tons) |
|---|---|---|
| Fossil fuels | Gas distribution | 45 |
| Oil wells | 39* | |
| Coal mines | 39 | |
| Biofuels | Anaerobic digestion | 11 |
| Industrial agriculture | Enteric fermentation | 145 |
| Rice paddies | ||
| Manure management | ||
| Biomass | Biomass burning | 16 |
| Consumer waste | Solid waste Landfill gas |
68 |
| Wastewater | ||
| Total anthropogenic | 363 | |
| * An additional 100 million tons (140 billion cubic meters) of gas is vented and flared each year from oil wells.[17] Additional References: [1][18][19][20][21] | ||
Natural
Natural sources have always been a part of the methane cycle. Wetland emissions have been declining due to draining for agricultural and building areas.
| Category | Major Sources | IEA Annual Emission[3] (Million Tons) |
|---|---|---|
| Wetlands | Wetland methane | 194 |
| Other natural | Geologic seepages Volcanic gas |
39 |
| Arctic melting Permafrost | ||
| Ocean sediments | ||
| Wildfires | ||
| Termites | ||
| Total natural | 233 | |
| Additional References: [1][18][19] | ||
Importance of fossil emissions
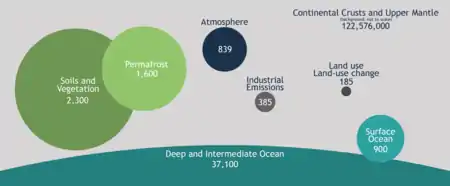
Unlike most other natural and human-caused emissions, fossil-fuel extraction and burning yields a net transfer of carbon between major storage pools in Earth's biosphere that will persist for millennia. In total, humans extracted about 400 billion tons (gigatonnes or petagrams) of geologic carbon through year 2015;[23] including half in just the last one-third century[24] and at an increasing rate of about 10 billion tons per year.[25] The magnitude of this transfer exceeds that from any other known geologic event throughout all of human history. About 50 percent of the transferred carbon presently resides in the atmosphere in the form of elevated CO2 and CH4 concentrations, while most of the remainder has been taken up by the oceans as an increase in dissolved CO2 and carbonic acid especially near the water surface.[26] By contrast, the magnitude of the terrestrial sink has remained relatively constant.[25]
This carbon redistribution is the root cause of recent rapid global warming, ocean acidification, and their resulting impacts to life.[27][28] Some of the largest effects, like sea level rise and desertification, occur over time due to the vast inertia of the Earth system. Assessing these and other environmental threats to the sustainability of human civilization are topics within Earth system science, including the recently proposed comprehensive framework of planetary boundaries.[29][30] Despite the probable crossing of multiple boundaries by the early 21st century, there has been very limited international progress towards a corresponding framework or forum for planetary management.
Global monitoring
Uncertainties in methane emissions, including so-called "super-emitter" fossil extractions[31] and unexplained atmospheric fluctuations,[32] highlight the need for improved monitoring at both regional and global scale. Satellites have recently begun to come online with capability to measure methane and other more powerful greenhouse gases with improving resolution.[33][34] The Tropomi[35] instrument launched in year 2017 by the European Space Agency can measure methane, sulphur dioxide, nitrogen dioxide, carbon monoxide, aerosol, and ozone concentrations in earth's troposphere at resolutions of several kilometers.[31][36][37] Japan's GOSAT-2 platform launched in 2018 provides similar capability.[38] The CLAIRE satellite launched in year 2016 by the Canadian firm GHGSat can resolve carbon dioxide and methane to as little as 50 meters, thus enabling its customers to pinpoint the source of emissions.[33]
National reduction policies
| Part of a series on the |
| Carbon cycle |
|---|
 |
China implemented regulations requiring coal plants to either capture methane emissions or convert methane into CO2 in 2010. According to a Nature Communications paper published in January 2019, methane emissions instead increased 50 percent between 2000 and 2015.[39][40]
In March 2020, Exxon called for stricter methane regulations, which would include detection and repair of leaks, minimization of venting and releases of unburned methane, and reporting requirements for companies.[41] However in August 2020, the U.S. Environmental Protection Agency rescinded a prior tightening of methane emission rules for the U.S. oil and gas industry.[42][43]
By country
| Country | 1970 | 2012 |
|---|---|---|
| 10,202 | 13,763 | |
| 1,764 | 2,644 | |
| 12,857 | 48,527 | |
| 7 | 13 | |
| n.a. | n.a. | |
| 23,377 | 18,974 | |
| 24 | 43 | |
| 84,918 | 88,476 | |
| 1,318 | 3,426 | |
| 10 | 23 | |
| 94,291 | 125,588 | |
| 9,022 | 8,007 | |
| 6,398 | 19,955 | |
| 94 | 227 | |
| 791 | 3,379 | |
| 91,305 | 105,142 | |
| 100 | 109 | |
| 12,125 | 16,620 | |
| 14,123 | 9,243 | |
| 96 | 228 | |
| 3,461 | 6,983 | |
| 20 | 31 | |
| 698 | 1,770 | |
| 16,509 | 23,231 | |
| 3,174 | 3,140 | |
| 5,232 | 4,448 | |
| 207,737 | 477,077 | |
| 13 | 19 | |
| 1,615 | 4,539 | |
| 9,940 | 11,794 | |
| 4,613 | 14,957 | |
| 1,469 | 2,719 | |
| 46 | 151 | |
| 20,087 | 35,915 | |
| 8,286 | 18,516 | |
| 67,296 | 106,847 | |
| 12 | 29 | |
| 28,890 | 85,677 | |
| 8,043 | 18,364 | |
| Channel Islands | n.a. | n.a. |
| 10,913 | 18,381 | |
| 781,088 | 1,752,290 | |
| 36,921 | 67,979 | |
| 142 | 284 | |
| 119,583 | 75,336 | |
| 6,677 | 7,156 | |
| 2,599 | 2,315 | |
| 7,803 | 16,266 | |
| 2,986 | 4,708 | |
| 13,600 | 8,560 | |
| n.a. | n.a. | |
| 341 | 642 | |
| 17,963 | 11,902 | |
| 7,692 | 7,603 | |
| 149 | 634 | |
| 16 | 41 | |
| 3,787 | 6,861 | |
| 6,621 | 15,786 | |
| 20,778 | 51,977 | |
| 2,239 | 3,032 | |
| 76 | 2,959 | |
| 1,797 | 2,894 | |
| 2,208 | 2,235 | |
| 32,687 | 64,481 | |
| 30 | 39 | |
| 416 | 715 | |
| 9,972 | 8,552 | |
| 82,882 | 81,179 | |
| 41 | 99 | |
| 876 | 3,894 | |
| 495 | 1,039 | |
| 3,493 | 5,019 | |
| 126,692 | 55,721 | |
| 5,230 | 21,078 | |
| 3 | 7 | |
| 5,872 | 8,255 | |
| 18 | 29 | |
| 25 | 37 | |
| 30 | 71 | |
| 3,217 | 6,877 | |
| 7,148 | 28,654 | |
| 542 | 1,421 | |
| 2,066 | 2,124 | |
| 2,956 | 4,587 | |
| 2,552 | 5,844 | |
| 704 | 3,147 | |
| 10,395 | 7,135 | |
| 308 | 359 | |
| 398,212 | 636,396 | |
| 126,665 | 223,316 | |
| 52,013 | 121,298 | |
| 19,682 | 24,351 | |
| 10,170 | 14,330 | |
| n.a. | n.a. | |
| 1,301 | 3,416 | |
| 40,488 | 35,238 | |
| 821 | 1,316 | |
| 101,804 | 38,957 | |
| 362 | 2,115 | |
| 68,238 | 71,350 | |
| 12,009 | 28,027 | |
| 5 | 16 | |
| 15,007 | 18,983 | |
| 25,949 | 32,625 | |
| n.a. | n.a. | |
| 21,910 | 12,691 | |
| 4,561 | 4,291 | |
| 6,976 | 15,011 | |
| 3,323 | 3,181 | |
| 545 | 1,150 | |
| 1,130 | 1,287 | |
| 493 | 1,586 | |
| 29,695 | 18,495 | |
| n.a. | n.a. | |
| 4,584 | 4,806 | |
| 714 | 1,169 | |
| 49 | 151 | |
| 2,033 | 1,396 | |
| 15,194 | 20,070 | |
| 3,189 | 4,629 | |
| 14,317 | 34,271 | |
| 13 | 52 | |
| 8,281 | 18,042 | |
| 98 | 141 | |
| 2 | 8 | |
| 3,157 | 6,082 | |
| 169 | 311 | |
| 60,999 | 116,705 | |
| 17 | 30 | |
| 2,068 | 3,456 | |
| n.a. | n.a. | |
| 6,735 | 6,257 | |
| n.a. | n.a. | |
| 8,486 | 12,012 | |
| 12,793 | 9,968 | |
| 75,254 | 80,637 | |
| 4,004 | 5,097 | |
| 1 | 3 | |
| 17,364 | 23,982 | |
| 20,204 | 19,026 | |
| 180 | 215 | |
| 25,054 | 28,658 | |
| 4,007 | 6,492 | |
| 5,185 | 6,858 | |
| 35,196 | 89,782 | |
| 2 | 12 | |
| 6,866 | 16,409 | |
| 4,571 | 16,858 | |
| 56,503 | 158,337 | |
| 1 | 1 | |
| 2,324 | 3,378 | |
| 948 | 2,143 | |
| 10,145 | 16,246 | |
| 13,704 | 19,321 | |
| 43,211 | 57,170 | |
| 97,174 | 65,071 | |
| 6,731 | 12,976 | |
| 1,277 | 2,406 | |
| 4,776 | 41,124 | |
| 32,425 | 25,708 | |
| 338,496 | 545,819 | |
| 1,302 | 2,942 | |
| 63 | 133 | |
| n.a. | n.a. | |
| 17 | 46 | |
| 31,740 | 62,903 | |
| 4,605 | 9,928 | |
| n.a. | n.a. | |
| 9 | 24 | |
| 2,554 | 3,352 | |
| 658 | 2,386 | |
| n.a. | n.a. | |
| 4,574 | 4,075 | |
| 2,099 | 2,822 | |
| 1,631 | 1,449 | |
| 9,542 | 16,206 | |
| 32,270 | 63,156 | |
| n.a. | n.a. | |
| 26,509 | 37,208 | |
| 11,338 | 11,864 | |
| 26 | 30 | |
| 28 | 44 | |
| n.a. | n.a. | |
| 23 | 40 | |
| 31,752 | 96,531 | |
| 941 | 709 | |
| 921 | 1,377 | |
| 10,082 | 10,304 | |
| 4,878 | 4,900 | |
| 2,425 | 12,783 | |
| 2,814 | 5,408 | |
| 25,218 | 27,994 | |
| 71,444 | 106,499 | |
| 412 | 732 | |
| 2,056 | 5,343 | |
| 32 | 61 | |
| 1,596 | 14,789 | |
| 2,531 | 7,647 | |
| 32,789 | 78,853 | |
| 10,821 | 22,009 | |
| 1 | 6 | |
| 2 | 3 | |
| 8,565 | 21,161 | |
| 74,352 | 68,061 | |
| 12,873 | 26,120 | |
| 120,054 | 58,980 | |
| 594,255 | 499,809 | |
| 14,524 | 19,549 | |
| 16,831 | 47,333 | |
| 128 | 254 | |
| 35,151 | 58,199 | |
| 54,145 | 113,564 | |
| Virgin Islands (U.S.) | 16 | 47 |
| n.a. | n.a. | |
| 2,205 | 8,940 | |
| 33,881 | 6,551 | |
| 8,497 | 8,589 | |
| World | 5,305,820 | 8,014,067 |
Removal technology
In 2019, researchers proposed a technique for removing methane from the atmosphere using zeolite. Each molecule of methane would be converted into CO
2, which has a far smaller impact on climate (99% less). Replacing all atmospheric methane with CO
2 would reduce total greenhouse gas warming by approximately one-sixth.[46]
Zeolite is a crystalline material with a porous molecular structure.[46] Powerful fans could push air through reactors of zeolite and catalysts to absorb the methane. The reactor could then be heated to form and release CO
2. At a carbon price of $500/ton, removing one ton of methane would earn $12,000.[46]
See also
References
- "Global Methane Emissions and Mitigation Opportunities" (PDF). Global Methane Initiative. 2020.
- "IPCC Fifth Assessment Report - Radiative Forcings (AR5 Figure SPM.5)". The Intergovernmental Panel on Climate Change. 2013.
- "Sources of methane emissions". International Energy Agency. 2020-08-20.
- "Global Carbon Project (GCP)". www.globalcarbonproject.org. Retrieved 2019-07-25.
- "Methane - A compelling case for action". International Energy Agency. 2020-08-20.
- "Methane, explained". National Geographic. nationalgeographic.com. 2019-01-23. Retrieved 2019-07-25.
- Vaclav Smil (2017-03-29). "Planet of the Cows". IEEE Spectrum. Retrieved 2020-09-08.
- Saunois, Marielle; Stavert, Ann R.; Poulter, Ben; Bousquet, Philippe; Canadell, Josep G.; Jackson, Robert B.; Raymond, Peter A.; Dlugokencky, Edward J.; Houweling, Sander; Patra, Prabir K.; Ciais, Philippe; Arora, Vivek K.; Bastviken, David; Bergamaschi, Peter; Blake, Donald R.; Brailsford, Gordon; Bruhwiler, Lori; Carlson, Kimberly M.; Carrol, Mark; Castaldi, Simona; Chandra, Naveen; Crevoisier, Cyril; Crill, Patrick M.; Covey, Kristofer; Curry, Charles L.; Etiope, Giuseppe; Frankenberg, Christian; Gedney, Nicola; Hegglin, Michaela I.; et al. (15 July 2020). "The Global Methane Budget 2000–2017". Earth System Science Data. 12 (3): 1561–1623. doi:10.5194/essd-12-1561-2020. ISSN 1866-3508. Retrieved 28 August 2020.
- Earth System Research Laboratory Global Monitoring Division, NOAA, May 5, 2019
- Butler J. and Montzka S. (2020). "The NOAA Annual Greenhouse Gas Index (AGGI)". NOAA Global Monitoring Laboratory/Earth System Research Laboratories.
- Boucher O, Friedlingstein P, Collins B, Shine KP (2009). "The indirect global warming potential and global temperature change potential due to methane oxidation". Environ. Res. Lett. 4 (4): 044007. doi:10.1088/1748-9326/4/4/044007.
- Myhre, G., D. Shindell, F.-M. Bréon, W. Collins, J. Fuglestvedt, J. Huang, D. Koch, J.-F. Lamarque, D. Lee, B. Mendoza, T. Nakajima, A. Robock, G. Stephens, T. Takemura and H. Zhang (2013) "Anthropogenic and Natural Radiative Forcing". Table 8.7 on page 714. In: Climate Change 2013: The Physical Science Basis. Contribution of Working Group I to the Fifth Assessment Report of the Intergovernmental Panel on Climate Change. Stocker, T.F., D. Qin, G.-K. Plattner, M. Tignor, S.K. Allen, J. Boschung, A. Nauels, Y. Xia, V. Bex and P.M. Midgley (eds.). Cambridge University Press, Cambridge, United Kingdom and New York, NY, USA. Anthropogenic and Natural Radiative Forcing
- "Understanding Global Warming Potentials". Retrieved 2019-09-09.
- Schwietzke, S., Sherwood, O., Bruhwiler, L.; et al. (2016). "Upward revision of global fossil fuel methane emissions based on isotope database". Nature. Springer Nature. 538 (7623): 88–91. doi:10.1038/nature19797. PMID 27708291. S2CID 4451521.CS1 maint: multiple names: authors list (link)
- Hmiel, B., Petrenko, V.V., Dyonisius, M.N.; et al. (2020). "Preindustrial 14CH4 indicates greater anthropogenic fossil CH4 emissions". Nature. Springer Nature. 578 (7795): 409–412. doi:10.1038/s41586-020-1991-8. PMID 32076219. S2CID 211194542.CS1 maint: multiple names: authors list (link)
- Adam Voiland and Joshua Stevens. "Methane Matters". NASA Earth Observatory. Retrieved 2020-09-15.
- "Zero Routine Flaring by 2030". World Bank. Retrieved 2020-09-18.
- "About Methane". Global Methane Initiative. Retrieved 2020-09-15.
- US EPA, OA (23 December 2015). "Overview of Greenhouse Gases". US EPA.
- "Agriculture's greenhouse gas emissions on the rise". FAO. Retrieved 2017-04-19.
- "Fossil fuel industry's methane emissions far higher than thought". The Guardian. 2016.
Emissions of the powerful greenhouse gas from coal, oil and gas are up to 60% greater than previously estimated, meaning current climate prediction models should be revised, research shows
- Kayler, Z., Janowiak, M., Swanston, C. (2017). "The Global Carbon Cycle". Considering Forest and Grassland Carbon in Land Management. General Technical Report WTO-GTR-95. United States Department of Agriculture, Forest Service. pp. 3–9.CS1 maint: multiple names: authors list (link)
- Canadell, J.G. and Schulz E.D. (2014). "Global potential of biospheric carbon management for climate mitigation" (PDF). Nature Communications. MacMillan. 5 (5282): 1–12. doi:10.1038/ncomms6282. PMID 25407959.
- Heede, R. (2014). "Tracing anthropogenic carbon dioxide and methane emissions to fossil fuel and cement producers, 1854–2010". Climatic Change. 122 (1–2): 229–241. doi:10.1007/s10584-013-0986-y.
- Friedlingstein, P., Jones, M., O'Sullivan, M.; et al. (2019). "Global carbon budget 2019" (PDF). Earth System Science Data. 11 (4): 1783–1838. doi:10.5194/essd-11-1783-2019.CS1 maint: multiple names: authors list (link)
- Feely, R. A.; Sabine, C. L.; Lee, K.; Berelson, W.; Kleypas, J.; Fabry, V. J.; Millero, F. J. (July 2004). "Impact of Anthropogenic CO2 on the CaCO3 System in the Oceans". Science. 305 (5682): 362–366. Bibcode:2004Sci...305..362F. doi:10.1126/science.1097329. PMID 15256664. S2CID 31054160. Retrieved 2014-01-25 – via Pacific Marine Environmental Laboratory (PMEL).
- "Scientific Consensus: Earth's Climate is Warming". Climate Change: Vital Signs of the Planet. NASA JPL. Archived from the original on 28 March 2020. Retrieved 29 March 2020.
- IPCC AR5 SYR (2014). The Core Writing Team; Pachauri, R. K.; Meyer, L. A. (eds.). Climate Change 2014: Synthesis Report. Contribution of Working Groups I, II and III to the Fifth Assessment Report of the Intergovernmental Panel on Climate Change. Geneva, Switzerland: IPCC.
- Rockström, Johan; et al. (2009). "Planetary Boundaries: Exploring the Safe Operating Space for Humanity". Ecology and Society. 14 (2). doi:10.5751/ES-03180-140232.
- Steffen, W.; et al. (2015). "Planetary boundaries: Guiding human development on a changing planet". Science. 347 (6223): 1259855. doi:10.1126/science.1259855. PMID 25592418.
- Hiroko Tabuchi (2019-12-16). "A Methane Leak, Seen From Space, Proves to Be Far Larger Than Thought". New York Times.
- E Roston and NS Malik (2020-04-06). "Methane emissions hit a new record and scientists can't say why". Bloomberg News.
- John Fialka (2018-03-09). "Meet the satellite that can pinpoint methane and carbon dioxide leaks". Scientific American.
- "MethaneSAT". methanesat.org. Retrieved 2020-09-10.
- "Tropomi". European Space Agency. Retrieved 2020-09-10.
- Michelle Lewis (2019-12-18). "New satellite technology reveals Ohio gas leak released 60K tons of methane". Electrek.
- Joost A de Gouw; et al. (2020). "Daily Satellite Observations of Methane from Oil and Gas Production Regions in the United States". Scientific Reports. Springer Nature (10): 1379.
- "Greenhouse gases Observing SATellite-2 "IBUKI-2" (GOSAT-2)". Japan Aerospace Exploration Agency. Retrieved 2020-10-21.
- Brooks Hays (29 January 2019). "Regulations haven't slowed China's growing methane emissions". UPI. Retrieved 31 January 2019.
China's methane emissions increased 50 percent between 2000 and 2015
- Miller, Scot M.; Michalak, Anna M.; Detmers, Robert G.; Hasekamp, Otto P.; Bruhwiler, Lori M. P.; Schwietzke, Stefan (January 29, 2019). "China's coal mine methane regulations have not curbed growing emissions". Nature Communications. 10 (1): 303. doi:10.1038/s41467-018-07891-7. PMC 6351523. PMID 30696820.
- Guzman, Joseph (2020-03-03). "Exxon calls for tighter regulations of methane". TheHill. Retrieved 2020-03-04.
- Alison Durkee (August 10, 2020). "EPA Rescinds Obama-Era Methane Rules As White House Speeds Environmental Rollbacks Ahead Of Election". Forbes.
- Emma Newburger (August 29, 2020). "Critics rail against Trump's methane proposal as an 'unconscionable assault on environment'". CNBC.
- Jackson, R B; Saunois, M; Bousquet, P; Canadell, J G; Poulter, B; Stavert, A R; Bergamaschi, P; Niwa, Y; Segers, A; Tsuruta, A (14 July 2020). "Increasing anthropogenic methane emissions arise equally from agricultural and fossil fuel sources". Environmental Research Letters. 15 (7): 071002. doi:10.1088/1748-9326/ab9ed2. ISSN 1748-9326. Retrieved 28 August 2020.
- Methane emissions (kt of CO2 equivalent), The World Bank, 2018
- Alexandru Micu (2019-05-21). "One research team proposes swapping atmospheric methane for CO2, and it might be a good idea". ZME Science. Retrieved 2019-07-17.
External links
- "Main sources of methane emissions". What's Your Impact. 2014-03-14. Retrieved 2018-03-06.
- "Greenhouse Gas Emissions - Methane Emissions". EIA. 2011-03-31. Retrieved 2018-03-06.