Hadji Panglima Tahil
Hadji Panglima Tahil, officially the Municipality of Hadji Panglima Tahil (Tausūg: Dāira sin Hadji Panglima Tahil; Tagalog: Bayan ng Hadji Panglima Tahil), is a 6th class municipality in the province of Sulu, Philippines. According to the 2015 census, it has a population of 6,375 people. [3]
Hadji Panglima Tahil | |
|---|---|
| Municipality of Hadji Panglima Tahil | |
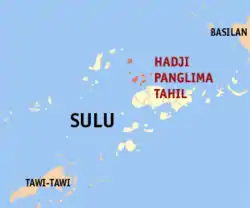 Map of Sulu with Hadji Panglima Tahil highlighted | |
OpenStreetMap 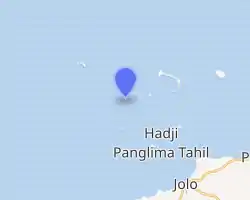
| |
.svg.png.webp) Hadji Panglima Tahil Location within the Philippines | |
| Coordinates: 6°10′N 120°55′E | |
| Country | |
| Region | Bangsamoro Autonomous Region in Muslim Mindanao (BARMM) |
| Province | Sulu |
| District | 1st District |
| Barangays | 5 (see Barangays) |
| Government | |
| • Type | Sangguniang Bayan |
| • Mayor | Moh. Mustafa S. Burahan |
| • Vice Mayor | Nasia T. Galib |
| • Representative | Samier A. Tan |
| • Electorate | 4,152 voters (2019) |
| Area | |
| • Total | 67.90 km2 (26.22 sq mi) |
| Elevation | 14 m (46 ft) |
| Highest elevation | 788 m (2,585 ft) |
| Lowest elevation | 0 m (0 ft) |
| Population | |
| • Total | 6,375 |
| • Density | 94/km2 (240/sq mi) |
| • Households | 1,091 |
| Economy | |
| • Income class | 6th municipal income class |
| • Poverty incidence | 50.05% (2015)[4] |
| • Revenue | ₱37,987,295.83 (2016) |
| Service provider | |
| • Electricity | Sulu Electric Cooperative |
| Time zone | UTC+8 (PST) |
| ZIP code | 7413 |
| PSGC | |
| IDD : area code | +63 (0)68 |
| Climate type | tropical climate |
| Native languages | Tausug Tagalog |
| Website | www |
It is formerly known as Marunggas.
As of 2000, it was the poorest municipality in the Philippines with a poverty incidence estimate of 89.7%.[5]
Barangays
Hadji Panglima Tahil is politically subdivided into 5 barangays.
- Bangas (Poblacion)
- Bubuan
- Kabuukan
- Pag-asinan
- Teomabal
Climate
| Climate data for Hadji Panglima Tahil, Sulu | |||||||||||||
|---|---|---|---|---|---|---|---|---|---|---|---|---|---|
| Month | Jan | Feb | Mar | Apr | May | Jun | Jul | Aug | Sep | Oct | Nov | Dec | Year |
| Average high °C (°F) | 27 (81) |
27 (81) |
27 (81) |
28 (82) |
29 (84) |
29 (84) |
28 (82) |
28 (82) |
28 (82) |
28 (82) |
28 (82) |
28 (82) |
28 (82) |
| Average low °C (°F) | 27 (81) |
26 (79) |
27 (81) |
27 (81) |
28 (82) |
28 (82) |
28 (82) |
28 (82) |
28 (82) |
28 (82) |
28 (82) |
27 (81) |
28 (81) |
| Average precipitation mm (inches) | 170 (6.7) |
130 (5.1) |
125 (4.9) |
122 (4.8) |
229 (9.0) |
286 (11.3) |
254 (10.0) |
248 (9.8) |
182 (7.2) |
257 (10.1) |
233 (9.2) |
188 (7.4) |
2,424 (95.5) |
| Average rainy days | 18.3 | 15.3 | 15.2 | 14.6 | 22.8 | 24.0 | 24.3 | 23.3 | 20.5 | 22.6 | 21.9 | 19.3 | 242.1 |
| Source: Meteoblue (modeled/calculated data, not measured locally)[6] | |||||||||||||
Demographics
| Year | Pop. | ±% p.a. |
|---|---|---|
| 1903 | 267 | — |
| 1918 | 4,296 | +20.35% |
| 1939 | 1,998 | −3.58% |
| 1948 | 1,850 | −0.85% |
| 1960 | 671 | −8.10% |
| 1970 | 1,341 | +7.16% |
| 1975 | 4,178 | +25.60% |
| 1980 | 4,325 | +0.69% |
| 1990 | 4,153 | −0.41% |
| 1995 | 4,419 | +1.17% |
| 2000 | 5,314 | +4.03% |
| 2007 | 6,192 | +2.13% |
| 2010 | 5,850 | −2.05% |
| 2015 | 6,375 | +1.65% |
| Source: Philippine Statistics Authority [3] [7] [8][9] | ||
Economy
| Poverty Incidence of Hadji Panglima Tahil | |
| Source: Philippine Statistics Authority[10][11][12][13] | |
References
- Municipality of Hadji Panglima Tahil | (DILG)
- "Province: Sulu". PSGC Interactive. Quezon City, Philippines: Philippine Statistics Authority. Retrieved 12 November 2016.
- Census of Population (2015). "ARMM – Autonomous Region in Muslim Mindanao". Total Population by Province, City, Municipality and Barangay. PSA. Retrieved 20 June 2016.
- https://psa.gov.ph/sites/default/files/City%20and%20Municipal-level%20Small%20Area%20Poverty%20Estimates_%202009%2C%202012%20and%202015_0.xlsx; publication date: 10 July 2019; publisher: Philippine Statistics Authority.
- "Archived copy". Archived from the original on 2007-07-01. Retrieved 2007-02-06.CS1 maint: archived copy as title (link)
- "Hadji Panglima Tahil, Sulu : Average Temperatures and Rainfall". Meteoblue. Retrieved 31 January 2019.
- Census of Population and Housing (2010). "ARMM – Autonomous Region in Muslim Mindanao". Total Population by Province, City, Municipality and Barangay. NSO. Retrieved 29 June 2016.
- Censuses of Population (1903–2007). "ARMM – Autonomous Region in Muslim Mindanao". Table 1. Population Enumerated in Various Censuses by Province/Highly Urbanized City: 1903 to 2007. NSO.
- "Province of Sulu". Municipality Population Data. Local Water Utilities Administration Research Division. Retrieved 17 December 2016.
- "Poverty incidence (PI):". Philippine Statistics Authority. Retrieved 28 December 2020.
- https://psa.gov.ph/sites/default/files/2006%20and%202009%20City%20and%20Municipal%20Level%20Poverty%20Estimates_0_1.pdf; publication date: 3 August 2012; publisher: Philippine Statistics Authority.
- https://psa.gov.ph/sites/default/files/2012%20Municipal%20and%20City%20Level%20Poverty%20Estima7tes%20Publication%20%281%29.pdf; publication date: 31 May 2016; publisher: Philippine Statistics Authority.
- https://psa.gov.ph/sites/default/files/City%20and%20Municipal-level%20Small%20Area%20Poverty%20Estimates_%202009%2C%202012%20and%202015_0.xlsx; publication date: 10 July 2019; publisher: Philippine Statistics Authority.
External links
- Hadji Panglima Tahil Profile at PhilAtlas.com
- Philippine Standard Geographic Code
- Philippine Census Information
- Local Governance Performance Management System
Places adjacent to Hadji Panglima Tahil | |
|---|---|
Jolo (capital) | |
| Municipalities | |
This article is issued from Wikipedia. The text is licensed under Creative Commons - Attribution - Sharealike. Additional terms may apply for the media files.
