Indanan
Indanan, officially the Municipality of Indanan (Tausūg: Dāira sin Indanan; Tagalog: Bayan ng Indanan), is a 3rd class municipality in the province of Sulu, Philippines. According to the 2015 census, it has a population of 80,883 people. [3]
Indanan | |
|---|---|
| Municipality of Indanan | |
 Seal | |
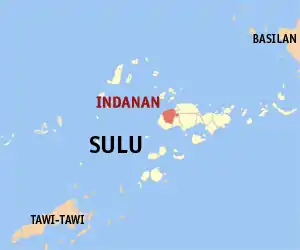 Map of Sulu with Indanan highlighted | |
OpenStreetMap 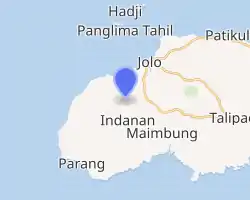
| |
.svg.png.webp) Indanan Location within the Philippines | |
| Coordinates: 6°00′N 120°58′E | |
| Country | |
| Region | Bangsamoro Autonomous Region in Muslim Mindanao (BARMM) |
| Province | Sulu |
| District | 1st District |
| Barangays | 34 (see Barangays) |
| Government | |
| • Type | Sangguniang Bayan |
| • Mayor | Hermot D. Jikiri |
| • Vice Mayor | Vladimir I. Nahudan |
| • Representative | Samier A. Tan |
| • Electorate | 31,801 voters (2019) |
| Area | |
| • Total | 170.72 km2 (65.92 sq mi) |
| Elevation | 202 m (663 ft) |
| Highest elevation | 798 m (2,618 ft) |
| Lowest elevation | 0 m (0 ft) |
| Population | |
| • Total | 80,883 |
| • Density | 470/km2 (1,200/sq mi) |
| • Households | 13,848 |
| Economy | |
| • Income class | 3rd municipal income class |
| • Poverty incidence | 50.15% (2015)[4] |
| • Revenue | ₱122,969,035.36 (2016) |
| Service provider | |
| • Electricity | Sulu Electric Cooperative |
| Time zone | UTC+8 (PST) |
| ZIP code | 7407 |
| PSGC | |
| IDD : area code | +63 (0)68 |
| Climate type | tropical climate |
| Native languages | Tausug Tagalog |
| Website | www |
Barangays
Indanan is politically subdivided into 34 barangays.
- Adjid
- Bangalan
- Bato-bato
- Buanza
- Bud-Taran
- Bunut
- Jati-Tunggal
- Kabbon Maas
- Kagay
- Kajatian
- Kan Islam
- Kandang Tukay
- Karawan
- Katian
- Kuppong
- Lambayong
- Langpas
- Licup
- Malimbaya
- Manggis
- Manilop
- Paligue
- Panabuan
- Panglima Misuari (Sasak)
- Pasil
- Poblacion (Indanan)
- Sapah Malaum
- Sawaki
- Sionogan
- Tagbak
- Timbangan
- Tubig Dakulah
- Tubig Parang
- Tumantangis
Climate
| Climate data for Indanan, Sulu | |||||||||||||
|---|---|---|---|---|---|---|---|---|---|---|---|---|---|
| Month | Jan | Feb | Mar | Apr | May | Jun | Jul | Aug | Sep | Oct | Nov | Dec | Year |
| Average high °C (°F) | 26 (79) |
25 (77) |
26 (79) |
27 (81) |
27 (81) |
27 (81) |
27 (81) |
27 (81) |
27 (81) |
27 (81) |
27 (81) |
27 (81) |
27 (80) |
| Average low °C (°F) | 26 (79) |
25 (77) |
26 (79) |
26 (79) |
27 (81) |
27 (81) |
27 (81) |
27 (81) |
27 (81) |
27 (81) |
26 (79) |
26 (79) |
26 (80) |
| Average precipitation mm (inches) | 170 (6.7) |
130 (5.1) |
125 (4.9) |
122 (4.8) |
229 (9.0) |
286 (11.3) |
254 (10.0) |
248 (9.8) |
182 (7.2) |
257 (10.1) |
233 (9.2) |
188 (7.4) |
2,424 (95.5) |
| Average rainy days | 18.3 | 15.3 | 15.2 | 14.6 | 22.8 | 24.0 | 24.3 | 23.3 | 20.5 | 22.6 | 21.9 | 19.3 | 242.1 |
| Source: Meteoblue (modeled/calculated data, not measured locally)[5] | |||||||||||||
Demographics
|
| |||||||||||||||||||||||||||||||||||||||||||||
| Source: Philippine Statistics Authority [3] [6] [7][8] | ||||||||||||||||||||||||||||||||||||||||||||||
References
- Municipality of Indanan | (DILG)
- "Province: Sulu". PSGC Interactive. Quezon City, Philippines: Philippine Statistics Authority. Retrieved 12 November 2016.
- Census of Population (2015). "ARMM – Autonomous Region in Muslim Mindanao". Total Population by Province, City, Municipality and Barangay. PSA. Retrieved 20 June 2016.
- https://psa.gov.ph/sites/default/files/City%20and%20Municipal-level%20Small%20Area%20Poverty%20Estimates_%202009%2C%202012%20and%202015_0.xlsx; publication date: 10 July 2019; publisher: Philippine Statistics Authority.
- "Indanan, Sulu : Average Temperatures and Rainfall". Meteoblue. Retrieved 31 January 2019.
- Census of Population and Housing (2010). "ARMM – Autonomous Region in Muslim Mindanao". Total Population by Province, City, Municipality and Barangay. NSO. Retrieved 29 June 2016.
- Censuses of Population (1903–2007). "ARMM – Autonomous Region in Muslim Mindanao". Table 1. Population Enumerated in Various Censuses by Province/Highly Urbanized City: 1903 to 2007. NSO.
- "Province of Sulu". Municipality Population Data. Local Water Utilities Administration Research Division. Retrieved 17 December 2016.
- "Poverty incidence (PI):". Philippine Statistics Authority. Retrieved 28 December 2020.
- https://psa.gov.ph/sites/default/files/NSCB_LocalPovertyPhilippines_0.pdf; publication date: 29 November 2005; publisher: Philippine Statistics Authority.
- https://psa.gov.ph/sites/default/files/2003%20SAE%20of%20poverty%20%28Full%20Report%29_1.pdf; publication date: 23 March 2009; publisher: Philippine Statistics Authority.
- https://psa.gov.ph/sites/default/files/2006%20and%202009%20City%20and%20Municipal%20Level%20Poverty%20Estimates_0_1.pdf; publication date: 3 August 2012; publisher: Philippine Statistics Authority.
- https://psa.gov.ph/sites/default/files/2012%20Municipal%20and%20City%20Level%20Poverty%20Estima7tes%20Publication%20%281%29.pdf; publication date: 31 May 2016; publisher: Philippine Statistics Authority.
- https://psa.gov.ph/sites/default/files/City%20and%20Municipal-level%20Small%20Area%20Poverty%20Estimates_%202009%2C%202012%20and%202015_0.xlsx; publication date: 10 July 2019; publisher: Philippine Statistics Authority.
This article is issued from Wikipedia. The text is licensed under Creative Commons - Attribution - Sharealike. Additional terms may apply for the media files.
