Pangutaran
Pangutaran, officially the Municipality of Pangutaran (Tausūg: Dāira sin Pangutaran; Tagalog: Bayan ng Pangutaran), is a 4th class municipality in the province of Sulu, Philippines. According to the 2015 census, it has a population of 30,613 people. [3]
Pangutaran | |
|---|---|
| Municipality of Pangutaran | |
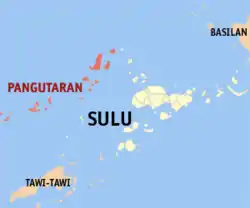 Map of Sulu with Pangutaran highlighted | |
OpenStreetMap 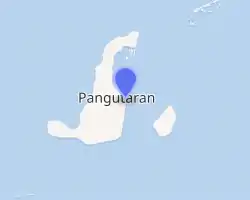
| |
.svg.png.webp) Pangutaran Location within the Philippines | |
| Coordinates: 6°18′N 120°35′E | |
| Country | |
| Region | Bangsamoro Autonomous Region in Muslim Mindanao (BARMM) |
| Province | Sulu |
| District | 1st District |
| Barangays | 16 (see Barangays) |
| Government | |
| • Type | Sangguniang Bayan |
| • Mayor | Asri S. Taib |
| • Vice Mayor | Alradzmin A. Nanoh |
| • Representative | Samier A. Tan |
| • Electorate | 17,826 voters (2019) |
| Area | |
| • Total | 258.10 km2 (99.65 sq mi) |
| Elevation | 1.0 m (3.3 ft) |
| Highest elevation | 565 m (1,854 ft) |
| Lowest elevation | 0 m (0 ft) |
| Population | |
| • Total | 30,613 |
| • Density | 120/km2 (310/sq mi) |
| • Households | 5,235 |
| Economy | |
| • Income class | 4th municipal income class |
| • Poverty incidence | 48.34% (2015)[4] |
| • Revenue | ₱93,127,122.48 (2016) |
| Service provider | |
| • Electricity | Sulu Electric Cooperative |
| Time zone | UTC+8 (PST) |
| ZIP code | 7414 |
| PSGC | |
| IDD : area code | +63 (0)68 |
| Climate type | tropical climate |
| Native languages | Pangutaran Sama Tausug Tagalog |
Barangays
Pangutaran is politically subdivided into 16 barangays.
- Alu Bunah
- Bangkilay
- Kawitan
- Kehi Niog
- Lantong Babag
- Lumah Dapdap
- Pandan Niog
- Panducan
- Panitikan
- Patutol
- Se-ipang
- Simbahan (Poblacion)
- Suang Bunah
- Tonggasang
- Tubig Nonok
- Tubig Sallang
Climate
| Climate data for Pangutaran, Sulu | |||||||||||||
|---|---|---|---|---|---|---|---|---|---|---|---|---|---|
| Month | Jan | Feb | Mar | Apr | May | Jun | Jul | Aug | Sep | Oct | Nov | Dec | Year |
| Average high °C (°F) | 29 (84) |
29 (84) |
29 (84) |
30 (86) |
30 (86) |
30 (86) |
30 (86) |
30 (86) |
30 (86) |
30 (86) |
29 (84) |
29 (84) |
30 (85) |
| Average low °C (°F) | 25 (77) |
24 (75) |
24 (75) |
25 (77) |
25 (77) |
25 (77) |
25 (77) |
25 (77) |
25 (77) |
25 (77) |
25 (77) |
25 (77) |
25 (77) |
| Average precipitation mm (inches) | 157 (6.2) |
115 (4.5) |
123 (4.8) |
96 (3.8) |
136 (5.4) |
120 (4.7) |
104 (4.1) |
89 (3.5) |
86 (3.4) |
131 (5.2) |
151 (5.9) |
159 (6.3) |
1,467 (57.8) |
| Average rainy days | 20.4 | 17.5 | 20.4 | 21.1 | 26.7 | 25.7 | 26.0 | 24.5 | 24.0 | 27.7 | 26.3 | 24.7 | 285 |
| Source: Meteoblue (modeled/calculated data, not measured locally)[5] | |||||||||||||
Demographics
|
| ||||||||||||||||||||||||||||||||||||||||||||||||
| Source: Philippine Statistics Authority [3] [6] [7][8] | |||||||||||||||||||||||||||||||||||||||||||||||||
Economy
| Poverty Incidence of Pangutaran | |
| Source: Philippine Statistics Authority[9][10][11][12][13][14] | |
References
- Municipality of Pangutaran | (DILG)
- "Province: Sulu". PSGC Interactive. Quezon City, Philippines: Philippine Statistics Authority. Retrieved 12 November 2016.
- Census of Population (2015). "ARMM – Autonomous Region in Muslim Mindanao". Total Population by Province, City, Municipality and Barangay. PSA. Retrieved 20 June 2016.
- https://psa.gov.ph/sites/default/files/City%20and%20Municipal-level%20Small%20Area%20Poverty%20Estimates_%202009%2C%202012%20and%202015_0.xlsx; publication date: 10 July 2019; publisher: Philippine Statistics Authority.
- "Pangutaran, Sulu : Average Temperatures and Rainfall". Meteoblue. Retrieved 31 January 2019.
- Census of Population and Housing (2010). "ARMM – Autonomous Region in Muslim Mindanao". Total Population by Province, City, Municipality and Barangay. NSO. Retrieved 29 June 2016.
- Censuses of Population (1903–2007). "ARMM – Autonomous Region in Muslim Mindanao". Table 1. Population Enumerated in Various Censuses by Province/Highly Urbanized City: 1903 to 2007. NSO.
- "Province of Sulu". Municipality Population Data. Local Water Utilities Administration Research Division. Retrieved 17 December 2016.
- "Poverty incidence (PI):". Philippine Statistics Authority. Retrieved 28 December 2020.
- https://psa.gov.ph/sites/default/files/NSCB_LocalPovertyPhilippines_0.pdf; publication date: 29 November 2005; publisher: Philippine Statistics Authority.
- https://psa.gov.ph/sites/default/files/2003%20SAE%20of%20poverty%20%28Full%20Report%29_1.pdf; publication date: 23 March 2009; publisher: Philippine Statistics Authority.
- https://psa.gov.ph/sites/default/files/2006%20and%202009%20City%20and%20Municipal%20Level%20Poverty%20Estimates_0_1.pdf; publication date: 3 August 2012; publisher: Philippine Statistics Authority.
- https://psa.gov.ph/sites/default/files/2012%20Municipal%20and%20City%20Level%20Poverty%20Estima7tes%20Publication%20%281%29.pdf; publication date: 31 May 2016; publisher: Philippine Statistics Authority.
- https://psa.gov.ph/sites/default/files/City%20and%20Municipal-level%20Small%20Area%20Poverty%20Estimates_%202009%2C%202012%20and%202015_0.xlsx; publication date: 10 July 2019; publisher: Philippine Statistics Authority.
External links
- Pangutaran Profile at PhilAtlas.com
- Philippine Standard Geographic Code
- Philippine Census Information
- Local Governance Performance Management System
Places adjacent to Pangutaran | |
|---|---|
Jolo (capital) | |
| Municipalities | |
This article is issued from Wikipedia. The text is licensed under Creative Commons - Attribution - Sharealike. Additional terms may apply for the media files.
