Jonquière (provincial electoral district)
Jonquière is a provincial electoral district in the Saguenay–Lac-Saint-Jean region of Quebec, Canada that elects members to the National Assembly of Quebec. It is located within the city of Saguenay and consists of most of the borough of Jonquière.
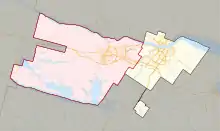 Location in Saguenay | |||
| Provincial electoral district | |||
| Legislature | National Assembly of Quebec | ||
| MNA |
Parti Québécois | ||
| District created | 1965 | ||
| First contested | 1966 | ||
| Last contested | 2018 | ||
| Demographics | |||
| Electors (2014)[1] | 45,648 | ||
| Area (km²)[2] | 409.3 | ||
| Census division(s) | Le Saguenay-et-son-Fjord (part) | ||
| Census subdivision(s) | Saguenay (part) | ||
It was created for the 1966 election from a part of Jonquière-Kénogami electoral district.
In the change from the 2001 to the 2011 electoral map, it lost a small amount of territory to Dubuc.
Members of the Legislative Assembly / National Assembly
| Legislature | Years | Member | Party | |
|---|---|---|---|---|
| Riding created from Jonquière-Kénogami | ||||
| 28th | 1966–1970 | Gérald Harvey | Liberal | |
| 29th | 1970–1973 | |||
| 30th | 1973–1976 | |||
| 31st | 1976–1981 | Claude Vaillancourt | Parti Québécois | |
| 32nd | 1981–1983 | |||
| 1983–1985 | Aline Saint-Amand | Liberal | ||
| 33rd | 1985–1989 | Francis Dufour | Parti Québécois | |
| 34th | 1989–1994 | |||
| 35th | 1994–1996 | |||
| 1996–1998 | Lucien Bouchard | |||
| 36th | 1998–2001 | |||
| 2001–2003 | Françoise Gauthier | Liberal | ||
| 37th | 2003–2007 | |||
| 38th | 2007–2008 | Sylvain Gaudreault | Parti Québécois | |
| 39th | 2008–2012 | |||
| 40th | 2012–2014 | |||
| 41st | 2014–2018 | |||
| 42nd | 2018–Present | |||
Election results
| 2018 Quebec general election | ||||||||
|---|---|---|---|---|---|---|---|---|
| Party | Candidate | Votes | % | ±% | ||||
| Parti Québécois | Sylvain Gaudreault | 14,887 | 48.35 | +4.83 | ||||
| Coalition Avenir Québec | Benoit Rochefort | 9,997 | 32.47 | +8.86 | ||||
| Liberal | Alexandre Duguay | 3,029 | 9.84 | -16.79 | ||||
| Québec solidaire | Marcel Lapointe | 2,242 | 7.28 | +2.09 | ||||
| Conservative | Jimmy Voyer | 337 | 1.09 | - | ||||
| Green | Julie Sion | 296 | 0.96 | - | ||||
| Total valid votes | 30,788 | 98.60 | ||||||
| Total rejected ballots | 438 | 1.40 | ||||||
| Turnout | 31,226 | 69.25 | ||||||
| Eligible voters | 45,091 | |||||||
| 2014 Quebec general election | ||||||||
|---|---|---|---|---|---|---|---|---|
| Party | Candidate | Votes | % | |||||
| Parti Québécois | Sylvain Gaudreault | 13,487 | 43.52 | |||||
| Liberal | Tommy Pageau | 8,254 | 26.63 | |||||
| Coalition Avenir Québec | Mélanie Boucher | 7,318 | 23.61 | |||||
| Québec solidaire | Réjean Dumais | 1,608 | 5.19 | |||||
| Option nationale | Nicolas Beaulieu | 326 | 1.05 | |||||
| Total valid votes | 30,993 | 97.67 | ||||||
| Total rejected ballots | 738 | 2.33 | ||||||
| Turnout | 31,731 | 70.00 | ||||||
| Electors on the lists | 45,648 | – | ||||||
| 2012 Quebec general election | ||||||||
|---|---|---|---|---|---|---|---|---|
| Party | Candidate | Votes | % | |||||
| Parti Québécois | Sylvain Gaudreault | 16,429 | 48.22 | |||||
| Coalition Avenir Québec | Pierre-Olivier Simard | 8,540 | 25.07 | |||||
| Liberal | Martine Girard | 6,833 | 20.06 | |||||
| Québec solidaire | Réjean Dumais | 1,089 | 3.20 | |||||
| Option nationale | Sébastien Lévesque | 427 | 1.25 | |||||
| Parti nul | Alain Létourneau | 269 | 0.79 | |||||
| Quebec Citizens' Union | Alexis St-Gelais | 265 | 0.78 | |||||
| Independent | Tommy Gagnon | 218 | 0.64 | |||||
| Total valid votes | 34,070 | 98.80 | ||||||
| Total rejected ballots | 413 | 1.20 | ||||||
| Turnout | 34,483 | 76.13 | ||||||
| Electors on the lists | 45,294 | – | ||||||
| Party | Candidate | Votes | % | ±% | |
|---|---|---|---|---|---|
| Parti Québécois | Sylvain Gaudreault | 13,077 | 47.52 | ||
| Liberal | Martine Girard | 10,367 | 37.67 | ||
| Action démocratique | Marc Jomphe | 2,913 | 10.58 | ||
| Québec solidaire | Gabrielle Desbiens | 1,164 | 4.23 | ||
| 2007 Quebec general election | ||||||||
|---|---|---|---|---|---|---|---|---|
| Party | Candidate | Votes | % | |||||
| Parti Québécois | Sylvain Gaudreault | 12,851 | 39.33 | |||||
| Liberal | Françoise Gauthier | 11,576 | 35.43 | |||||
| Action démocratique | Marc Jomphe | 6,634 | 20.30 | |||||
| Québec solidaire | Sylvain Bergeron | 839 | 2.57 | |||||
| Green | Dominic Rouette | 703 | 2.15 | |||||
| Independent | Pierre Laliberté | 71 | 0.22 | |||||
| Total valid votes | 32,674 | 99.17 | ||||||
| Total rejected ballots | 275 | 0.83 | ||||||
| Turnout | 32,949 | 74.87 | ||||||
| Electors on the lists | 44,011 | – | ||||||
| 2003 Quebec general election | ||||||||
|---|---|---|---|---|---|---|---|---|
| Party | Candidate | Votes | % | |||||
| Liberal | Françoise Gauthier | 13,826 | 44.42 | |||||
| Parti Québécois | Myrtha Laflamme | 11,386 | 36.58 | |||||
| Action démocratique | Réjean Laforest | 5,216 | 16.76 | |||||
| Bloc Pot | Batiste W. Foisy | 368 | 1.18 | |||||
| UFP | Michel Perron | 330 | 1.06 | |||||
| Total valid votes | 31,126 | 98.93 | ||||||
| Total rejected ballots | 337 | 1.07 | ||||||
| Turnout | 31,463 | 70.68 | ||||||
| Electors on the lists | 44,515 | – | ||||||
| Quebec provincial by-election, 2001 | ||||||||
|---|---|---|---|---|---|---|---|---|
| Party | Candidate | Votes | % | |||||
| Liberal | Françoise Gauthier | 13,077 | 46.54 | |||||
| Parti Québécois | Nicole Racine | 8,830 | 31.42 | |||||
| Action démocratique | Michèle Boulianne | 5,391 | 19.18 | |||||
| RAP | Gilbert Talbot | 480 | 1.71 | |||||
| Bloc Pot | Marc-Boris St-Maurice | 323 | 1.15 | |||||
| Total valid votes | 28,101 | 99.04 | ||||||
| Total rejected ballots | 273 | 0.96 | ||||||
| Turnout | 28,374 | 63.45 | ||||||
| Electors on the lists | 44,716 | – | ||||||
| 1998 Quebec general election | ||||||||
|---|---|---|---|---|---|---|---|---|
| Party | Candidate | Votes | % | |||||
| Parti Québécois | Lucien Bouchard | 20,475 | 60.48 | |||||
| Liberal | Guylaine Caron | 6,552 | 19.35 | |||||
| Independent RAP | Michel Chartrand | 5,023 | 14.84 | |||||
| Action démocratique | Hélène Vigneault | 1,686 | 4.98 | |||||
| Natural Law | Sylvain Bergeron | 120 | 0.35 | |||||
| Total valid votes | 33,856 | 99.12 | ||||||
| Total rejected ballots | 302 | 0.88 | ||||||
| 34,158 | 76.91 | |||||||
| Electors on the lists | 44,415 | – | ||||||
| Quebec provincial by-election, 1996 | ||||||||
|---|---|---|---|---|---|---|---|---|
| Party | Candidate | Votes | % | |||||
| Parti Québécois | Lucien Bouchard | 24,900 | 94.82 | |||||
| CANADA! | George Butcher | 484 | 1.84 | |||||
| Natural Law | Normand Dufour | 222 | 0.85 | |||||
| Independent | Stéphane Guy Maurice Gagnon | 215 | 0.82 | |||||
| Independent | Claude Gagnon | 198 | 0.75 | |||||
| Socialist Democracy | Gervais Tremblay | 185 | 0.70 | |||||
| Independent | Jolly Taylor | 57 | 0.22 | |||||
| Total valid votes | 26,261 | 98.72 | ||||||
| Total rejected ballots | 341 | 1.28 | ||||||
| 26,602 | 60.99 | |||||||
| Electors on the lists | 43,614 | – | ||||||
| 1995 Quebec referendum | |||
|---|---|---|---|
| Side | Votes | % | |
| Oui | 28,385 | 71.02 | |
| Non | 11,584 | 28.98 | |
| 1994 Quebec general election | ||||||||
|---|---|---|---|---|---|---|---|---|
| Party | Candidate | Votes | % | |||||
| Parti Québécois | Francis Dufour | 22,598 | 69.64 | |||||
| Liberal | Stéphane Dallaire | 8,703 | 26.74 | |||||
| Natural Law | Sylvie Francoeur | 1,248 | 3.83 | |||||
| Total valid votes | 32,549 | 97.01 | ||||||
| Total rejected ballots | 1,002 | 2.99 | ||||||
| 33,551 | 80.03 | |||||||
| Electors on the lists | 41,921 | – | ||||||
| 1992 Charlottetown Accord referendum | |||
|---|---|---|---|
| Side | Votes | % | |
| Non | 27,001 | 77.31 | |
| Oui | 7,926 | 22.69 | |
| 1989 Quebec general election | ||||||||
|---|---|---|---|---|---|---|---|---|
| Party | Candidate | Votes | % | |||||
| Parti Québécois | Francis Dufour | 17,294 | 56.05 | |||||
| Liberal | Aline St-Amand | 11,789 | 38.21 | |||||
| New Democratic | Maurice Bilodeau | 1,774 | 5.75 | |||||
| Total valid votes | 30,857 | 97.63 | ||||||
| Total rejected ballots | 750 | 2.37 | ||||||
| 31,607 | 76.16 | |||||||
| Electors on the lists | 41,502 | – | ||||||
| 1985 Quebec general election | ||||||||
|---|---|---|---|---|---|---|---|---|
| Party | Candidate | Votes | % | |||||
| Parti Québécois | Francis Dufour | 17,741 | 52.51 | |||||
| Liberal | Aline St-Amand | 14,130 | 41.82 | |||||
| New Democratic | Maurice Bilodeau | 1,784 | 5.28 | |||||
| Christian Socialist | Jean-Pierre Rannou | 132 | 0.39 | |||||
| Total valid votes | 33,787 | 98.70 | ||||||
| Total rejected ballots | 444 | 1.30 | ||||||
| 34,231 | 79.86 | |||||||
| Electors on the lists | 42,864 | – | ||||||
| Quebec provincial by-election, 1983 | ||||||||
|---|---|---|---|---|---|---|---|---|
| Party | Candidate | Votes | % | |||||
| Liberal | Aline St-Amand | 16,338 | 52.09 | |||||
| Parti Québécois | Céline Gagnon | 15,028 | 47.91 | |||||
| Total valid votes | 31,366 | 97.66 | ||||||
| Total rejected ballots | 751 | 2.34 | ||||||
| 32,117 | 75.17 | |||||||
| Electors on the lists | 42,725 | – | ||||||
| 1981 Quebec general election | ||||||||
|---|---|---|---|---|---|---|---|---|
| Party | Candidate | Votes | % | |||||
| Parti Québécois | Claude Vaillancourt | 23,562 | 65.99 | |||||
| Liberal | André Harvey | 11,327 | 31.72 | |||||
| Union Nationale | Jacques Trahan | 582 | 1.63 | |||||
| Workers Communist | Edouard Lavallière | 235 | 0.66 | |||||
| Total valid votes | 35,706 | 99.06 | ||||||
| Total rejected ballots | 338 | 0.94 | ||||||
| 36,044 | 83.63 | |||||||
| Electors on the lists | 43,099 | – | ||||||
| 1980 Quebec referendum | |||
|---|---|---|---|
| Side | Votes | % | |
| Oui | 22,058 | 60.74 | |
| Non | 14,25 | 39.26 | |
| 1976 Quebec general election | ||||||||
|---|---|---|---|---|---|---|---|---|
| Party | Candidate | Votes | % | |||||
| Parti Québécois | Claude Vaillancourt | 20,373 | 58.23 | |||||
| Liberal | Gérald Harvey | 10,682 | 31.04 | |||||
| Union Nationale | Roselda Duguay Brassard | 2,220 | 6.34 | |||||
| Ralliement créditiste | Serge Racine | 1,535 | 4.39 | |||||
| Total valid votes | 34,990 | 98.31 | ||||||
| Total rejected ballots | 600 | 1.69 | ||||||
| 35,590 | 89.26 | |||||||
| Electors on the lists | 39,873 | – | ||||||
| 1973 Quebec general election | ||||||||
|---|---|---|---|---|---|---|---|---|
| Party | Candidate | Votes | % | |||||
| Liberal | Gérald Harvey | 16,985 | 53.71 | |||||
| Parti Québécois | Francis Dufour | 12,850 | 40.63 | |||||
| Union Nationale | Lucien Audet | 897 | 2.84 | |||||
| Parti créditiste | Albert Bouchard | 892 | 2.82 | |||||
| Total valid votes | 31,624 | 98.42 | ||||||
| Total rejected ballots | 507 | 1.58 | ||||||
| 32,131 | 84.30 | |||||||
| Electors on the lists | 38,117 | – | ||||||
| 1970 Quebec general election | ||||||||
|---|---|---|---|---|---|---|---|---|
| Party | Candidate | Votes | % | |||||
| Liberal | Gérald Harvey | 15,010 | 49.49 | |||||
| Parti Québécois | Gilles Grégoire | 11,354 | 37.44 | |||||
| Union Nationale | Claude Boily | 3,108 | 10.25 | |||||
| Ralliement créditiste | Gérard Lacombe | 856 | 2.82 | |||||
| Total valid votes | 30,328 | 99.06 | ||||||
| Total rejected ballots | 289 | 0.94 | ||||||
| 30,617 | 88.64 | |||||||
| Electors on the lists | 34,540 | – | ||||||
| 1966 Quebec general election | ||||||||
|---|---|---|---|---|---|---|---|---|
| Party | Candidate | Votes | % | |||||
| Liberal | Gérald Harvey | 11,959 | 46.91 | |||||
| Union Nationale | Roger Dufault | 7,464 | 29.28 | |||||
| Ralliement national | Magella Tremblay | 4,992 | 19.50 | |||||
| RIN | Gérard Lacombe | 916 | 3.59 | |||||
| Independent Socialist | Richard Tremblay | 165 | 0.65 | |||||
| Total valid votes | 25,496 | 98.69 | ||||||
| Total rejected ballots | 339 | 1.31 | ||||||
| 25,835 | 79.06 | |||||||
| Electors on the lists | 32,677 | – | ||||||
References
- "General information on the provincial electoral divisions - Le Directeur général des élections du Québec (DGEQ)". Electionsquebec.qc.ca. 2012-09-04. Retrieved 2013-11-24.
- "General information on the provincial electoral divisions - Le Directeur général des élections du Québec (DGEQ)". Electionsquebec.qc.ca. Retrieved 2013-11-24.
External links
- Information
- Election results
- Election results (National Assembly)
- Election results (Elections Quebec)
- Maps
- 2011 map (PDF)
- 2001 map (Flash)
- 2001–2011 changes (Flash)
- 1992–2001 changes (Flash)
- Electoral map of Saguenay–Lac-Saint-Jean region
- Quebec electoral map, 2011
Neighbouring electoral districts | ||||||||||
|---|---|---|---|---|---|---|---|---|---|---|
| ||||||||||
This article is issued from Wikipedia. The text is licensed under Creative Commons - Attribution - Sharealike. Additional terms may apply for the media files.