Maurice-Richard
Maurice-Richard is a provincial electoral district in the Montreal region of Quebec, Canada that elects members to the National Assembly of Quebec. It comprises parts of the Ahuntsic-Cartierville and Montréal-Nord boroughs of the city of Montreal. The riding was known from 1972 to 2018 as Crémazie.[3]
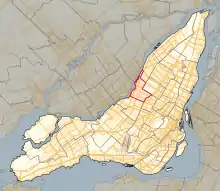 Location in Montreal | |||
| Provincial electoral district | |||
| Legislature | National Assembly of Quebec | ||
| MNA |
Liberal | ||
| District created | 1972 | ||
| First contested | 1973 | ||
| Last contested | 2018 | ||
| Demographics | |||
| Population (2011) | 65,930 | ||
| Electors (2014)[1] | 46,596 | ||
| Area (km²)[2] | 11.7 | ||
| Pop. density (per km²) | 5,635 | ||
| Census division(s) | Montreal (part) | ||
| Census subdivision(s) | Montreal (part) | ||
It was created for the 1973 election from parts of Ahuntsic and Bourassa electoral districts.
In the change from the 2001 to the 2011 electoral map, its territory was unchanged.
Members of the National Assembly
| Legislature | Years | Member | Party | |
|---|---|---|---|---|
| Riding created from Ahuntsic and Bourassa | ||||
| 30th | 1973–1976 | Jean Bienvenue | Liberal | |
| 31st | 1976–1981 | Guy Tardif | Parti Québécois | |
| 32nd | 1981–1985 | |||
| 33rd | 1985–1989 | André Vallerand | Liberal | |
| 34th | 1989–1994 | |||
| 35th | 1994–1998 | Jean Campeau | Parti Québécois | |
| 36th | 1998–2003 | Manon Blanchet | ||
| 37th | 2003–2007 | Michèle Lamquin-Éthier | Liberal | |
| 38th | 2007–2008 | Lisette Lapointe | Parti Québécois | |
| 39th | 2008–2011 | |||
| 2011–2012 | Independent | |||
| 40th | 2012–2014 | Diane De Courcy | Parti Québécois | |
| 41st | 2014–2018 | Marie Montpetit | Liberal | |
| 42nd | 2018–Present | |||
Election results
Maurice-Richard
| 2018 Quebec general election | ||||||||
|---|---|---|---|---|---|---|---|---|
| Party | Candidate | Votes | % | ±% | ||||
| Liberal | Marie Montpetit | 9,459 | 29.52 | -9.48 | ||||
| Québec solidaire | Raphaël Rebelo | 8,929 | 27.86 | +14.15 | ||||
| Coalition Avenir Québec | Manon Gauthier | 6,330 | 19.75 | +6.02 | ||||
| Parti Québécois | Frédéric Lapointe | 6,131 | 19.13 | -12.47 | ||||
| Green | Gilles Fournelle | 602 | 1.88 | +0.58 | ||||
| New Democratic | Jean Rémillard | 216 | 0.67 | - | ||||
| Parti nul | Manon Dupuis | 214 | 0.67 | - | ||||
| Bloc Pot | Morgan Ali | 90 | 0.28 | - | ||||
| Citoyens au pouvoir | Daniel St-Hilaire | 77 | 0.24 | - | ||||
| Total valid votes | 32,048 | 98.51 | – | |||||
| Total rejected ballots | 486 | 1.49 | – | |||||
| Turnout | 32,534 | 68.63 | -6.37 | |||||
| Eligible voters | 47,407 | – | – | |||||
| Liberal hold | Swing | -11.82 | ||||||
Crémazie
| 2014 Quebec general election | ||||||||
|---|---|---|---|---|---|---|---|---|
| Party | Candidate | Votes | % | ±% | ||||
| Liberal | Marie Montpetit | 13,440 | 39.00 | +10.16 | ||||
| Parti Québécois | Diane De Courcy | 10,892 | 31.60 | -7.01 | ||||
| Coalition Avenir Québec | Sylvain Bessette | 4,731 | 13.73 | -3.37 | ||||
| Québec solidaire | André Frappier | 4,726 | 13.71 | +2.14 | ||||
| Green | Virginia Leurent-Bonnevie | 448 | 1.30 | -0.19 | ||||
| Option nationale | Gabrielle Ladouceur-Despins | 227 | 0.66 | -1.72 | ||||
| Total valid votes | 34,464 | 98.61 | – | |||||
| Total rejected ballots | 485 | 1.39 | – | |||||
| Turnout | 34,949 | 75.00 | -1.63 | |||||
| Electors on the lists | 46,596 | – | – | |||||
| Liberal gain | Swing | +8.59 | ||||||
| 2012 Quebec general election | ||||||||
|---|---|---|---|---|---|---|---|---|
| Party | Candidate | Votes | % | ±% | ||||
| Parti Québécois | Diane De Courcy | 13,392 | 38.61 | -6.52 | ||||
| Liberal | Eleni Bakopanos | 10,004 | 28.84 | -11.38 | ||||
| Coalition Avenir Québec | Carla El-Ghandour | 5,933 | 17.10 | +10.81 | ||||
| Québec solidaire | André Frappier | 4,014 | 11.57 | +5.91 | ||||
| Option nationale | Yanek Lauzière-Fillion | 825 | 2.38 | – | ||||
| Green | Yves Laporte | 518 | 1.49 | -1.21 | ||||
| Total valid votes | 34,686 | 98.65 | – | |||||
| Total rejected ballots | 475 | 1.35 | – | |||||
| Turnout | 35,161 | 76.63 | +14.34 | |||||
| Electors on the lists | 45,887 | – | – | |||||
| Parti Québécois hold | Swing | +2.43 | ||||||
^ CAQ Result compared to Action démocratique
| 2008 Quebec general election | ||||||||
|---|---|---|---|---|---|---|---|---|
| Party | Candidate | Votes | % | ±% | ||||
| Parti Québécois | Lisette Lapointe | 12,972 | 45.13 | +9.13 | ||||
| Liberal | Martin Cossette | 11,560 | 40.22 | +4.71 | ||||
| Action démocratique | Diane Charbonneau | 1,808 | 6.29 | -9.81 | ||||
| Québec solidaire | André Frappier | 1,627 | 5.66 | -0.79 | ||||
| Green | Daniel Hémond | 776 | 2.70 | -2.92 | ||||
| Total valid votes | 28,743 | 98.54 | – | |||||
| Total rejected ballots | 425 | 1.46 | – | |||||
| Turnout | 29,168 | 62.29 | -11.55 | |||||
| Electors on the lists | 46,823 | – | – | |||||
| Parti Québécois hold | Swing | +2.21 | ||||||
| 2007 Quebec general election | ||||||||
|---|---|---|---|---|---|---|---|---|
| Party | Candidate | Votes | % | ±% | ||||
| Parti Québécois | Lisette Lapointe | 12,388 | 36.00 | -3.92 | ||||
| Liberal | Michèle Lamquin-Éthier | 12,218 | 35.51 | -8.75 | ||||
| Action démocratique | Geneviève Tousignant | 5,540 | 16.10 | +4.51 | ||||
| Québec solidaire | André Frappier | 2,218 | 6.45 | +4.49* | ||||
| Green | Nathalie Gingras | 1,934 | 5.62 | +4.48 | ||||
| Marxist–Leninist | Marsha Fine | 112 | 0.33 | +0.07 | ||||
| Total valid votes | 34,410 | 99.00 | – | |||||
| Total rejected ballots | 349 | 1.00 | – | |||||
| Turnout | 34,759 | 73.84 | +0.41 | |||||
| Electors on the lists | 47,076 | – | – | |||||
| Parti Québécois gain | Swing | +2.42 | ||||||
* Result compared to UFP
| 2003 Quebec general election | ||||||||
|---|---|---|---|---|---|---|---|---|
| Party | Candidate | Votes | % | ±% | ||||
| Liberal | Michèle Lamquin-Éthier | 15,498 | 44.26 | -0.08 | ||||
| Parti Québécois | Hugues Cormier | 13,979 | 39.92 | -5.43 | ||||
| Action démocratique | Manon St-Louis | 4,057 | 11.59 | +3.21 | ||||
| UFP | Jocelyne Desautels | 686 | 1.96 | – | ||||
| Green | Claude Trudel | 399 | 1.14 | – | ||||
| Bloc Pot | Philippe Beauvais | 306 | 0.87 | +0.17 | ||||
| Marxist–Leninist | Marsha Fine | 90 | 0.26 | – | ||||
| Total valid votes | 35,015 | 98.63 | – | |||||
| Total rejected ballots | 485 | 1.37 | – | |||||
| Turnout | 35,500 | 73.43 | – | |||||
| Electors on the lists | 48,344 | – | – | |||||
| Liberal gain | Swing | +2.68 | ||||||
| 1998 Quebec general election | ||||||||
|---|---|---|---|---|---|---|---|---|
| Party | Candidate | Votes | % | ±% | ||||
| Parti Québécois | Manon Blanchet | 13,953 | 45.35 | -1.44 | ||||
| Liberal | Roch Carrier | 13,644 | 44.34 | -1.07 | ||||
| Action démocratique | Éric Jolander | 2,579 | 8.38 | +2.88 | ||||
| Socialist Democracy | Martine Lauzon | 218 | 0.71 | -0.38 | ||||
| Bloc Pot | Étienne Saint-Amour | 214 | 0.70 | – | ||||
| Natural Law | Denis Cauchon | 88 | 0.29 | -0.33 | ||||
| Innovator | André Giguère | 39 | 0.13 | 0.00 | ||||
| Communist | Ulises Nitor | 33 | 0.11 | -0.12 | ||||
| Total valid votes | 30,768 | 99.09 | – | |||||
| Total rejected ballots | 282 | 0.91 | – | |||||
| Turnout | 31,050 | 81.34 | – | |||||
| Electors on the lists | 38,175 | – | – | |||||
| Parti Québécois hold | Swing | -0.19 | ||||||
| 1995 Quebec referendum | |||
|---|---|---|---|
| Side | Votes | % | |
| Non | 18,141 | 51.45 | |
| Oui | 17,120 | 48.55 | |
| 1994 Quebec general election | ||||||||
|---|---|---|---|---|---|---|---|---|
| Party | Candidate | Votes | % | ±% | ||||
| Parti Québécois | Jean Campeau | 14,482 | 46.79 | +4.45 | ||||
| Liberal | Michel Décary | 14,053 | 45.41 | -4.79 | ||||
| Action démocratique | Robert Robitaille | 1,750 | 5.50 | – | ||||
| New Democratic | Ginette St-Amour | 337 | 1.09 | -0.56 | ||||
| Natural Law | Carmel Bernard | 193 | 0.62 | – | ||||
| Communist | Serge Linnikoff | 72 | 0.23 | – | ||||
| Republic of Canada | Normand Normandeau | 68 | 0.22 | -0.26 | ||||
| Innovator | Jean Yves Thorne | 40 | 0.13 | – | ||||
| 1992 Charlottetown Accord referendum | |||
|---|---|---|---|
| Side | Votes | % | |
| Non | 17,656 | 55.47 | |
| Oui | 14,173 | 44.53 | |
| 1989 Quebec general election: Crémazie | ||||||||
|---|---|---|---|---|---|---|---|---|
| Party | Candidate | Votes | % | ±% | ||||
| Liberal | André Vallerand | 15,100 | 50.20 | +1.31 | ||||
| Parti Québécois | Lise Dagenais | 12,736 | 42.34 | -2.74 | ||||
| Green | Hélène Deschênes | 1,385 | 4.60 | – | ||||
| New Democratic | Jean Denis | 496 | 1.65 | -0.72 | ||||
| Commonwealth of Canada | Christiane Deland-Gervais | 143 | 0.48 | +0.24 | ||||
| Workers | Claudya Kutowsky | 115 | 0.38 | – | ||||
| Marxist–Leninist | Christine Dandenault | 103 | 0.34 | – | ||||
| Total valid votes | 30,078 | 97.69 | – | |||||
| Total rejected ballots | 710 | 2.31 | – | |||||
| Turnout | 30,788 | 79.13 | -0.90 | |||||
| Eligible voters | 38,910 | – | – | |||||
| Liberal hold | Swing | +2.04 | ||||||
| Source: Official Results, Le Directeur général des élections du Québec. | ||||||||
| 1985 Quebec general election | ||||||||
|---|---|---|---|---|---|---|---|---|
| Party | Candidate | Votes | % | ±% | ||||
| Liberal | André Vallerand | 16,115 | 48.89 | +3.24 | ||||
| Parti Québécois | Guy Tardif | 14,560 | 45.08 | -6.37 | ||||
| New Democratic | Pierre Leduc | 765 | 2.37 | – | ||||
| Parti indépendantiste | Louise Crépel | 276 | 0.86 | – | ||||
| Progressive Conservative | Laurence Lemyre | 233 | 0.72 | – | ||||
| Independent | Carole Caron | 211 | 0.65 | – | ||||
| Commonwealth of Canada | Christiane Deland | 78 | 0.24 | – | ||||
| Christian Socialist | Yvan Lauzon | 62 | 0.19 | – | ||||
| 1981 Quebec general election | ||||||||
|---|---|---|---|---|---|---|---|---|
| Party | Candidate | Votes | % | ±% | ||||
| Parti Québécois | Guy Tardif | 16,938 | 51.45 | +1.05 | ||||
| Liberal | Gilles Perron | 15,355 | 46.65 | +10.37 | ||||
| Union Nationale | Richer M. Francoeur | 545 | 1.66 | -8.90 | ||||
| Marxist–Leninist | Carolyn Zapf | 80 | 0.24 | – | ||||
| 1980 Quebec referendum | |||
|---|---|---|---|
| Side | Votes | % | |
| Non | 18,112 | 56.15 | |
| Oui | 14,147 | 43.85 | |
| 1976 Quebec general election | ||||||||
|---|---|---|---|---|---|---|---|---|
| Party | Candidate | Votes | % | ±% | ||||
| Parti Québécois | Guy Tardif | 16,463 | 50.40 | +4.60 | ||||
| Liberal | Jean Bienvenue | 11,851 | 36.28 | -13.90 | ||||
| Union Nationale | Maurice L'Écuyer | 3,449 | 10.56 | +9.15 | ||||
| Ralliement créditiste | Léopold Mercier | 461 | 1.41 | -1.04 | ||||
| Parti national populaire | Gilles Legault | 277 | 0.85 | – | ||||
| Communist | Claire Da Sylva Demers | 83 | 0.25 | – | ||||
| NDP – RMS coalition | André Lavallée | 80 | 0.25 | – | ||||
| 1973 Quebec general election | ||||||||
|---|---|---|---|---|---|---|---|---|
| Party | Candidate | Votes | % | |||||
| Liberal | Jean Bienvenue | 15,993 | 50.18 | |||||
| Parti Québécois | Jacques Parizeau | 14,597 | 45.80 | |||||
| Parti créditiste | Jacques Desjardins | 783 | 2.45 | |||||
| Union Nationale | Daniel Rock | 450 | 1.41 | |||||
| Marxist–Leninist | Marc Blouin | 50 | 0.16 | |||||
References
- http://www.electionsquebec.qc.ca/english/provincial/electoral-map/general-information-on-the-provincial-electoral-divisions-2011.php?bsq=433§ion=population
- http://www.electionsquebec.qc.ca/english/provincial/electoral-map/general-information-on-the-provincial-electoral-divisions-2011.php?bsq=433§ion=superficie
- http://lacarte.electionsquebec.qc.ca/fr/carte.php?bsq=433
External links
- Information
- Election results
- Election results (National Assembly)
- Election results (QuébecPolitique)
- Maps
- 2011 map (PDF)
- 2001 map (Flash)
- 2001–2011 changes (Flash)
- 1992–2001 changes (Flash)
- Electoral map of Montréal region
- Quebec electoral map, 2011
Neighbouring electoral districts | |
|---|---|
This article is issued from Wikipedia. The text is licensed under Creative Commons - Attribution - Sharealike. Additional terms may apply for the media files.