Soulanges (provincial electoral district)
Soulanges is a provincial electoral district in the Montérégie region of Quebec, Canada that elects members to the National Assembly of Quebec. It includes Rigaud, Saint-Lazare and various other municipalities.
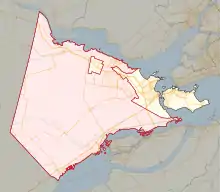 Location in Vaudreuil-Soulanges | |||
| Provincial electoral district | |||
| Legislature | National Assembly of Quebec | ||
| MNA |
Coalition Avenir Québec | ||
| District created | 1867 | ||
| District abolished | 1939 | ||
| District re-created | 2001 | ||
| First contested | 1867 | ||
| Last contested | 2018 | ||
| Demographics | |||
| Population (2011) | 62,095 | ||
| Electors (2014)[1] | 48,340 | ||
| Area (km²)[2] | 795.1 | ||
| Pop. density (per km²) | 78.1 | ||
| Census division(s) | Vaudreuil-Soulanges (part) | ||
| Census subdivision(s) | Coteau-du-Lac, Hudson, Les Cèdres, Les Coteaux, Pointe-des-Cascades, Pointe-Fortune, Rigaud, Rivière-Beaudette, Saint-Clet, Sainte-Justine-de-Newton, Saint-Lazare, Sainte-Marthe, Saint-Polycarpe, Saint-Télesphore, Saint-Zotique, Très-Saint-Rédempteur | ||
It was created for the 1867 election (and an electoral district of that name existed earlier in the Legislative Assembly of the Province of Canada). Its final election was in 1936, and its successor electoral district was Vaudreuil-Soulanges.
It was re-created for the 2003 election from parts of Salaberry-Soulanges and Vaudreuil.
In the change from the 2001 to the 2011 electoral map, its territory was unchanged.
In the change from the 2011 to the 2017 electoral map, the riding will gain Hudson from Vaudreuil.
Members of the Legislative Assembly / National Assembly
| Legislature | Years | Member | Party | |
|---|---|---|---|---|
| 1st | 1867–1871 | Dominique-Amable Coutlée | Conservative | |
| 2nd | 1871–1875 | Georges-Raoul-Léotale-Guichart-Humbert Saveuse de Beaujeu | ||
| 3rd | 1875–1878 | Independent | ||
| 4th | 1878–1881 | William Duckett | Conservative | |
| 5th | 1881–1886 | |||
| 6th | 1886–1890 | Avila-Gonzague Bourbonnais | Parti national | |
| 7th | 1890–1892 | |||
| 8th | 1892–1897 | Liberal | ||
| 9th | 1897–1900 | |||
| 10th | 1900–1902† | |||
| 1902–1904 | Arcade-Momer Bissonnette | Conservative | ||
| 11th | 1904–1908 | Joseph-Octave Mousseau | Liberal | |
| 12th | 1908–1912 | |||
| 13th | 1912–1916 | |||
| 14th | 1916–1919 | Avila Farand | ||
| 15th | 1919–1923 | |||
| 16th | 1923–1927 | Joseph-Arthur Lortie | Conservative | |
| 17th | 1927–1931 | Avila Farand | Liberal | |
| 18th | 1931–1935 | |||
| 19th | 1935–1936 | |||
| 20th | 1936–1939 | Édouard Leduc | Union Nationale | |
| Riding dissolved into Vaudreuil-Soulanges | ||||
| Riding re-created from Salaberry-Soulanges and Vaudreuil | ||||
| 37th | 2003–2007 | Lucie Charlebois | Liberal | |
| 38th | 2007–2008 | |||
| 39th | 2008–2012 | |||
| 40th | 2012–2014 | |||
| 41st | 2014–2018 | |||
| 42nd | 2018–Present | Marilyne Picard | Coalition Avenir Québec | |
Election results
| 2018 Quebec general election | ||||||||
|---|---|---|---|---|---|---|---|---|
| Party | Candidate | Votes | % | ±% | ||||
| Coalition Avenir Québec | Marilyn Picard | 15,307 | 39.23 | – | ||||
| Liberal | Lucie Charlebois | 13,165 | 33.74 | – | ||||
| Québec solidaire | Maxime Larue-Bourdages | 4,508 | 11.55 | – | ||||
| Parti Québécois | Samuelle D.-Henry | 4,001 | 10.25 | – | ||||
| Green | Bianca Jitaru | 729 | 1.87 | – | ||||
| New Democratic | Etienne Madelein | 424 | 1.09 | – | ||||
| Conservative | Felic Trombino | 322 | 0.83 | – | ||||
| Citoyens au pouvoir | Dominik Prud'homme | 292 | 0.75 | – | ||||
| Bloc Pot | Jean-Patrick Berthiaume | 205 | 0.53 | – | ||||
| Équipe autonomiste | Patrick Marquis | 65 | 0.17 | – | ||||
| Total valid votes | 39,018 | 98.61 | – | |||||
| Total rejected ballots | 551 | 1.39 | – | |||||
| Turnout | 39,569 | 70.33 | – | |||||
| Electors on the lists | 56,258 | – | – | |||||
| Coalition Avenir Québec gain | Swing | – | ||||||
| 2014 Quebec general election | ||||||||
|---|---|---|---|---|---|---|---|---|
| Party | Candidate | Votes | % | ±% | ||||
| Liberal | Lucie Charlebois | 18,925 | 54.40 | +19.35 | ||||
| Parti Québécois | Marie-Louise Séguin | 11,002 | 31.62 | +0.72 | ||||
| Québec solidaire | Andrée Bessette | 3,425 | 9.84 | +6.22 | ||||
| Parti équitable | Patricia Domingos | 961 | 2.76 | +1.73 | ||||
| Option nationale | Patrick Marquis | 478 | 1.37 | +0.02 | ||||
| Total valid votes | 34,791 | 96.05 | – | |||||
| Total rejected ballots | 1,429 | 3.95 | +2.67 | |||||
| Turnout | 36,220 | 74.93 | -4.07 | |||||
| Electors on the lists | 48,340 | – | – | |||||
| Liberal hold | Swing | +9.31 | ||||||
| 2012 Quebec general election | ||||||||
|---|---|---|---|---|---|---|---|---|
| Party | Candidate | Votes | % | ±% | ||||
| Liberal | Lucie Charlebois | 12,795 | 35.05 | -11.24 | ||||
| Parti Québécois | André Bouthilier | 11,281 | 30.90 | -6.05 | ||||
| Coalition Avenir Québec | Mario Gagner | 10,234 | 28.03* | +16.05 | ||||
| Québec solidaire | Andrée Bessette | 1,323 | 3.62 | +1.79 | ||||
| Option nationale | Frédéric Roy | 495 | 1.36 | – | ||||
| Independent | Patricia Domingos | 378 | 1.04 | – | ||||
| Total valid votes | 36,506 | 98.72 | – | |||||
| Total rejected ballots | 473 | 1.28 | – | |||||
| Turnout | 36,979 | 79.00% | – | |||||
| Electors on the lists | 46,809 | – | – | |||||
* Result compared to Action démocratique
| Party | Candidate | Votes | % | ±% | |
|---|---|---|---|---|---|
| Liberal | Lucie Charlebois | 11,564 | 46.29 | – | |
| Parti Québécois | Louisanne Chevrier | 9,229 | 36.95 | – | |
| Action démocratique | Daniel Lavigne | 2,992 | 11.98 | – | |
| Green | Daniel Eperjusy | 736 | 2.95 | – | |
| Québec solidaire | Jonathan Vallée-Payette | 459 | 1.84 | – | |
| Party | Candidate | Votes | % | ±% | |
|---|---|---|---|---|---|
| Liberal | Lucie Charlebois | 10,689 | 36.03 | ||
| Action démocratique | Sylvain Brazeau | 9,212 | 31.05 | ||
| Parti Québécois | Marc Laviolette | 7,821 | 26.36 | ||
| Green | Alain Brazeau | 1,389 | 4.68 | – | |
| Québec solidaire | Marielle Rodrigue | 442 | 1.49 | ||
| } | Independent | Gilles Paquette | 113 | 0.38 | |
| Party | Candidate | Votes | % | ±% | |
|---|---|---|---|---|---|
| Liberal | Lucie Charlebois | 13,473 | 50.99 | ||
| Parti Québécois | Gaëtane Legault | 8,753 | 33.13 | ||
| Action démocratique | Pierre Éloi Talbot | 3,549 | 13.43 | ||
| Bloc Pot | Gloria Sawyer | 327 | 1.24 | ||
| Green | Sandra Stephenson | 320 | 1.21 | – | |
References
- General information on the provincial electoral divisions – Le Directeur général des élections du Québec (DGEQ). Electionsquebec.qc.ca (4 September 2012).
- General information on the provincial electoral divisions – Le Directeur général des élections du Québec (DGEQ). Electionsquebec.qc.ca.
- https://www.electionsquebec.qc.ca/english/provincial/election-results/general-elections.php?e=83&c=1172&s=1#s
External links
- Information
- Election results
- Election results (National Assembly)
- Maps
- 2011 map (PDF)
- 2001 map (Flash)
- 2001–2011 changes (Flash)
- 1992–2001 changes (Flash)
- Electoral map of Montérégie region
- Quebec electoral map, 2011
Neighbouring electoral districts | ||||||||||
|---|---|---|---|---|---|---|---|---|---|---|
| ||||||||||