Robert-Baldwin
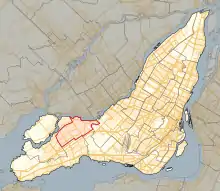
Robert-Baldwin is a provincial electoral district in the Montreal region of Quebec, Canada that elects members to the National Assembly of Quebec. It includes a portion of the Pierrefonds-Roxboro borough of Montreal as well as the city of Dollard-des-Ormeaux.
 Location in Montreal | |||
| Provincial electoral district | |||
| Legislature | National Assembly of Quebec | ||
| MNA |
Liberal | ||
| District created | 1965 | ||
| First contested | 1966 | ||
| Last contested | 2018 | ||
| Demographics | |||
| Population (2011) | 76,965 | ||
| Electors (2018)[1] | 55,075 | ||
| Area (km²)[2] | 24.6 | ||
| Pop. density (per km²) | 3,128.7 | ||
| Census division(s) | Montreal (part) | ||
| Census subdivision(s) | Montreal (part), Dollard-des-Ormeaux | ||
It was created for the 1966 election from a part of Jacques-Cartier.
In the change from the 2001 to the 2011 electoral map, it gained a small additional part of Pierrefonds-Roxboro from the Nelligan electoral district.
It was named after former Prime Minister of the United Province of Canada, Robert Baldwin.
Members of the Legislative Assembly / National Assembly
| Legislature | Years | Member | Party | |
|---|---|---|---|---|
| Riding created from Jacques-Cartier | ||||
| 28th | 1966–1967 | Arthur-Ewan Séguin | Independent | |
| 1967–1970 | Liberal | |||
| 29th | 1970–1973 | |||
| 30th | 1973–1976 | Jean Cournoyer | ||
| 31st | 1976–1981 | John O'Gallagher | ||
| 32nd | 1981–1985 | |||
| 33rd | 1985–1989 | Pierre MacDonald | ||
| 34th | 1989–1994 | Sam Elkas | ||
| 35th | 1994–1998 | Pierre Marsan | ||
| 36th | 1998–2003 | |||
| 37th | 2003–2007 | |||
| 38th | 2007–2008 | |||
| 39th | 2008–2012 | |||
| 40th | 2012–2014 | |||
| 41st | 2014–2018 | Carlos Leitão | ||
| 42nd | 2018–Present | |||
Election results
| 2018 Quebec general election | ||||||||
|---|---|---|---|---|---|---|---|---|
| Party | Candidate | Votes | % | ±% | ||||
| Liberal | Carlos Leitão | 22,426 | 73.85 | -13.42 | ||||
| Coalition Avenir Québec | Laura Azéroual | 3,438 | 11.32 | +6.19 | ||||
| Québec solidaire | Zachary Williams | 1,317 | 4.34 | +2.46 | ||||
| Parti Québécois | Marie-Imalta Pierre-Lys | 994 | 3.27 | -0.43 | ||||
| Conservative | Michael-Louis Coppa | 921 | 3.03 | +2.68 | ||||
| Green | Catherine Richardson | 781 | 2.57 | +1.13 | ||||
| New Democratic | Luca Brown | 488 | 1.61 | – | ||||
| Total valid votes | 30,365 | 99.15 | – | |||||
| Total rejected ballots | 259 | 0.85 | – | |||||
| Turnout | 30,624 | 55.6 | -21.39 | |||||
| Electors on the lists | 55,075 | – | – | |||||
| 2014 Quebec general election | ||||||||
|---|---|---|---|---|---|---|---|---|
| Party | Candidate | Votes | % | ±% | ||||
| Liberal | Carlos Leitão | 36,763 | 87.27 | +12.06 | ||||
| Coalition Avenir Québec | Jamie Allen | 2,161 | 5.13 | -7.85 | ||||
| Parti Québécois | Michaël Comtois-Lussier | 1,557 | 3.70 | -1.63 | ||||
| Québec solidaire | Ali Faour | 794 | 1.88 | -1.04 | ||||
| Green | Mathieu Mireault | 607 | 1.44 | -1.22 | ||||
| Conservative | Patricia Popert | 146 | 0.35 | – | ||||
| Option nationale | Viviane Martinova-Croteau | 96 | 0.23 | -0.29 | ||||
| Total valid votes | 42,124 | 99.52 | – | |||||
| Total rejected ballots | 203 | 0.48 | – | |||||
| Turnout | 42,327 | 76.99 | +7.90 | |||||
| Electors on the lists | 54,979 | – | – | |||||
| 2012 Quebec general election | ||||||||
|---|---|---|---|---|---|---|---|---|
| Party | Candidate | Votes | % | ±% | ||||
| Liberal | Pierre Marsan | 27,904 | 75.21 | -5.86 | ||||
| Coalition Avenir Québec | Toni Rinow | 4,817 | 12.98 | +8.82* | ||||
| Parti Québécois | Alexandre Pagé-Chassé | 1,978 | 5.33 | -2.28 | ||||
| Québec solidaire | Sarah Landry | 1,083 | 2.92 | +1.14 | ||||
| Green | Mathieu Mireault | 988 | 2.66 | -2.37 | ||||
| Option nationale | Sophie Turcot | 194 | 0.52 | – | ||||
| Quebec Citizens' Union | Fredrick-Anthony Ghali | 138 | 0.37 | – | ||||
| Total valid votes | 37,102 | 99.38 | – | |||||
| Total rejected ballots | 231 | 0.62 | – | |||||
| Turnout | 37,333 | 69.09 | +27.57 | |||||
| Electors on the lists | 54,033 | – | – | |||||
* Result compared to Action démocratique
| 2008 Quebec general election | ||||||||
|---|---|---|---|---|---|---|---|---|
| Party | Candidate | Votes | % | ±% | ||||
| Liberal | Pierre Marsan | 17,078 | 81.07 | +6.31 | ||||
| Parti Québécois | Alexandre Pagé-Chassé | 1,602 | 7.61 | +2.27 | ||||
| Green | Maryse Goulet | 1,059 | 5.03 | -2.18 | ||||
| Action démocratique | Alexandra Lauzon | 877 | 4.16 | -6.79 | ||||
| Québec solidaire | Sarah Landry | 375 | 1.78 | +0.04 | ||||
| Marxist–Leninist | Nicholas Lin | 74 | 0.35 | – | ||||
| Total valid votes | 21,065 | 99.35 | – | |||||
| Total rejected ballots | 138 | 0.65 | – | |||||
| Turnout | 21,203 | 41.52 | -17.10 | |||||
| Electors on the lists | 51,062 | – | – | |||||
| 2007 Quebec general election | ||||||||
|---|---|---|---|---|---|---|---|---|
| Party | Candidate | Votes | % | ±% | ||||
| Liberal | Pierre Marsan | 22,132 | 74.76 | -11.11 | ||||
| Action démocratique | Ginette Lemire | 3,242 | 10.95 | +5.88 | ||||
| Green | Shawn Katz | 2,136 | 7.21 | – | ||||
| Parti Québécois | Alexandre Pagé-Chassé | 1,581 | 5.34 | -2.50 | ||||
| Québec solidaire | Jocelyne Messih | 514 | 1.74 | – | ||||
| Total valid votes | 29,605 | 99.48 | – | |||||
| Total rejected ballots | 156 | 0.52 | – | |||||
| Turnout | 29,761 | 58.62 | -6.64 | |||||
| Electors on the lists | 50,769 | – | – | |||||
| 2003 Quebec general election | ||||||||
|---|---|---|---|---|---|---|---|---|
| Party | Candidate | Votes | % | ±% | ||||
| Liberal | Pierre Marsan | 28,892 | 85.87 | +1.79 | ||||
| Parti Québécois | Alphonse Boisrond | 2,637 | 7.84 | -1.43 | ||||
| Action démocratique | Alladin Abou Sharbin | 1,705 | 5.07 | +1.96 | ||||
| Equality | Jimmy D. Kalafatidis | 411 | 1.22 | -1.54 | ||||
| Total valid votes | 33,645 | 99.26 | – | |||||
| Total rejected ballots | 250 | 0.74 | – | |||||
| Turnout | 33,895 | 65.26 | -12.80 | |||||
| Electors on the lists | 51,935 | – | – | |||||
| 1998 Quebec general election | ||||||||
|---|---|---|---|---|---|---|---|---|
| Party | Candidate | Votes | % | ±% | ||||
| Liberal | Pierre Marsan | 31,702 | 84.08 | +1.10 | ||||
| Parti Québécois | André Allard | 3,494 | 9.27 | -0.57 | ||||
| Action démocratique | Virsna Chau | 1,173 | 3.11 | +0.58 | ||||
| Equality | Jimmy D. Kalafatidis | 1,042 | 2.76 | +0.07 | ||||
| Bloc Pot | Jean-François Labrecque | 295 | 0.78 | – | ||||
| Total valid votes | 37,706 | 99.48 | – | |||||
| Total rejected ballots | 196 | 0.52 | – | |||||
| Turnout | 37,902 | 78.06 | -7.11 | |||||
| Electors on the lists | 48,552 | – | – | |||||
| 1995 Quebec referendum | |||
|---|---|---|---|
| Side | Votes | % | |
| Non | 38,956 | 89.83 | |
| Oui | 4,410 | 10.17 | |
| 1994 Quebec general election | ||||||||
|---|---|---|---|---|---|---|---|---|
| Party | Candidate | Votes | % | ±% | ||||
| Liberal | Pierre Marsan | 29,865 | 82.98 | +36.93 | ||||
| Parti Québécois | Nicolas Tétrault | 3,541 | 9.84 | −3.09 | ||||
| Equality | Bart Sellitto | 969 | 2.69 | −38.33 | ||||
| Action démocratique | Mario Pilote Jr. | 909 | 2.53 | – | ||||
| CANADA! | Harry Polansky | 364 | 1.01 | – | ||||
| Natural Law | Ruby Finkelstein | 123 | 0.34 | – | ||||
| Republic of Canada | Robert Charles | 120 | 0.33 | – | ||||
| Innovator | Martin Leduc | 99 | 0.28 | – | ||||
| Total valid votes | 35,990 | 99.20 | – | |||||
| Rejected and declined votes | 291 | 0.80 | – | |||||
| Turnout | 36,281 | 85.17 | +10.50 | |||||
| Electors on the lists | 42,600 | – | – | |||||
| Source: Official Results, Le Directeur général des élections du Québec. | ||||||||
| 1992 Charlottetown Accord referendum | |||
|---|---|---|---|
| Side | Votes | % | |
| Oui | 28,184 | 82.59 | |
| Non | 5,941 | 17.41 | |
| 1989 Quebec general election | ||||||||
|---|---|---|---|---|---|---|---|---|
| Party | Candidate | Votes | % | ±% | ||||
| Liberal | Sam Elkas | 12,671 | 46.05 | -34.49 | ||||
| Equality | Adrian Weller | 11,287 | 41.02 | – | ||||
| Parti Québécois | Yves Morin | 3,557 | 12.93 | -0.99 | ||||
| 1985 Quebec general election | ||||||||
|---|---|---|---|---|---|---|---|---|
| Party | Candidate | Votes | % | ±% | ||||
| Liberal | Pierre MacDonald | 27,041 | 80.54 | +2.70 | ||||
| Parti Québécois | Michelle Dozois | 4,673 | 13.92 | -5.36 | ||||
| New Democratic | René Boulard | 1,068 | 3.18 | – | ||||
| Progressive Conservative | Hugh Rowe | 467 | 1.39 | – | ||||
| Union Nationale | Germaine A. Tremblay-White | 164 | 0.49 | -0.26 | ||||
| Commonwealth of Canada | Robert McMahon | 161 | 0.48 | – | ||||
| 1981 Quebec general election | ||||||||
|---|---|---|---|---|---|---|---|---|
| Party | Candidate | Votes | % | ±% | ||||
| Liberal | John O’Gallagher | 26,865 | 77.84 | +41.73 | ||||
| Parti Québécois | Gisèle Hurtubise | 6,651 | 19.28 | +0.75 | ||||
| } | Freedom of Choice | Duncan C. Macdonald | 495 | 1.43 | – | |||
| Union Nationale | Howard Boucher | 260 | 0.75 | -25.51 | ||||
| Libertarian | Hugh Rowe | 240 | 0.70 | – | ||||
| 1980 Quebec referendum | |||
|---|---|---|---|
| Side | Votes | % | |
| Non | 39,977 | 81.34 | |
| Oui | 9,170 | 18.66 | |
| 1976 Quebec general election | ||||||||
|---|---|---|---|---|---|---|---|---|
| Party | Candidate | Votes | % | ±% | ||||
| Liberal | John O’Gallagher | 14,476 | 36.11 | -44.92 | ||||
| Union Nationale | Dorothy Bryan Barker | 10,529 | 26.26 | +25.36 | ||||
| Parti Québécois | Gilles Corbeil | 7,430 | 18.53 | +2.80 | ||||
| } | Independent | Robert G. Beale | 4,827 | 12.04 | – | |||
| } | Democratic Alliance | George Donald Boutilier | 2,188 | 5.46 | – | |||
| Ralliement créditiste | Louis Lefebvre | 410 | 1.02 | -1.15 | ||||
| } | Independent | Leo Rotgaus | 233 | 0.58 | – | |||
| 1973 Quebec general election | ||||||||
|---|---|---|---|---|---|---|---|---|
| Party | Candidate | Votes | % | ±% | ||||
| Liberal | Jean Cournoyer | 26,189 | 81.03 | -6.43 | ||||
| Parti Québécois | Serge Brodeur | 5,083 | 15.73 | +6.54 | ||||
| Parti créditiste | Jean J. St-Georges | 701 | 2.17 | – | ||||
| Union Nationale | Léopold Hamel | 293 | 0.90 | -2.45 | ||||
| Marxist–Leninist | Arthur Vachon | 55 | 0.17 | – | ||||
| 1970 Quebec general election | ||||||||
|---|---|---|---|---|---|---|---|---|
| Party | Candidate | Votes | % | ±% | ||||
| Liberal | Arthur-Ewen Séguin | 46,169 | 87.46 | +34.14 | ||||
| Parti Québécois | Jacques Rivest | 4,853 | 9.19 | – | ||||
| Union Nationale | William F. Shaw | 1,769 | 3.35 | -4.83 | ||||
| 1966 Quebec general election | ||||||||
|---|---|---|---|---|---|---|---|---|
| Party | Candidate | Votes | % | |||||
| Independent | Arthur-Ewen Séguin | 19,506 | 53.32 | |||||
| Liberal | Norman Wray | 11,754 | 32.13 | |||||
| Union Nationale | Maurice Provost | 2,991 | 8.18 | |||||
| } | Independent | John Patrick Boyle | 1,287 | 3.52 | ||||
| } | RIN | Yves Gariépy | 900 | 2.46 | ||||
| } | Ralliement national | Jean-Paul Trudel | 144 | 0.39 | ||||
References
- http://www.electionsquebec.qc.ca/english/provincial/electoral-map/general-information-on-the-provincial-electoral-divisions-2011.php?bsq=413§ion=population
- http://www.electionsquebec.qc.ca/english/provincial/electoral-map/general-information-on-the-provincial-electoral-divisions-2011.php?bsq=413§ion=superficie
External links
- Information
- Election results
- Election results (National Assembly)
- Election results (QuébecPolitique)
- Maps
- 2011 map (PDF)
- 2001 map (Flash)
- 2001–2011 changes (Flash)
- 1992–2001 changes (Flash)
- Electoral map of Montreal region
- Quebec electoral map, 2011
Neighbouring electoral districts | ||||||||||
|---|---|---|---|---|---|---|---|---|---|---|
| ||||||||||
This article is issued from Wikipedia. The text is licensed under Creative Commons - Attribution - Sharealike. Additional terms may apply for the media files.