Pointe-aux-Trembles (electoral district)
Pointe-aux-Trembles is a provincial electoral district in the Montreal region of Quebec, Canada that elects members to the National Assembly of Quebec. The district is located at the east point of the Island of Montreal and comprises the city of Montréal-Est and the neighbourhood of Pointe-aux-Trembles in the borough of Rivière-des-Prairies–Pointe-aux-Trembles borough of Montreal.
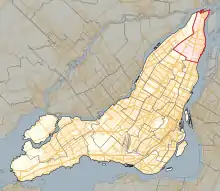 Location in Montreal | |||
| Provincial electoral district | |||
| Legislature | National Assembly of Quebec | ||
| MNA |
Coalition Avenir Québec | ||
| District created | 1988 | ||
| First contested | 1989 | ||
| Last contested | 2018 | ||
| Demographics | |||
| Population (2006) | 53,485 | ||
| Electors (2014)[1] | 40,905 | ||
| Area (km²)[2] | 37.2 | ||
| Pop. density (per km²) | 1,437.8 | ||
| Census division(s) | Montreal (part) | ||
| Census subdivision(s) | Montreal (part), Montréal-Est | ||
It was created for the 1989 election from parts of Anjou, Bourget and LaFontaine electoral districts.
In the change from the 2001 to the 2011 electoral map, its territory was unchanged.
In the 1995 Quebec referendum it (under its current boundaries) voted 63% for Quebec to become independent.
Members of the National Assembly
| Legislature | Years | Member | Party | |
|---|---|---|---|---|
| Riding created from Anjou, Bourget and LaFontaine | ||||
| 34th | 1989–1994 | Michel Bourdon | Parti Québécois | |
| 35th | 1994–1996 | |||
| 1996–1998 | Nicole Léger | |||
| 36th | 1998–2003 | |||
| 37th | 2003–2006 | |||
| 2006–2007 | André Boisclair | |||
| 38th | 2007–2008 | |||
| 2008–2008 | Nicole Léger | |||
| 39th | 2008–2012 | |||
| 40th | 2012–2014 | |||
| 41st | 2014–2018 | |||
| 42nd | 2018–present | Chantal Rouleau | Coalition Avenir Québec | |
Election results
| 2018 Quebec general election | ||||||||
|---|---|---|---|---|---|---|---|---|
| Party | Candidate | Votes | % | ±% | ||||
| Coalition Avenir Québec | Chantal Rouleau | 10,579 | 38.96 | +14.90 | ||||
| Parti Québécois | Jean-Martin Aussant | 8,745 | 32.20 | -11.02 | ||||
| Québec solidaire | Céline Pereira | 4,036 | 14.86 | +7.08 | ||||
| Liberal | Eric Ouellette | 3,410 | 12.56 | -9.84 | ||||
| Bloc Pot | Pierre Surette | 218 | 0.80 | - | ||||
| Équipe autonomiste | Louis Chardonnet | 89 | 0.33 | +0.13 | ||||
| Marxist–Leninist | Geneviève Royer | 79 | 0.29 | |||||
| Total valid votes | 27,156 | 97.87 | ||||||
| Total rejected ballots | 592 | 2.13 | ||||||
| Turnout | 27,748 | 67.43 | ||||||
| Eligible voters | 41,148 | |||||||
| 2014 Quebec general election | ||||||||
|---|---|---|---|---|---|---|---|---|
| Party | Candidate | Votes | % | ±% | ||||
| Parti Québécois | Nicole Léger | 12,021 | 43.22 | -7.04 | ||||
| Coalition Avenir Québec | Mathieu Binette | 6,692 | 24.06 | -0.06 | ||||
| Liberal | Claude Blais | 6,229 | 22.40 | +6.96 | ||||
| Québec solidaire | Natacha Larocque | 2,165 | 7.78 | +1.87 | ||||
| Green | David Cox | 332 | 1.19 | – | ||||
| Option nationale | Camille Goyette-Gingras | 234 | 0.84 | -1.35 | ||||
| Marxist–Leninist | Geneviève Royer | 82 | 0.29 | +0.05 | ||||
| Équipe autonomiste | Louis Chandonnet | 56 | 0.20 | – | ||||
| Total valid votes | 27,811 | 97.92 | – | |||||
| Total rejected ballots | 591 | 2.08 | – | |||||
| Turnout | 28,402 | 69% | -7.00 | |||||
| Electors on the lists | 40,905 | – | – | |||||
| 2012 Quebec general election | ||||||||
|---|---|---|---|---|---|---|---|---|
| Party | Candidate | Votes | % | ±% | ||||
| Parti Québécois | Nicole Léger | 15,406 | 50.26 | -6.61 | ||||
| Coalition Avenir Québec | Guy Boutin | 7,425 | 24.22 | +13.00* | ||||
| Liberal | Jessica Veronica Cialdella | 4,732 | 15.44 | -9.25 | ||||
| Québec solidaire | Natacha Larocque | 1,811 | 5.91 | +2.97 | ||||
| Option nationale | Guillaume Simard L'Heureux | 672 | 2.19 | – | ||||
| Independent | Jean-Marcel Seck | 425 | 1.39 | – | ||||
| Parti indépendantiste | Gérald Briand | 109 | 0.36 | -0.34 | ||||
| Marxist–Leninist | Geneviève Royer | 73 | 0.24 | -0.10 | ||||
| Total valid votes | 30,653 | 98.64 | – | |||||
| Total rejected ballots | 422 | 1.36 | – | |||||
| Turnout | 31,075 | 76% | +19.34 | |||||
| Electors on the lists | 40,691 | – | – | |||||
- Result compared to Action Démocratique
| 2008 Quebec general election | ||||||||
|---|---|---|---|---|---|---|---|---|
| Party | Candidate | Votes | % | ±% | ||||
| Parti Québécois | Nicole Léger | 12,851 | 56.87 | +0.88 | ||||
| Liberal | Gilbert Thibodeau | 5,580 | 24.69 | +2.85 | ||||
| Action démocratique | Pierre Trudelle | 2,535 | 11.22 | -2.54 | ||||
| Green | Xavier Daxhelet | 733 | 3.24 | -1.59 | ||||
| Québec solidaire | Marie-Josèphe Pigeon | 664 | 2.94 | +1.29 | ||||
| Independent | Gérald Briand | 159 | 0.70 | +0.13 | ||||
| Marxist–Leninist | Geneviève Royer | 77 | 0.34 | – | ||||
| Total valid votes | 22,599 | 98.12 | – | |||||
| Total rejected ballots | 434 | 1.88 | – | |||||
| Turnout | 23,033 | 56.66 | +22.53 | |||||
| Electors on the lists | 40,648 | – | – | |||||
| Quebec provincial by-election, May 12, 2008 | ||||||||
|---|---|---|---|---|---|---|---|---|
| Party | Candidate | Votes | % | ±% | ||||
| Parti Québécois | Nicole Léger | 7,657 | 55.99 | +8.69 | ||||
| Liberal | Mélissa Dumais | 2,987 | 21.84 | +3.60 | ||||
| Action démocratique | Diane Bellemare | 1,882 | 13.76 | −12.69 | ||||
| Green | Xavier Daxhelet | 661 | 4.83 | +0.52 | ||||
| Québec solidaire | Marie Josèphe Pigeon | 226 | 1.65 | −0.97 | ||||
| Parti indépendantiste | Colette Provost | 153 | 1.12 | – | ||||
| Independent | Gérald Briand | 78 | 0.57 | |||||
| Independent | Régent Millette | 31 | 0.23 | |||||
| Total valid votes | 13,675 | 100.00 | ||||||
| Rejected and declined votes | 146 | |||||||
| Turnout | 13,821 | 34.13 | −38.79 | |||||
| Electors on the lists | 40,496 | |||||||
| 2007 Quebec general election | ||||||||
|---|---|---|---|---|---|---|---|---|
| Party | Candidate | Votes | % | ±% | ||||
| Parti Québécois | André Boisclair | 13,784 | 47.30 | −2.89 | ||||
| Action démocratique | Martin-Karl Bourbonnais | 7,708 | 26.45 | +12.20 | ||||
| Liberal | Daniel Fournier | 5,316 | 18.24 | −14.94 | ||||
| Green | Xavier Daxhelet | 1,257 | 4.31 | +2.70 | ||||
| Québec solidaire | Dominique Ritchot | 763 | 2.62 | |||||
| Bloc Pot | Etienne Mallette | 154 | 0.53 | |||||
| Christian Democracy | Julien Ferron | 116 | 0.40 | −0.08 | ||||
| Marxist–Leninist | Geneviève Royer | 41 | 0.14 | −0.14 | ||||
| Total valid votes | 29,139 | 98.69 | ||||||
| Rejected and declined votes | 388 | 1.31 | ||||||
| Turnout | 29,527 | 72.92 | −0.62 | |||||
| Electors on the lists | 40,495 | |||||||
| Source: Official Results, Le Directeur général des élections du Québec. | ||||||||
| Quebec provincial by-election, August 14, 2006 | ||||||||
|---|---|---|---|---|---|---|---|---|
| Party | Candidate | Votes | % | ±% | ||||
| Parti Québécois | André Boisclair | 9,077 | 70.95 | +20.76 | ||||
| Green | Xavier Daxhelet | 1,514 | 11.83 | +10.22 | ||||
| Québec solidaire | Dominique Ritchot | 1,073 | 8.39 | |||||
| Independent | Benoît Bergeron | 609 | 4.76 | |||||
| Independent | Jocelyne Leduc | 231 | 1.81 | |||||
| Independent | Jean-Marc Boyer | 124 | 0.97 | |||||
| Bloc Pot | Benjamin Kasapoglu | 113 | 0.88 | |||||
| Independent | Régent Millette | 52 | 0.41 | |||||
| Total valid votes | 12,793 | 100.00 | ||||||
| Rejected and declined votes | 315 | |||||||
| Turnout | 13,108 | 32.35 | −39.95 | |||||
| Electors on the lists | 40,516 | |||||||
| 2003 Quebec general election | ||||||||
|---|---|---|---|---|---|---|---|---|
| Party | Candidate | Votes | % | |||||
| Parti Québécois | Nicole Léger | 14,261 | 50.19 | |||||
| Liberal | Daniel Fournier | 9,427 | 33.18 | |||||
| Action démocratique | André Cordeau | 4,050 | 14.25 | |||||
| Green | Xavier Daxhelet | 457 | 1.61 | |||||
| Christian Democracy | Julien Ferron | 137 | 0.48 | |||||
| Marxist–Leninist | Geneviève Royer | 80 | 0.28 | |||||
| Total valid votes | 28,412 | 100.00 | ||||||
| Rejected and declined votes | 487 | |||||||
| Turnout | 28,899 | 72.30 | ||||||
| Electors on the lists | 39,971 | |||||||
| Source: Official Results, Le Directeur général des élections du Québec. | ||||||||
| 1998 Quebec general election | ||||||||
|---|---|---|---|---|---|---|---|---|
| Party | Candidate | Votes | % | ±% | ||||
| Parti Québécois | Nicole Léger | 15,946 | 53.83 | +6.80 | ||||
| Liberal | Richard La Charité | 9,110 | 30.75 | -3.49 | ||||
| Action démocratique | Daniel Croze | 4,205 | 14.19 | -3.05 | ||||
| Socialist Democracy | Hughes Tremblay | 205 | 0.69 | -0.09 | ||||
| Innovateur | Claude Laporte | 158 | 0.53 | -0.18 | ||||
| Quebec provincial by-election, December 9, 1996 | ||||||||
|---|---|---|---|---|---|---|---|---|
| Party | Candidate | Votes | % | ±% | ||||
| Parti Québécois | Nicole Léger | 7,190 | 47.03 | -6.74 | ||||
| Liberal | Bernard Lauzon | 5,234 | 34.24 | +0.75 | ||||
| Action démocratique | Jacques Hébert | 2,635 | 17.24 | +5.59 | ||||
| Socialist Democracy | Daniel Pharand | 119 | 0.78 | – | ||||
| Innovateur | Claude Laporte | 109 | 0.71 | – | ||||
| 1995 Quebec referendum | |||
|---|---|---|---|
| Side | Votes | % | |
| Oui | 21,425 | 60.88 | |
| Non | 13,768 | 39.12 | |
| 1994 Quebec general election | ||||||||
|---|---|---|---|---|---|---|---|---|
| Party | Candidate | Votes | % | ±% | ||||
| Parti Québécois | Michel Bourdon | 15,999 | 53.77 | +3.28 | ||||
| Liberal | José G. Simon | 9,965 | 33.49 | -10.46 | ||||
| Action démocratique | Martin Ouellet | 3,466 | 11.65 | – | ||||
| Natural Law | André Gaudet | 324 | 1.09 | – | ||||
| 1992 Charlottetown Accord referendum | |||
|---|---|---|---|
| Side | Votes | % | |
| Non | 20,854 | 67.24 | |
| Oui | 10,159 | 32.76 | |
| 1989 Quebec general election | ||||||||
|---|---|---|---|---|---|---|---|---|
| Party | Candidate | Votes | % | |||||
| Parti Québécois | Michel Bourdon | 13,725 | 50.49 | |||||
| Liberal | Jean Tondreau | 11,968 | 43.95 | |||||
| Workers | Gérald Varichon | 659 | 2.42 | |||||
| Progressive Conservative | André Ethier | 549 | 2.02 | |||||
| United Social Credit | Mario Gosselin | 327 | 1.20 | |||||
References
- http://www.electionsquebec.qc.ca/english/provincial/electoral-map/general-information-on-the-provincial-electoral-divisions-2011.php?bsq=369§ion=population
- http://www.electionsquebec.qc.ca/english/provincial/electoral-map/general-information-on-the-provincial-electoral-divisions-2011.php?bsq=369§ion=superficie
External links
- Information
- Election results
- Election results (National Assembly)
- Election results (QuébecPolitique)
- Maps
- 2011 map (PDF)
- 2001 map (Flash)
- 2001–2011 changes (Flash)
- 1992–2001 changes (Flash)
- Electoral map of Montreal region
- Quebec electoral map, 2011
Neighbouring electoral districts | ||||||||||
|---|---|---|---|---|---|---|---|---|---|---|
| ||||||||||
This article is issued from Wikipedia. The text is licensed under Creative Commons - Attribution - Sharealike. Additional terms may apply for the media files.