Jacques-Cartier
Jacques-Cartier is an electoral district in the West Island of Montreal, Canada, that elects members to the National Assembly of Quebec. It is the only provincial electoral district in Quebec with an Anglophone majority.
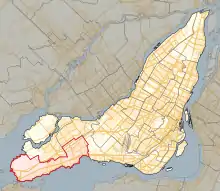 Location in Montreal | |||
| Provincial electoral district | |||
| Legislature | National Assembly of Quebec | ||
| MNA |
Liberal | ||
| District created | 1867 | ||
| First contested | 1867 | ||
| Last contested | 2018 | ||
| Demographics | |||
| Population (2006) | 59,416 | ||
| Electors (2014)[1] | 43,861 | ||
| Area (km²)[2] | 96.7 | ||
| Pop. density (per km²) | 614.4 | ||
| Census division(s) | Montreal | ||
| Census subdivision(s) | Baie-D'Urfé, Beaconsfield, Pointe-Claire, Sainte-Anne-de-Bellevue, Senneville | ||
Named after Jacques Cartier, the district existed in the Legislative Assembly of the Province of Canada, and its present incarnation dates from the 1867 election.
In 2011, district boundaries were redrawn, and part of Kirkland was transferred to Nelligan, in exchange for Senneville.
Members of the Legislative Assembly / National Assembly
| Legislature | Years | Member | Party | |
|---|---|---|---|---|
| 1st | 1867–1871 | Narcisse Lecavalier | Conservative | |
| 2nd | 1871–1875 | |||
| 3rd | 1875–1878 | |||
| 4th | 1878–1881 | |||
| 5th | 1881–1882 | |||
| 1882–1884 | Joseph-Alfred Mousseau | |||
| 1884–1886 | Arthur Boyer | Liberal | ||
| 6th | 1886–1890 | |||
| 7th | 1890–1892 | |||
| 8th | 1892–1897 | Joseph-Adélard Descarries | Conservative | |
| 9th | 1897–1900 | Joseph-Adolphe Chauret | Liberal | |
| 10th | 1900–1904 | |||
| 11th | 1904–1908 | |||
| 12th | 1908–1912 | Philémon Cousineau | Conservative | |
| 13th | 1912–1916 | |||
| 14th | 1916–1919 | Joseph-Séraphin-Aimé Ashby | Liberal | |
| 15th | 1919–1923 | |||
| 16th | 1923–1925 | Ésioff-Léon Patenaude | Conservative | |
| 1925–1927 | Victor Marchand | Liberal | ||
| 17th | 1927–1931 | |||
| 18th | 1931–1932 | |||
| 1933–1935 | Joseph-Théodule Rhéaume | |||
| 19th | 1935–1936 | Frederick Arthur Monk | Action libérale nationale | |
| 20th | 1936–1939 | Anatole Carignan | Union Nationale | |
| 21st | 1939–1944 | Charles-Aimé Kirkland | Liberal | |
| 22nd | 1944–1948 | |||
| 23rd | 1948–1952 | |||
| 24th | 1952–1956 | |||
| 25th | 1956–1960 | |||
| 26th | 1960–1961 | |||
| 1961–1962 | Marie-Claire Kirkland | |||
| 27th | 1962–1966 | |||
| 28th | 1966–1970 | Noël Saint-Germain | ||
| 29th | 1970–1973 | |||
| 30th | 1973–1976 | |||
| 31st | 1976–1981 | |||
| 32nd | 1981–1985 | Joan Dougherty | ||
| 33rd | 1985–1989 | |||
| 34th | 1989–1994 | Neil Cameron | Equality | |
| 35th | 1994–1998 | Geoffrey Kelley | Liberal | |
| 36th | 1998–2003 | |||
| 37th | 2003–2007 | |||
| 38th | 2007–2008 | |||
| 39th | 2008–2012 | |||
| 40th | 2012–2014 | |||
| 41st | 2014–2018 | |||
| 42nd | 2018–Present | Greg Kelley | ||
Electoral results
| 2018 Quebec general election | ||||||||
|---|---|---|---|---|---|---|---|---|
| Party | Candidate | Votes | % | ±% | ||||
| Liberal | Greg Kelley | 21,133 | 71.81 | -13.61 | ||||
| Coalition Avenir Québec | Karen Hilchey | 2,744 | 9.32 | +3.42 | ||||
| Green | Catherine Polson | 1,981 | 6.73 | +4.08 | ||||
| Québec solidaire | Nicholas Chatel-Launay | 1,291 | 4.39 | +2.02 | ||||
| Parti Québécois | Martine Bourgeois | 815 | 2.77 | -0.22 | ||||
| Conservative | Louis-Charles Fortier | 762 | 2.59 | +1.95 | ||||
| New Democratic | France Séguin | 555 | 1.89 | - | ||||
| Independent | Teodor Daiev | 78 | 0.27 | - | ||||
| Citoyens au pouvoir | Cynthia Bouchard | 72 | 0.24 | - | ||||
| Total valid votes | 29,431 | 99.37 | ||||||
| Total rejected ballots | 186 | 0.63 | ||||||
| Turnout | 29,617 | 65.11 | ||||||
| Eligible voters | 45,490 | |||||||
| 2014 Quebec general election | ||||||||
|---|---|---|---|---|---|---|---|---|
| Party | Candidate | Votes | % | ±% | ||||
| Liberal | Geoffrey Kelley | 30,823 | 85.42 | +12.31 | ||||
| Coalition Avenir Québec | Denis Deguire | 2,128 | 5.90 | -9.02 | ||||
| Parti Québécois | Laurence Desroches | 1,079 | 2.99 | -0.68 | ||||
| Green | James Maynard | 966 | 2.68 | -1.86 | ||||
| Québec solidaire | Jean-François Belley | 855 | 2.37 | -0.19 | ||||
| Conservative | Louis-Charles Fortier | 232 | 0.64 | – | ||||
| Total valid votes | 36,083 | 99.63 | – | |||||
| Total rejected ballots | 133 | 0.37 | – | |||||
| Turnout | 36,216 | 81% | +4.11 | |||||
| Electors on the lists | 44,612 | – | – | |||||
| 2012 Quebec general election | ||||||||
|---|---|---|---|---|---|---|---|---|
| Party | Candidate | Votes | % | ±% | ||||
| Liberal | Geoffrey Kelley | 24,525 | 73.11 | -7.74 | ||||
| Coalition Avenir Québec | Paola L. Hawa | 5,006 | 14.92 | +11.09* | ||||
| Green | Alex Tyrrell | 1,522 | 4.54 | -2.97 | ||||
| Parti Québécois | Olivier Gendreau | 1,232 | 3.67 | -2.35 | ||||
| Québec solidaire | François-Xavier Charlebois | 859 | 2.56 | +1.12 | ||||
| Independent | Francis Juneau | 189 | 0.56 | – | ||||
| Option nationale | Raphaël Hébert | 128 | 0.38 | – | ||||
| Quebec Citizens' Union | Ágnes Mina Barti | 86 | 0.26 | – | ||||
| Total valid votes | 33,547 | 99.47 | – | |||||
| Total rejected ballots | 178 | 0.53 | – | |||||
| Turnout | 33,725 | 76.89 | +24.12 | |||||
| Electors on the lists | 43,861 | – | – | |||||
* Result compared to Action démocratique
| 2008 Quebec general election | ||||||||
|---|---|---|---|---|---|---|---|---|
| Party | Candidate | Votes | % | ±% | ||||
| Liberal | Geoffrey Kelley | 20,433 | 80.85 | +10.61 | ||||
| Green | Ryan Young | 1,897 | 7.51 | -3.57 | ||||
| Parti Québécois | Olivier Gendreau | 1,522 | 6.02 | +1.80 | ||||
| Action démocratique | Marie-Hélène Trudel | 969 | 3.83 | -8.58 | ||||
| Québec solidaire | Marianne Breton-Fontaine | 364 | 1.44 | -0.09 | ||||
| Marxist–Leninist | Marsha Fine | 87 | 0.34 | – | ||||
| Total valid votes | 25,272 | 99.32 | – | |||||
| Total rejected ballots | 174 | 0.68 | – | |||||
| Turnout | 25,446 | 52.77 | -14.58 | |||||
| Electors on the lists | 48,221 | – | – | |||||
| 2007 Quebec general election | ||||||||
|---|---|---|---|---|---|---|---|---|
| Party | Candidate | Votes | % | ±% | ||||
| Liberal | Geoffrey Kelley | 22,481 | 70.24 | -16.55 | ||||
| Action démocratique | Walter Rulli | 3,973 | 12.41 | +8.79 | ||||
| Green | Ryan Young | 3,545 | 11.08 | +8.98 | ||||
| Parti Québécois | Sophia Caporicci | 1,352 | 4.22 | -1.25 | ||||
| Québec solidaire | Jill Hanley | 491 | 1.53 | – | ||||
| Independent | Andy Srougi | 166 | 0.52 | – | ||||
| Total valid votes | 32,008 | 99.48 | – | |||||
| Total rejected ballots | 166 | 0.52 | – | |||||
| Turnout | 32,174 | 67.35 | -2.89 | |||||
| Electors on the lists | 47,774 | – | – | |||||
| 2003 Quebec general election | ||||||||
|---|---|---|---|---|---|---|---|---|
| Party | Candidate | Votes | % | ±% | ||||
| Liberal | Geoffrey Kelley | 30,035 | 86.79 | +3.12 | ||||
| Parti Québécois | Guy Amyot | 1,894 | 5.47 | -2.95 | ||||
| Action démocratique | Jeffrey Penney | 1,253 | 3.62 | +0.08 | ||||
| Green | Ryan Young | 727 | 2.10 | – | ||||
| Equality | Keith Henderson | 650 | 1.88 | -1.94 | ||||
| No designation | Daniel Cormier-Roach | 49 | 0.14 | – | ||||
| 1998 Quebec general election | ||||||||
|---|---|---|---|---|---|---|---|---|
| Party | Candidate | Votes | % | ±% | ||||
| Liberal | Geoffrey Kelley | 32,924 | 83.67 | +0.02 | ||||
| Parti Québécois | Guy Amyot | 3,315 | 8.42 | -0.35 | ||||
| Equality | William F. Shaw | 1,502 | 3.82 | -2.33 | ||||
| Action démocratique | Alexandre Barnes | 1,392 | 3.54 | – | ||||
| Socialist Democracy | Eugène Busque | 217 | 0.55 | – | ||||
| 1995 Quebec referendum | |||
|---|---|---|---|
| Side | Votes | % | |
| Non | 40,689 | 91.02 | |
| Oui | 4,016 | 8.98 | |
| 1994 Quebec general election | ||||||||
|---|---|---|---|---|---|---|---|---|
| Party | Candidate | Votes | % | ±% | ||||
| Liberal | Geoffrey Kelley | 32,839 | 83.65 | +42.13 | ||||
| Parti Québécois | Maurice Crépeau | 3,441 | 8.77 | -0.22 | ||||
| Equality | Neil Cameron | 2,415 | 6.15 | -37.75 | ||||
| Natural Law | Maurice Bergeron | 206 | 0.52 | – | ||||
| CANADA! | Gilles Florent Pepin | 186 | 0.47 | – | ||||
| Economic | Karl Berryman | 94 | 0.24 | – | ||||
| Communist | Jacques Hardy | 76 | 0.19 | – | ||||
| 1992 Charlottetown Accord referendum | |||
|---|---|---|---|
| Side | Votes | % | |
| Oui | 33,272 | 83.47 | |
| Non | 6,588 | 16.53 | |
| 1989 Quebec general election | ||||||||
|---|---|---|---|---|---|---|---|---|
| Party | Candidate | Votes | % | ±% | ||||
| Equality | Neil Cameron | 14,821 | 43.90 | – | ||||
| Liberal | Joan Dougherty | 14,019 | 41.52 | -38.84 | ||||
| Parti Québécois | Claudette Montpetit | 3,035 | 8.99 | -3.74 | ||||
| Green | Amy E. Barratt | 1,419 | 4.20 | +3.17 | ||||
| New Democratic | Thomas Ezzy | 228 | 0.68 | -2.72 | ||||
| } | Independent | Neal Ford | 192 | 0.57 | – | |||
| } | Independent | Howard Galganov | 50 | 0.15 | – | |||
References
- http://www.electionsquebec.qc.ca/english/provincial/electoral-map/general-information-on-the-provincial-electoral-divisions-2011.php?bsq=409§ion=population
- http://www.electionsquebec.qc.ca/english/provincial/electoral-map/general-information-on-the-provincial-electoral-divisions-2011.php?bsq=409§ion=superficie
External links
- Information
- Election results
- Election results (National Assembly)
- Election results (QuébecPolitique)
- Maps
- 2011 map (PDF)
- 2001 map (Flash)
- 2001–2011 changes (Flash)
- 1992–2001 changes (Flash)
- Electoral map of Montréal region
- Quebec electoral map, 2011
Neighbouring electoral districts | ||||||||||
|---|---|---|---|---|---|---|---|---|---|---|
| ||||||||||
This article is issued from Wikipedia. The text is licensed under Creative Commons - Attribution - Sharealike. Additional terms may apply for the media files.