La Pinière
La Pinière is a provincial electoral district in the Montérégie region of Quebec, Canada that elects members to the National Assembly of Quebec. Its territory corresponds to the city of Brossard, less its "P" and "V" sectors that are located north of Autoroute 10 and west of Taschereau Boulevard.
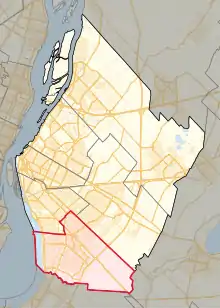 Location in Longueuil | |||
| Provincial electoral district | |||
| Legislature | National Assembly of Quebec | ||
| MNA |
Liberal | ||
| District created | 1988 | ||
| First contested | 1989 | ||
| Last contested | 2018 | ||
| Demographics | |||
| Population (2011) | 79,140 | ||
| Electors (2012)[1] | 58,142 | ||
| Area (km²)[2] | 52.0 | ||
| Pop. density (per km²) | 1,521.9 | ||
| Census division(s) | Longueuil (part) | ||
| Census subdivision(s) | Brossard | ||
It was created for the 1989 election from part of La Prairie electoral district.
In the change from the 2001 to the 2011 electoral map, its territory was unchanged.
In the change from the 2011 to the 2017 electoral map, it will lose the area around the Champlain Mall to the riding of Laporte.
Members of the National Assembly
This riding has elected the following Members of the National Assembly:
| Legislature | Years | Member | Party | |
|---|---|---|---|---|
| Riding created from La Prairie | ||||
| 34th | 1989–1994 | Jean-Pierre Saintonge | Liberal | |
| 35th | 1994–1998 | Fatima Houda-Pepin | ||
| 36th | 1998–2003 | |||
| 37th | 2003–2007 | |||
| 38th | 2007–2008 | |||
| 39th | 2008–2012 | |||
| 40th | 2012–2014 | |||
| 2014–2014 | Independent | |||
| 41st | 2014–2018 | Gaétan Barrette | Liberal | |
| 42nd | 2018–Present | |||
Election results
| 2018 Quebec general election | ||||||||
|---|---|---|---|---|---|---|---|---|
| Party | Candidate | Votes | % | ±% | ||||
| Liberal | Gaétan Barrette | 15,476 | 47.07 | -11.22 | ||||
| Coalition Avenir Québec | Sylvia Baronian | 9,480 | 28.83 | +16.25 | ||||
| Québec solidaire | Marie Pagès | 3,300 | 10.04 | +6.16 | ||||
| Parti Québécois | Suzanne Gagnon | 2,921 | 8.88 | -15.6 | ||||
| Green | Aziza Dini | 585 | 1.78 | -0.13 | ||||
| Conservative | Anwar El Youbi | 435 | 1.32 | +0.66 | ||||
| New Democratic | Djaouida Sellah | 354 | 1.08 | New | ||||
| Independent | Patrick Hayes | 168 | 0.51 | - | ||||
| Independent | Fang Hu | 161 | 0.49 | - | ||||
| Total valid votes | 32,869 | 98.69 | -0.16 | |||||
| Total rejected ballots | 390 | 1.31 | +0.16 | |||||
| Turnout | 33,304 | 61.07 | -13.7 | |||||
| Electors on the lists | 54,534 | - | - | |||||
| 2014 Quebec general election | ||||||||
|---|---|---|---|---|---|---|---|---|
| Party | Candidate | Votes | % | ±% | ||||
| Liberal | Gaétan Barrette | 25,955 | 58.29 | +9.04 | ||||
| Independent | Fatima Houda-Pepin | 10,452 | 23.47 | -25.78 | ||||
| Coalition Avenir Québec | Jin Kim | 5,600 | 12.58 | -11.92 | ||||
| Québec solidaire | Johane Beaupré | 1,728 | 3.88 | -0.51 | ||||
| Option nationale | François Létourneau-Prézeau | 534 | 1.20 | +0.16 | ||||
| Conservative | Sebastian Fernandez | 256 | 0.57 | -0.07 | ||||
| Total valid votes | 44,525 | 98.85 | – | |||||
| Total rejected ballots | 520 | 1.15 | +0.28 | |||||
| Turnout | 45,045 | 74.77 | +2.64 | |||||
| Electors on the lists | 60,247 | – | – | |||||
| Liberal hold | Swing | -7.22 | ||||||
| 2012 Quebec general election | ||||||||
|---|---|---|---|---|---|---|---|---|
| Party | Candidate | Votes | % | ±% | ||||
| Liberal | Fatima Houda-Pepin | 20,551 | 49.25 | -12.19 | ||||
| Coalition Avenir Québec | François Lemay | 10,220 | 24.49 | +14.57* | ||||
| Parti Québécois | Pierre O. Thibert | 7,448 | 17.85 | -6.92 | ||||
| Québec solidaire | Johane Beaupré | 1,832 | 4.39 | +0.98 | ||||
| Green | Marc-André Beauchemin | 798 | 1.91 | -8.01 | ||||
| Option nationale | Mylaine Larocque | 433 | 1.04 | – | ||||
| Conservative | Claude Chalhoub | 269 | 0.64 | – | ||||
| Quebec Citizens' Union | Sean Connolly-Boutin | 111 | 0.27 | – | ||||
| Marxist–Leninist | Serge Patenaude | 62 | 0.15 | -0.31 | ||||
| Total valid votes | 41,724 | 99.12 | – | |||||
| Total rejected ballots | 369 | 0.88 | – | |||||
| Turnout | 42,093 | 72.13 | +19.96 | |||||
| Electors on the lists | 58,360 | – | – | |||||
* Result compared to Action démocratique
| 2008 Quebec general election | ||||||||
|---|---|---|---|---|---|---|---|---|
| Party | Candidate | Votes | % | ±% | ||||
| Liberal | Fatima Houda-Pepin | 17,480 | 61.44 | +11.00 | ||||
| Parti Québécois | Jocelyne Duguay-Varfalvy | 7,046 | 24.77 | +6.96 | ||||
| Action démocratique | Marc-André Beauchemin | 2,822 | 9.92 | -14.62 | ||||
| Québec solidaire | Nadine Beaudoin | 971 | 3.41 | +0.97 | ||||
| Marxist–Leninist | Serge Patenaude | 131 | 0.46 | – | ||||
| Total valid votes | 28,450 | 98.50 | – | |||||
| Total rejected ballots | 434 | 1.50 | – | |||||
| Turnout | 28,884 | 52.17 | -14.34 | |||||
| Electors on the lists | 55,370 | – | – | |||||
| 2007 Quebec general election | ||||||||
|---|---|---|---|---|---|---|---|---|
| Party | Candidate | Votes | % | ±% | ||||
| Liberal | Fatima Houda-Pepin | 17,786 | 50.44 | -13.92 | ||||
| Action démocratique | Marc-André Beauchemin | 8,654 | 24.54 | +13.01 | ||||
| Parti Québécois | Saloua Hassoun | 6,281 | 17.81 | -4.91 | ||||
| Green | Claude Breton | 1,684 | 4.78 | – | ||||
| Québec solidaire | Jean-Claude Bernheim | 860 | 2.44 | – | ||||
| Total valid votes | 35,265 | 99.13 | – | |||||
| Total rejected ballots | 311 | 0.87 | – | |||||
| Turnout | 35,576 | 66.51 | -3.45 | |||||
| Electors on the lists | 53,488 | – | – | |||||
| 2003 Quebec general election | ||||||||
|---|---|---|---|---|---|---|---|---|
| Party | Candidate | Votes | % | ±% | ||||
| Liberal | Fatima Houda-Pepin | 22,474 | 64.36 | +3.63 | ||||
| Parti Québécois | Marcel Lussier | 7,934 | 22.72 | -6.82 | ||||
| Action démocratique | Gérard Lachance | 4,026 | 11.53 | +2.68 | ||||
| Bloc Pot | Inti Ortega | 487 | 1.39 | – | ||||
| 1998 Quebec general election | ||||||||
|---|---|---|---|---|---|---|---|---|
| Party | Candidate | Votes | % | ±% | ||||
| Liberal | Fatima Houda-Pepin | 22,849 | 60.73 | -1.95 | ||||
| Parti Québécois | Marià Teresa Pérez-Hudon | 11,113 | 29.54 | -4.81 | ||||
| Action démocratique | François Hébert | 3,330 | 8.85 | – | ||||
| Democratic Socialist | Gabriel Ste-Marie | 125 | 0.33 | – | ||||
| Independent | Gislaine Langlois | 78 | 0.21 | – | ||||
| Innovateur | Jean Marie Belin | 75 | 0.20 | – | ||||
| Independent | Jason Wabha | 52 | 0.14 | – | ||||
| 1995 Quebec referendum | |||
|---|---|---|---|
| Side | Votes | % | |
| Non | 28,261 | 66.88 | |
| Oui | 13,996 | 33.12 | |
| 1994 Quebec general election | ||||||||
|---|---|---|---|---|---|---|---|---|
| Party | Candidate | Votes | % | ±% | ||||
| Liberal | Fatima Houda-Pepin | 22,252 | 62.68 | +4.52 | ||||
| Parti Québécois | André Kahlé | 12,195 | 34.35 | -0.13 | ||||
| Natural Law | Jennyfer Leung | 597 | 1.68 | – | ||||
| Sovereignty | Debbie Dutrisac | 457 | 1.29 | – | ||||
| 1992 Charlottetown Accord referendum | |||
|---|---|---|---|
| Side | Votes | % | |
| Oui | 20,526 | 56.87 | |
| Non | 15,568 | 43.13 | |
| 1989 Quebec general election | ||||||||
|---|---|---|---|---|---|---|---|---|
| Party | Candidate | Votes | % | |||||
| Liberal | Jean-Pierre Saintonge | 17,155 | 58.16 | |||||
| Parti Québécois | Christiane Rouillard Lafontaine | 10,170 | 34.48 | |||||
| New Democratic | Luis Martinez | 1,237 | 4.19 | |||||
| Parti indépendantiste | François Gilbert | 935 | 3.17 | |||||
References
- http://www.electionsquebec.qc.ca/english/provincial/electoral-map/general-information-on-the-provincial-electoral-divisions-2011.php?bsq=203§ion=population
- http://www.electionsquebec.qc.ca/english/provincial/electoral-map/general-information-on-the-provincial-electoral-divisions-2011.php?bsq=203§ion=superficie
External links
- Information
- Election results
- Election results (National Assembly)
- Election results (QuébecPolitique)
- Maps
- 2011 map (PDF)
- 2001 map (Flash)
- 2001–2011 changes (Flash)
- 1992–2001 changes (Flash)
- Electoral map of Montérégie region
- Quebec electoral map, 2011
Neighbouring electoral districts | ||||||||||
|---|---|---|---|---|---|---|---|---|---|---|
| ||||||||||
This article is issued from Wikipedia. The text is licensed under Creative Commons - Attribution - Sharealike. Additional terms may apply for the media files.