Labangan, Zamboanga del Sur
Labangan, officially the Municipality of Labangan (Cebuano: Lungsod sa Labangan; Subanen: Benwa Labangan; Chavacano: Municipalidad de Labangan; Tagalog: Bayan ng Labangan), is a 3rd class municipality in the province of Zamboanga del Sur, Philippines. According to the 2015 census, it has a population of 41,790 people. [3]
Labangan | |
|---|---|
| Municipality of Labangan | |
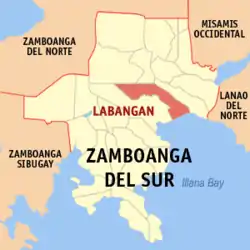 Map of Zamboanga del Sur with Labangan highlighted | |
OpenStreetMap 
| |
.svg.png.webp) Labangan Location within the Philippines | |
| Coordinates: 7°52′00″N 123°31′00″E | |
| Country | |
| Region | Zamboanga Peninsula (Region IX) |
| Province | Zamboanga del Sur |
| District | 2nd District |
| Founded | July 20, 1949 |
| Barangays | 30 (see Barangays) |
| Government | |
| • Type | Sangguniang Bayan |
| • Mayor | Eduardo D. Relacion |
| • Vice Mayor | Marlon B. Valenzuela |
| • Representative | Divina Grace C. Yu |
| • Electorate | 29,339 voters (2019) |
| Area | |
| • Total | 157.90 km2 (60.97 sq mi) |
| Elevation | 21 m (69 ft) |
| Population | |
| • Total | 41,790 |
| • Density | 260/km2 (690/sq mi) |
| • Households | 8,428 |
| Economy | |
| • Income class | 3rd municipal income class |
| • Poverty incidence | 33.64% (2015)[4] |
| • Revenue | ₱105,629,646.74 (2016) |
| Time zone | UTC+8 (PST) |
| ZIP code | 7017 |
| PSGC | |
| IDD : area code | +63 (0)62 |
| Climate type | tropical climate |
| Native languages | Subanon Cebuano Chavacano Tagalog |
Barangays
Labangan is politically subdivided into 25 barangays.
- Bagalupa
- Balimbingan (West Luya)
- Binayan
- Bokong
- Bulanit
- Cogonan
- Combo
- Dalapang
- Dimasangca
- Dipaya
- Langapod
- Lantian
- Lower Campo Islam (Poblacion)
- Lower Pulacan
- Lower Sang-an
- New Labangan
- Noboran
- Old Labangan
- San Isidro
- Santa Cruz
- Tapodoc
- Tawagan Norte
- Upper Campo Islam (Poblacion)
- Upper Pulacan
- Upper Sang-an
Climate
| Climate data for Labangan, Zamboanga del Sur | |||||||||||||
|---|---|---|---|---|---|---|---|---|---|---|---|---|---|
| Month | Jan | Feb | Mar | Apr | May | Jun | Jul | Aug | Sep | Oct | Nov | Dec | Year |
| Average high °C (°F) | 30 (86) |
31 (88) |
31 (88) |
32 (90) |
30 (86) |
30 (86) |
29 (84) |
29 (84) |
30 (86) |
29 (84) |
30 (86) |
30 (86) |
30 (86) |
| Average low °C (°F) | 23 (73) |
23 (73) |
23 (73) |
24 (75) |
24 (75) |
24 (75) |
24 (75) |
24 (75) |
24 (75) |
24 (75) |
24 (75) |
23 (73) |
24 (74) |
| Average precipitation mm (inches) | 48 (1.9) |
44 (1.7) |
56 (2.2) |
56 (2.2) |
112 (4.4) |
135 (5.3) |
124 (4.9) |
124 (4.9) |
115 (4.5) |
134 (5.3) |
90 (3.5) |
56 (2.2) |
1,094 (43) |
| Average rainy days | 13.0 | 11.7 | 15.6 | 18.1 | 25.6 | 25.7 | 25.2 | 24.1 | 23.8 | 26.1 | 22.3 | 16.5 | 247.7 |
| Source: Meteoblue [5] | |||||||||||||
Demographics
| Year | Pop. | ±% p.a. |
|---|---|---|
| 1960 | 12,921 | — |
| 1970 | 15,965 | +2.14% |
| 1975 | 16,257 | +0.36% |
| 1980 | 18,473 | +2.59% |
| 1990 | 29,229 | +4.70% |
| 1995 | 32,264 | +1.87% |
| 2000 | 34,530 | +1.47% |
| 2007 | 37,598 | +1.18% |
| 2010 | 39,168 | +1.50% |
| 2015 | 41,790 | +1.24% |
| Source: Philippine Statistics Authority [3] [6] [7][8] | ||
Attractions
- Pulacan Falls - 12 km. from Pagadian City, and covering an area of 400 square meters. It is the source of water for the Labangan irrigation system. Two kilometers from the area is the 134-hectare Home Defense Center. The falls can be reached easily by any motor vehicle. With the opening of the PADAP road, Pulacan Falls became a beautiful camping and picnic site. It now has a permanent Boy and Girl Scout site with facilities and has been the location of regional and provincial jamborees.
- Army Site - The new division site of 1st Infantry (TABAK) Division, Philippine Army, is located on the top of the Hill of Kuta Major Cesar L Sang-an.
References
- Municipality of Labangan | (DILG)
- "Province: Zamboanga del Sur". PSGC Interactive. Quezon City, Philippines: Philippine Statistics Authority. Retrieved 12 November 2016.
- Census of Population (2015). "Region IX (Zamboanga Peninsula)". Total Population by Province, City, Municipality and Barangay. PSA. Retrieved 20 June 2016.
- "PSA releases the 2015 Municipal and City Level Poverty Estimates". Quezon City, Philippines. Retrieved 12 October 2019.
- "Labangan: Average Temperatures and Rainfall". Meteoblue. Retrieved 1 May 2020.
- Census of Population and Housing (2010). "Region IX (Zamboanga Peninsula)". Total Population by Province, City, Municipality and Barangay. NSO. Retrieved 29 June 2016.
- Censuses of Population (1903–2007). "Region IX (Zamboanga Peninsula)". Table 1. Population Enumerated in Various Censuses by Province/Highly Urbanized City: 1903 to 2007. NSO.
- "Province of Zamboanga del Sur". Municipality Population Data. Local Water Utilities Administration Research Division. Retrieved 17 December 2016.
External links
Places adjacent to Labangan, Zamboanga del Sur | |
|---|---|
Pagadian (capital) | |
| Municipalities | |
| Component city | |
| Highly urbanized city |
|
This article is issued from Wikipedia. The text is licensed under Creative Commons - Attribution - Sharealike. Additional terms may apply for the media files.