Tambulig
Tambulig, officially the Municipality of Tambulig (Cebuano: Lungsod sa Tambulig; Subanen: Benwa Tambulig; Chavacano: Municipalidad de Tambulig; Tagalog: Bayan ng Tambulig), is a 4th class municipality in the province of Zamboanga del Sur, Philippines. According to the 2015 census, it has a population of 36,160 people. [3]
Tambulig | |
|---|---|
| Municipality of Tambulig | |
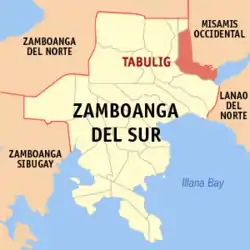 Map of Zamboanga del Sur with Tambulig highlighted | |
OpenStreetMap 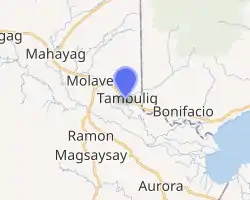
| |
.svg.png.webp) Tambulig Location within the Philippines | |
| Coordinates: 8°04′N 123°32′E | |
| Country | |
| Region | Zamboanga Peninsula (Region IX) |
| Province | Zamboanga del Sur |
| District | 1st District |
| Founded | December 27, 1957 |
| Barangays | 31 (see Barangays) |
| Government | |
| • Type | Sangguniang Bayan |
| • Mayor | Charlotte Panal |
| • Vice Mayor | Jonathan O. Butad |
| • Representative | Divina Grace C. Yu |
| • Electorate | 24,004 voters (2019) |
| Area | |
| • Total | 130.65 km2 (50.44 sq mi) |
| Elevation | 76 m (249 ft) |
| Population | |
| • Total | 36,160 |
| • Density | 280/km2 (720/sq mi) |
| • Households | 7,686 |
| Economy | |
| • Income class | 4th municipal income class |
| • Poverty incidence | 38.97% (2015)[4] |
| • Revenue | ₱99,512,191.87 (2016) |
| Time zone | UTC+8 (PST) |
| ZIP code | 7025 |
| PSGC | |
| IDD : area code | +63 (0)62 |
| Climate type | tropical climate |
| Native languages | Subanon Cebuano Chavacano Tagalog |
| Website | www |
Barangays
Tambulig is politically subdivided into 31 barangays.
- Alang-alang
- Angeles
- Bag-ong Kauswagan
- Bag-ong Tabogon
- Balugo
- Cabgan
- Calolot
- Dimalinao
- Fabian (Balucot)
- Gabunon
- Happy Valley (Poblacion)
- Kapalaran
- Libato
- Limamaan
- Lower Liasan
- Lower Lodiong (Poblacion)
- Lower Tiparak
- Lower Usogan
- Maya-maya
- New Village (Poblacion)
- Pelocuban
- Riverside (Poblacion)
- Sagrada Familia
- San Jose
- San Vicente
- Sumalig
- Tuluan
- Tungawan
- Upper Liaison
- Upper Lodiong
- Upper Tiparak
Climate
| Climate data for Tambulig, Zamboanga del Sur | |||||||||||||
|---|---|---|---|---|---|---|---|---|---|---|---|---|---|
| Month | Jan | Feb | Mar | Apr | May | Jun | Jul | Aug | Sep | Oct | Nov | Dec | Year |
| Average high °C (°F) | 29 (84) |
30 (86) |
30 (86) |
31 (88) |
30 (86) |
30 (86) |
29 (84) |
30 (86) |
30 (86) |
30 (86) |
30 (86) |
29 (84) |
30 (86) |
| Average low °C (°F) | 22 (72) |
22 (72) |
22 (72) |
23 (73) |
24 (75) |
24 (75) |
24 (75) |
24 (75) |
24 (75) |
24 (75) |
23 (73) |
23 (73) |
23 (74) |
| Average precipitation mm (inches) | 69 (2.7) |
58 (2.3) |
67 (2.6) |
60 (2.4) |
109 (4.3) |
114 (4.5) |
83 (3.3) |
78 (3.1) |
76 (3.0) |
92 (3.6) |
86 (3.4) |
63 (2.5) |
955 (37.7) |
| Average rainy days | 12.8 | 11.6 | 14.8 | 17.4 | 24.8 | 23.5 | 20.7 | 18.5 | 17.4 | 22.5 | 21.6 | 15.6 | 221.2 |
| Source: Meteoblue [5] | |||||||||||||
Demographics
| Year | Pop. | ±% p.a. |
|---|---|---|
| 1960 | 18,165 | — |
| 1970 | 19,140 | +0.52% |
| 1975 | 22,041 | +2.87% |
| 1980 | 17,740 | −4.25% |
| 1990 | 27,796 | +4.59% |
| 1995 | 29,147 | +0.89% |
| 2000 | 31,399 | +1.61% |
| 2007 | 34,242 | +1.20% |
| 2010 | 34,883 | +0.68% |
| 2015 | 36,160 | +0.69% |
| Source: Philippine Statistics Authority [3] [6] [7][8] | ||
References
- Municipality of Tambulig | (DILG)
- "Province: Zamboanga del Sur". PSGC Interactive. Quezon City, Philippines: Philippine Statistics Authority. Retrieved 12 November 2016.
- Census of Population (2015). "Region IX (Zamboanga Peninsula)". Total Population by Province, City, Municipality and Barangay. PSA. Retrieved 20 June 2016.
- "PSA releases the 2015 Municipal and City Level Poverty Estimates". Quezon City, Philippines. Retrieved 12 October 2019.
- "Tambulig: Average Temperatures and Rainfall". Meteoblue. Retrieved 1 May 2020.
- Census of Population and Housing (2010). "Region IX (Zamboanga Peninsula)". Total Population by Province, City, Municipality and Barangay. NSO. Retrieved 29 June 2016.
- Censuses of Population (1903–2007). "Region IX (Zamboanga Peninsula)". Table 1. Population Enumerated in Various Censuses by Province/Highly Urbanized City: 1903 to 2007. NSO.
- "Province of Zamboanga del Sur". Municipality Population Data. Local Water Utilities Administration Research Division. Retrieved 17 December 2016.
External links
Places adjacent to Tambulig | |
|---|---|
Pagadian (capital) | |
| Municipalities | |
| Component city | |
| Highly urbanized city |
|
This article is issued from Wikipedia. The text is licensed under Creative Commons - Attribution - Sharealike. Additional terms may apply for the media files.
