List of German cities by GDP
The following article sorts the 107 urban districts (Kreisfreie Städte – cities that constitute districts in their own right) and the metropolitan districts of Hanover, Aachen and Saarbrücken by their gross domestic product in the year 2018. Most figures are from the Federal Statistical Office of Germany; figures from other sources are otherwise referenced. The GDP of German cities are shown in EUR€.[1]
| Rank | City | State | Gross Domestic Product in billion € |
Gross Domestic Product per capita in € |
Gross Domestic Product per employee in € |
|---|---|---|---|---|---|
| 1 | Berlin | 145.547 | 40,105 | 72,186 | |
| 2 | Hamburg | 118.912 | 64,771 | 93,318 | |
| 3 | Munich | 116.647 | 79,690 | 103,355 | |
| 4 | Frankfurt am Main | 70.639 | 94,190 | 97,735 | |
| 5 | Cologne | 64.536 | 59,588 | 83,011 | |
| 6 | Stuttgart | 57.369 | 90,518 | 105,982 | |
| 7 | Hanover Region | 52.655 | 45,583 | 75,623 | |
| 8 | Düsseldorf | 50.429 | 81,563 | 92,974 | |
| 9 | Nuremberg | 31.374 | 60,711 | 78,328 | |
| 10 | Bremen | 28.818 | 50,675 | 77,304 | |
| 11 | Bonn | 26.204 | 80,288 | 104,082 | |
| 12 | Essen | 25.293 | 43,365 | 75,088 | |
| 13 | Wolfsburg | 22.611 | 182,301 | 171,922 | |
| 14 | Dortmund | 22.574 | 38,469 | 68,811 | |
| 15 | Dresden | 22.404 | 40,524 | 66,541 | |
| 16 | Leipzig | 21.502 | 36,761 | 62,815 | |
| 17 | Mannheim | 20.921 | 67,775 | 86,269 | |
| 18 | Aachen (district) | 20.877 | 37,631 | 68,282 | |
| 19 | Karlsruhe | 20.475 | 65,518 | 85,070 | |
| 20 | Braunschweig | 19.371 | 78,057 | 115,003 | |
| 21 | Duisburg | 18.177 | 36,475 | 78,085 | |
| 22 | Wiesbaden | 17.692 | 63,527 | 93,619 | |
| 23 | Ingolstadt | 17.394 | 127,792 | 136,075 | |
| 24 | Münster | 17.267 | 55,003 | 74,457 | |
| 25 | Saarbrücken (district) | 14.815 | 44,904 | 69,276 | |
| 26 | Augsburg | 14.537 | 49,447 | 73,323 | |
| 27 | Ludwigshafen am Rhein | 13.811 | 81,349 | 108,972 | |
| 28 | Bielefeld | 13.665 | 41,016 | 64,126 | |
| 29 | Regensburg | 13.239 | 87,245 | 82,347 | |
| 30 | Wuppertal | 12.895 | 36,429 | 73,612 | |
| 31 | Darmstadt | 12.364 | 77,892 | 97,735 | |
| 32 | Mainz | 12.344 | 57,120 | 77,907 | |
| 33 | Bochum | 12.110 | 33,171 | 64,558 | |
| 34 | Freiburg im Breisgau | 11.909 | 87,245 | 67,227 | |
| 35 | Kiel | 11.802 | 47,639 | 68,066 | |
| 36 | Erlangen | 10.936 | 98,097 | 100,006 | |
| 37 | Kassel | 10.452 | 51,960 | 67,704 | |
| 38 | Ulm | 9.725 | 77,208 | 77,140 | |
| 39 | Lübeck | 9.487 | 43,769 | 72,500 | |
| 40 | Krefeld | 9.209 | 40,593 | 74,223 | |
| 41 | Heidelberg | 9.167 | 57,123 | 73,696 | |
| 42 | Chemnitz | 8.883 | 35,961 | 59,914 | |
| 43 | Mönchengladbach | 8.846 | 33,785 | 64,505 | |
| 44 | Erfurt | 8.473 | 39,715 | 59,766 | |
| 45 | Leverkusen | 8.426 | 51,469 | 101,668 | |
| 46 | Magdeburg | 8.237 | 34,525 | 59,385 | |
| 47 | Osnabrück | 8.198 | 49,817 | 62,628 | |
| 48 | Würzburg | 8.161 | 64,131 | 63,845 | |
| 49 | Gelsenkirchen | 7.879 | 30,248 | 67,943 | |
| 50 | Koblenz | 7.800 | 68,464 | 72,202 | |
| 51 | Oldenburg | 7.779 | 46,404 | 64,522 | |
| 52 | Rostock | 7.568 | 36,270 | 63,936 | |
| 53 | Potsdam | 7.507 | 42,440 | 65,358 | |
| 54 | Halle an der Saale | 7.405 | 30,955 | 59,385 | |
| 55 | Heilbronn | 6.993 | 55,707 | 71,623 | |
| 56 | Hagen | 6.558 | 34,831 | 66,313 | |
| 57 | Mülheim an der Ruhr | 6.007 | 35,115 | 74,070 | |
| 58 | Salzgitter | 5.902 | 56,347 | 100,785 | |
| 59 | Oberhausen | 5.741 | 27,191 | 61,932 | |
| 60 | Schweinfurt | 5.676 | 105,637 | 86,014 | |
| 61 | Hamm | 5.308 | 29,631 | 63,542 | |
| 62 | Aschaffenburg | 5.232 | 74,500 | 85,100 | |
| 63 | Pforzheim | 5.057 | 40,484 | 65,465 | |
| 64 | Solingen | 5.033 | 31,642 | 68,028 | |
| 65 | Jena | 4.993 | 44,877 | 69,414 | |
| 66 | Bamberg | 4.948 | 63,945 | 63,667 | |
| 67 | Trier | 4.918 | 44,579 | 61,681 | |
| 68 | Kaiserslautern | 4.822 | 48,336 | 66,693 | |
| 69 | Fürth | 4.787 | 37,656 | 74,847 | |
| 70 | Bayreuth | 4.753 | 63,954 | 70,442 | |
| 71 | Offenbach am Main | 4.726 | 37,008 | 69,434 | |
| 72 | Landshut | 4.070 | 56,684 | 71,637 | |
| 73 | Coburg | 4.044 | 98,042 | 96,351 | |
| 74 | Remscheid | 4.032 | 36,391 | 66,376 | |
| 75 | Bremerhaven | 4.017 | 35,448 | 63,421 | |
| 76 | Schwerin | 3.806 | 39,728 | 57,631 | |
| 77 | Flensburg | 3.771 | 42,364 | 56,779 | |
| 78 | Emden | 3.678 | 72,973 | 86,425 | |
| 79 | Kempten (Allgäu) | 3.659 | 53,324 | 70,891 | |
| 80 | Herne | 3.627 | 23,188 | 58,296 | |
| 81 | Passau | 3.547 | 68,044 | 65,335 | |
| 82 | Cottbus | 3.528 | 35,063 | 56,421 | |
| 83 | Neumünster | 3.435 | 43,260 | 64,394 | |
| 84 | Rosenheim | 3.255 | 51,494 | 64,873 | |
| 85 | Worms | 3.189 | 38,324 | 70,804 | |
| 86 | Wilhelmshaven | 3.164 | 41,479 | 69,287 | |
| 87 | Baden-Baden | 3.008 | 54,776 | 70,948 | |
| 88 | Memmingen | 2.715 | 62,187 | 68,984 | |
| 89 | Gera | 2.704 | 28,613 | 55,868 | |
| 90 | Speyer | 2.672 | 52,749 | 67,273 | |
| 91 | Bottrop | 2.669 | 22,740 | 55,297 | |
| 92 | Amberg | 2.595 | 61,617 | 71,253 | |
| 93 | Straubing | 2.528 | 53,008 | 61,127 | |
| 94 | Ansbach | 2.431 | 58,222 | 64,572 | |
| 95 | Dessau-Roßlau | 2.418 | 29,610 | 57,309 | |
| 96 | Weiden in der Oberpfalz | 2.381 | 55,976 | 57,004 | |
| 97 | Brandenburg an der Havel | 2.283 | 31,709 | 57,774 | |
| 98 | Frankfurt an der Oder | 2.164 | 37,277 | 56,545 | |
| 99 | Landau in der Pfalz | 1.983 | 42,662 | 59,334 | |
| 100 | Weimar | 1.982 | 30,601 | 57,895 | |
| 101 | Hof (Saale) | 1.981 | 43,132 | 57,004 | |
| 102 | Delmenhorst | 1.779 | 22,930 | 54,248 | |
| 103 | Zweibrücken | 1.703 | 49,723 | 75,236 | |
| 104 | Kaufbeuren | 1.701 | 38,941 | 65,721 | |
| 105 | Eisenach | 1.676 | 39,401 | 59,488 | |
| 106 | Neustadt an der Weinstraße | 1.674 | 31,432 | 59,482 | |
| 107 | Frankenthal (Pfalz) | 1.639 | 33,805 | 70,008 | |
| 108 | Pirmasens | 1.511 | 37,291 | 54,974 | |
| 109 | Schwabach | 1.473 | 36,114 | 65,151 | |
| 110 | Suhl | 1.218 | 34,808 | 56,779 |
List of metropolitan regions
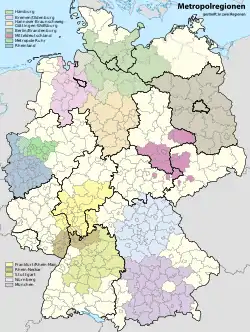
Metropolitan regions in Germany
The 11 metropolitan regions in Germany by their gross domestic product in 2014.[2]
| Rank | Metropolitan areas | Gross Domestic Product in billion € |
|---|---|---|
| 1 | Rhine-Ruhr | 431.358 |
| 2 | Munich Metropolitan Region | 283.277 |
| 3 | Frankfurt Rhine-Main | 242.428 |
| 4 | Stuttgart Metropolitan Region | 225.949 |
| 5 | Hamburg Metropolitan Region | 196.256 |
| 6 | Berlin/Brandenburg Metropolitan Region | 180.114 |
| 7 | Hannover–Braunschweig–Göttingen–Wolfsburg Metropolitan Region | 133.826 |
| 8 | Nuremberg Metropolitan Region | 123.785 |
| 9 | Rhine-Neckar Metropolitan Region | 88.041 |
| 10 | Northwest Metropolitan Region | 87.100 |
| 11 | Central German Metropolitan Region | 70.345 |
References
- Baden-Württemberg, Statistisches Landesamt. "Aktuelle Ergebnisse – VGR dL". www.statistik-bw.de (in German). Retrieved 2018-09-08.
- "Bruttoinlandsprodukt in den Metropolregionen in Deutschland 2014 | Statistik" (in German). Retrieved 2018-03-27.
This article is issued from Wikipedia. The text is licensed under Creative Commons - Attribution - Sharealike. Additional terms may apply for the media files.