List of Indian states and union territories by literacy rate
Literacy rate in India is uneven and as such, different states and union territories of India have differences in their literacy rates. The following table shows the details from 1951 to 2011 census data on total literacy rate in percentage.[2][3] According to Census 2011, Kerala has the highest total literacy rate and female literacy rate whereas Lakshadweep had the highest male literacy rate. Rajasthan has the lowest male literacy rate, while Bihar has the lowest female literacy rate. Literacy figures are collected by census takers which essentially means literacy (or lack therefore) is self assessed.[2]
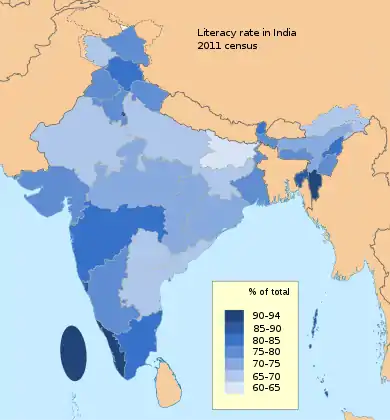
Literacy rate map of India, 2011.[1]
Recent estimates
| State or UT | Census 2011[4] | NSO survey (2017)[5] | ||||
|---|---|---|---|---|---|---|
| Average | Male | Female | Average | Male | Female | |
| 74.04 | 82.14 | 65.46 | 77.7 | 84.7 | 70.3 | |
| A&N islands[UT] | 86.27 | 90.11 | 81.84 | - | - | - |
| Andhra Pradesh[lower-alpha 1] | 67.66 | 75.56 | 59.74 | 66.4 | 73.4 | 59.5 |
| Arunachal Pradesh | 66.95 | 73.69 | 59.57 | - | - | - |
| Assam | 73.18 | 78.81 | 67.27 | 85.9 | 90.1 | 81.2 |
| West Bengal | 63.09 | 63.36 | 62.82 | 69.085 | 69.85 | 68.32 |
| Bihar | 63.82 | 73.39 | 53.33 | 70.9 | 79.7 | 60.5 |
| Chhattisgarh | 71.04 | 81.45 | 60.59 | 77.3 | 85.4 | 68.8 |
| Chandigarh[UT] | 86.43 | 90.54 | 81.38 | - | - | - |
| Dadra and Nagar Haveli[UT] | 77.65 | 86.46 | 65.93 | - | - | - |
| Daman & Diu[UT] | 87.07 | 91.48 | 79.59 | - | - | - |
| Delhi[UT] | 86.34 | 91.03 | 80.93 | |||
| Goa | 87.40 | 92.81 | 81.84 | - | - | - |
| Gujarat | 79.31 | 87.23 | 70.73 | 82.4 | 89.5 | 74.8 |
| Haryana | 76.64 | 85.38 | 66.77 | 80.4 | 88.0 | 71.3 |
| Himachal Pradesh | 83.78 | 90.83 | 76.60 | 86.6 | 92.9 | 80.5 |
| Jammu and Kashmir | 68.74 | 78.26 | 58.01 | 77.3 | 85.7 | 68.0 |
| Jharkhand | 67.63 | 78.45 | 56.21 | 74.3 | 83.0 | 64.7 |
| Karnataka | 75.60 | 82.85 | 68.13 | 77.2 | 83.4 | 70.5 |
| Kerala | 93.91 | 96.02 | 91.98 | 96.2 | 97.4 | 95.2 |
| Lakshadweep[UT] | 92.28 | 96.11 | 88.25 | - | - | - |
| Madhya Pradesh | 70.63 | 80.53 | 60.02 | 73.7 | 81.2 | 65.5 |
| Maharashtra | 82.91 | 89.82 | 75.48 | 84.8 | 90.7 | 78.4 |
| Manipur | 79.85 | 86.49 | 73.17 | - | - | - |
| Meghalya | 75.48 | 77.17 | 73.78 | - | - | - |
| Mizoram | 91.58 | 93.72 | 89.40 | - | - | - |
| Nagaland | 80.11 | 83.29 | 76.69 | - | - | - |
| Odisha | 73.45 | 82.40 | 64.36 | 77.3 | 84.0 | 70.3 |
| Puducherry[UT] | 86.55 | 92.12 | 81.22 | - | - | - |
| Punjab | 76.68 | 81.48 | 71.34 | 83.7 | 88.5 | 78.5 |
| Rajasthan | 67.06 | 80.51 | 52.66 | 69.7 | 80.8 | 57.6 |
| Sikkim | 82.20 | 87.29 | 76.43 | - | - | - |
| Tamil Nadu | 80.33 | 86.81 | 73.86 | 82.9 | 87.9 | 77.9 |
| Telangana | - | - | - | 72.8 | 80.5 | 65.1 |
| Tripura | 87.75 | 92.18 | 83.15 | - | - | - |
| Uttarakhand | 79.63 | 88.33 | 70.70 | 87.6 | 94.3 | 80.7 |
| Uttar Pradesh | 69.72 | 79.24 | 59.26 | 73.0 | 81.8 | 63.4 |
Timeline by Census
| State/UT | 1951 | 1961 | 1971 | 1981 | 1991 | 2001 | 2011 |
|---|---|---|---|---|---|---|---|
| A&N islands | 30.30 | 40.07 | 51.15 | 63.19 | 73.02 | 81.30 | 86.63 |
| Andhra Pradesh | - | 21.19 | 24.57 | 35.66 | 44.08 | 60.47 | 67.02 |
| Arunachal Pradesh | - | 7.13 | 11.29 | 25.55 | 41.59 | 54.34 | 65.39 |
| Assam | 18.53 | 32.95 | 33.94 | - | 52.89 | 63.25 | 72.19 |
| Bihar | 13.49 | 21.95 | 23.17 | 32.32 | 37.49 | 47.00 | 61.80 |
| Chandigarh | - | - | 70.43 | 74.80 | 77.81 | 81.94 | 86.05 |
| Chhattisgarh | 9.41 | 18.14 | 24.08 | 32.63 | 42.91 | 64.66 | 70.28 |
| Dadra and Nagar Haveli | - | - | 18.13 | 32.90 | 40.71 | 57.63 | 76.24 |
| Daman and Diu | - | - | - | - | 71.20 | 78.18 | 87.10 |
| Delhi | - | 61.95 | 65.08 | 71.94 | 75.29 | 81.67 | 86.21 |
| Goa | 23.48 | 35.41 | 51.96 | 65.71 | 75.51 | 82.01 | 88.70 |
| Gujarat | 21.82 | 31.47 | 36.95 | 44.92 | 61.29 | 69.14 | 78.03 |
| Haryana | - | - | 25.71 | 37.13 | 55.85 | 67.91 | 75.55 |
| Himachal Pradesh | - | - | - | - | 63.86 | 76.48 | 82.80 |
| Jammu and Kashmir | - | 12.95 | 21.71 | 30.64 | - | 55.52 | 67.16 |
| Jharkhand | 12.93 | 21.14 | 23.87 | 35.03 | 41.39 | 53.56 | 66.41 |
| Karnataka | - | 29.80 | 36.83 | 46.21 | 56.04 | 66.06 | 75.37 |
| Kerala | 47.18 | 55.08 | 69.75 | 78.85 | 89.81 | 90.86 | 94.00 |
| Lakshadweep | 15.23 | 27.15 | 51.76 | 68.42 | 81.78 | 86.66 | 91.85 |
| Madhya Pradesh | 13.16 | 21.41 | 27.27 | 38.63 | 44.67 | 63.74 | 69.32 |
| Maharashtra | 27.91 | 35.08 | 45.77 | 57.24 | 64.87 | 76.88 | 82.34 |
| Manipur | 12.57 | 36.04 | 38.47 | 49.66 | 59.89 | 70.50 | 76.90 |
| Meghalya | - | 26.92 | 29.49 | 42.05 | 49.10 | 62.56 | 74.43 |
| Mizoram | 31.14 | 44.01 | 53.80 | 59.88 | 82.26 | 88.80 | 91.33 |
| Nagaland | 10.52 | 21.95 | 33.78 | 50.28 | 61.65 | 66.59 | 79.60 |
| Odisha | 15.80 | 21.66 | 26.18 | 33.62 | 49.09 | 63.08 | 72.89 |
| Puducherry | - | 43.65 | 53.38 | 65.14 | 74.74 | 81.24 | 85.85 |
| Punjab | - | - | 34.12 | 43.37 | 58.51 | 69.65 | 75.84 |
| Rajasthan | 8.5 | 18.12 | 22.57 | 30.11 | 38.55 | 60.41 | 66.11 |
| Sikkim | - | - | 17.74 | 34.05 | 56.94 | 68.81 | 81.42 |
| Tamil Nadu | - | 36.39 | 45.40 | 54.39 | 62.66 | 73.45 | 80.09 |
| Tripura | - | 20.24 | 30.98 | 50.10 | 60.44 | 73.19 | 87.22 |
| Uttar Pradesh | 12.02 | 20.87 | 23.99 | 32.65 | 40.71 | 56.27 | 67.68 |
| Uttarakhand | 18.93 | 18.05 | 33.26 | 46.06 | 57.75 | 71.62 | 78.82 |
| West Bengal | 24.61 | 34.46 | 38.86 | 48.65 | 57.70 | 68.64 | 76.26 |
| 18.33 | 28.30 | 34.45 | 43.57 | 52.21 | 64.84 | 72.99 |
Literacy by Social Group
Literacy rate for different castes[7]
| Social Group | Rural | Urban | Rural + Urban | |||
| Male | Female | Male | Female | Male | Female | |
| ST | 75.6 | 58.8 | 91.3 | 79.6 | 77.5 | 61.3 |
| SC | 78.0 | 60.9 | 88.4 | 75.3 | 80.3 | 63.9 |
| OBC | 81.7 | 64.2 | 91.1 | 80.5 | 84.4 | 68.9 |
| OTHERS | 87.6 | 74.5 | 95.0 | 88.6 | 90.8 | 80.6 |
| ALL | 81.5 | 65.0 | 92.2 | 82.8 | 84.7 | 70.3 |
Literacy rate by different religion[8]
| Social Group | Rural | Urban | Rural + Urban | |||
| Male | Female | Male | Female | Male | Female | |
| Hindu | 81.8 | 64.5 | 93.4 | 83.8 | 85.1 | 70.0 |
| Islam | 77.4 | 64.8 | 85.8 | 75.6 | 80.6 | 68.8 |
| Christian | 84.4 | 77.0 | 95.5 | 91.4 | 88.2 | 82.2 |
| Sikhhism | 85.3 | 72.1 | 94.2 | 88.7 | 87.3 | 75.9 |
| ALL | 81.5 | 65.0 | 92.2 | 82.8 | 84.7 | 70 |
References
- Census 2011, pp. 131.
- "Census 2011, Chapter 6 (State of Literacy), p.14" (PDF). Government of India.
- "India at a glance". Government of India.
- Census 2011, pp. 110-111.
- NSO 2018, pp. 43.
- TABLE 6: STATE-WISE LITERACY RATES (PDF) (Report). Office of Registrar General India. 2011.
- NSO 2018, pp. 43, 252.
- NSO 2018, p. 252.
Notes
- ^ Administered as a Union territory directly by Central government.
- Figures from Census 2011 includes those from Telangana state as well which separated from Andhra only in 2014
- Literacy rates for 1951, 1961 and 1971 Censuses relate to population aged five years and above. The rates for the 1981, 1991, 2001 and 2011 Censuses relate to the population aged seven years and above. The literacy rate for 1951 in case of West Bengal relates to Total Population including 0-4 age group. Literacy rate for 1951 in respect of Chhattisgarh, Madhya Pradesh and Manipur are based on sample population.
- India and Manipur figures exclude those of the three sub-divisions viz., Mao Maram, Paomata and Purul of Senapati district of Manipur as census results of 2001 in these three sub-divisions were cancelled due to technical and administrative reasons.
Sources
- Census (2011), Chapter 6: State of Literacy (PDF), Government of India
- NSO (2018). Household Social Consumption on Education in India (PDF) (Report). Retrieved 30 November 2020.
Further reading
- Figures at a glance - Provisional Population Totals, Census of India, 2011 (PDF) (Report). 2011. Retrieved 1 December 2020.
This article is issued from Wikipedia. The text is licensed under Creative Commons - Attribution - Sharealike. Additional terms may apply for the media files.