List of Indian states and union territories by GDP
These are lists of Indian states and union territories by their nominal gross state domestic product (GSDP).GSDP is the sum of all value added by industries within each state or union territory and serves as a counterpart to the national gross domestic product (GDP).[1]
In India, the Government accounts for around 21% of the GDP, agriculture accounts for 21%, the corporate sector accounts for 12% and the balance 48% of the GDP is sourced from small proprietorship and partnership companies, the so-called unorganized sector and households.[2]
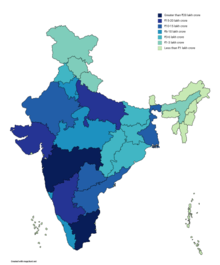
GDP of Indian states and union territories in 2019–20
GSDP
_vs_State_UT_(1).png.webp)
_vs_State_UT_(2).png.webp)
The following list gives the latest available gross state domestic product (GSDP) figures for all Indian States and Union Territories at current prices in crores (units of 10 million) or lakh crores (units of 1 trillion) of the Indian rupees. No data is available for the union territories of Dadra and Nagar Haveli and Daman and Diu, Ladakh and Lakshadweep.
| Rank | State/Union Territory | Nominal GDP (trillion INR, or ₹ lakh crore) | Data year [3][4][5][6] |
|---|---|---|---|
| 1 | Maharashtra | ₹28.78 lakh crore (US$400 billion) | 2019–20[7] |
| 2 | Tamil Nadu | ₹18.45 lakh crore (US$260 billion) | 2019–20 |
| 3 | Uttar Pradesh | ₹17.94 lakh crore (US$250 billion) | 2019–20 |
| 4 | Karnataka | ₹16.99 lakh crore (US$240 billion) | 2019–20 |
| 5 | Gujarat | ₹15.02 lakh crore (US$210 billion) | 2019–20 |
| 6 | West Bengal | ₹12.54 lakh crore (US$180 billion) | 2019–20 |
| 7 | Rajasthan | ₹10.20 lakh crore (US$140 billion) | 2019–20 |
| 8 | Andhra Pradesh | ₹9.73 lakh crore (US$140 billion) | 2019–20 |
| 9 | Telangana | ₹9.69 lakh crore (US$140 billion) | 2019–20 |
| 10 | Madhya Pradesh | ₹9.07 lakh crore (US$130 billion) | 2019–20 |
| 11 | Delhi | ₹8.56 lakh crore (US$120 billion) | 2019–20 |
| 12 | Haryana | ₹8.31 lakh crore (US$120 billion) | 2019–20 |
| 13 | Kerala | ₹7.81 lakh crore (US$110 billion) | 2018–19 |
| 14 | Bihar | ₹6.12 lakh crore (US$86 billion) | 2019–20 |
| 15 | Punjab | ₹5.75 lakh crore (US$81 billion) | 2019–20 |
| 16 | Odisha | ₹5.31 lakh crore (US$74 billion) | 2019–20 |
| 17 | Assam | ₹3.16 lakh crore (US$44 billion) | 2018–19 |
| 18 | Chhattisgarh | ₹3.29 lakh crore (US$46 billion) | 2019–20 |
| 19 | Jharkhand | ₹3.28 lakh crore (US$46 billion) | 2019–20 |
| 20 | Uttarakhand | ₹2.46 lakh crore (US$34 billion) | 2018–19 |
| 21 | Himachal Pradesh | ₹1.65 lakh crore (US$23 billion) | 2019–20 |
| 22 | Jammu and Kashmir | ₹1.56 lakh crore (US$22 billion) | 2018–19 |
| 23 | Goa | ₹0.731 lakh crore (US$10 billion) | 2018–19 |
| 24 | Tripura | ₹0.553 lakh crore (US$7.8 billion) | 2019–20 |
| 25 | Chandigarh | ₹0.421 lakh crore (US$5.9 billion) | 2018–19 |
| 26 | Puducherry | ₹0.408 lakh crore (US$5.7 billion) | 2019–20 |
| 27 | Meghalaya | ₹0.366 lakh crore (US$5.1 billion) | 2019–20 |
| 28 | Sikkim | ₹0.287 lakh crore (US$4.0 billion) | 2019–20 |
| 29 | Manipur | ₹0.325 lakh crore (US$4.6 billion) | 2018–19 |
| 30 | Nagaland | ₹0.272 lakh crore (US$3.8 billion) | 2018–19 |
| 31 | Arunanchal Pradesh | ₹0.246 lakh crore (US$3.4 billion) | 2018–19 |
| 32 | Mizoram | ₹0.195 lakh crore (US$2.7 billion) | 2018–19 |
| 33 | Andaman and Nicobar Island | ₹0.079 lakh crore (US$1.1 billion) | 2017–18 |
| Rank | Zonal councils | Nominal GDP | Data year | Population (2018) |
Comparable country (by GDP) | |
|---|---|---|---|---|---|---|
| (INR trillions, or ₹ lakh crore) |
(USD, $) | |||||
| 1 | Southern | 64.04 | $880 billion | 2019 | 266,376,000 | |
| 2 | Western | 47.57 | $675 billion | 2019 | 179,550,000 | |
| 3 | Northern | 34.07 | $483 billion | 2019 | 162,809,000 | |
| 4 | Central | 31.67 | $449 billion | 2019 | 350,960,000 | |
| 5 | Eastern | 27.55 | $391 billion | 2019 | 293,495,000 | |
| 6 | North-Eastern | 5.6 | $79 billion | 2019 | 50,524,000 | |
| India | 209.19 | $2.9 trillion | 2019[8] | 1,303,714,000 | ||
Nominal GSDP from 2011–12 to 2020–21
The following table shows the annual growth in nominal GSDP for the financial years 2011–12 to 2020–21, from the Ministry of Statistics and Programme Implementation.[9][10] Revised data for the past years differ from the tables below.[3] Figures are in crores (units of 10 million) of Indian rupees at current prices.[1] No data was available for the union territories of Dadra and Nagar Haveli, Daman and Diu and Lakshadweep.
| State/union territory | 2011–12 in ₹ crore |
2012–13 in ₹ crore |
2013–14 in ₹ crore |
2014–15 in ₹ crore |
2015–16 in ₹ crore |
2016–17 in ₹ crore |
2017–18 in ₹ crore |
2018–19 in ₹ crore |
2019–20 in ₹ crore |
2020–21 in ₹ crore |
|---|---|---|---|---|---|---|---|---|---|---|
| 87,36,039 | 99,46,636 | 1,12,36,635 | 1,24,33,749 | 1,36,75,331 | 1,52,51,028 | 1,70,95,005 | 1,90,10,164 | – | – | |
| Andhra Pradesh | 3,79,402 | 4,11,404 | 4,64,272 | 5,24,976 | 6,04,229 | 6,97,508 | 8,09,547 | 9,33,402 | 10,80,657 | – |
| Arunachal Pradesh | 11,063 | 12,547 | 14,581 | 17,959 | 18,509 | 19,627 | 22,045 | – | – | – |
| Assam | 1,43,175 | 1,56,864 | 1,77,745 | 1,95,723 | 2,27,959 | 2,54,478 | 2,88,494 | – | 3,74,096 |
– |
| Bihar | 2,47,144 | 2,82,368 | 3,17,101 | 3,42,951 | 3,71,602 | 4,22,316 | 4,84,740 | 5,57,490 | 5,72,827 | – |
| Chhattisgarh | 1,58,074 | 1,77,511 | 2,06,833 | 2,21,118 | 2,27,383 | 2,54,722 | 2,84,194 | 3,11,660 | 3,63,900 | – |
| Goa | 42,367 | 38,120 | 35,921 | 47,814 | 55,054 | 63,460 | 70,493 | 77,172 | – | – |
| Gujarat | 6,15,606 | 7,24,495 | 8,07,623 | 9,21,773 | 10,29,010 | 11,53,327 | 13,14,680 | 14,99,013 | 17,01,495 | – |
| Haryana | 2,97,539 | 3,47,032 | 3,99,268 | 4,37,145 | 4,95,249 | 5,56,325 | 6,26,054 | 7,07,126 | 7,84,910 | – |
| Himachal Pradesh | 72,720 | 82,820 | 94,764 | 1,03,772 | 1,14,239 | 1,25,634 | 1,40,613 | 1,53,181 | 1,68,972 | – |
| Jammu and Kashmir | 78,256 | 87,138 | 95,619 | 98,370 | 1,17,168 | 1,25,379 | 1,38,488 | – | – | – |
| Jharkhand | 1,50,918 | 1,74,724 | 1,88,567 | 2,18,525 | 2,06,613 | 2,36,250 | 2,76,243 | 3,07,581 | 3,29,726 | 3,83,233 |
| Karnataka | 6,06,048 | 6,95,413 | 8,16,666 | 9,13,923 | 10,45,168 | 12,09,136 | 13,50,257 | 15,35,224 | 15,88,303 | – |
| Kerala | 3,64,048 | 4,12,313 | 4,65,041 | 5,12,564 | 5,61,994 | 6,34,871 | 7,00,532 | 8,75,514 | – | – |
| Madhya Pradesh | 3,15,562 | 3,80,925 | 4,39,483 | 4,79,939 | 5,41,189 | 6,48,849 | 7,28,242 | 8,09,327 | 9,62,430 | – |
| Maharashtra | 12,80,369 | 14,59,629 | 16,49,647 | 17,79,138 | 19,66,147 | 21,88,532 | 24,11,600 | 26,56,551 | 29,79,556 | – |
| Manipur | 12,915 | 13,743 | 16,182 | 18,129 | 19,531 | 21,294 | 23,968 | – | – | – |
| Meghalaya | 19,918 | 21,872 | 22,938 | 23,235 | 25,117 | 27,439 | 30,790 | – | – | – |
| Mizoram | 7,259 | 8,362 | 10,293 | 13,509 | 15,139 | 17,192 | 19,457 | – | – | – |
| Nagaland | 12,177 | 14,121 | 16,612 | 18,401 | 19,524 | 21,722 | 24,281 | – | – | – |
| Odisha | 2,30,987 | 2,61,700 | 2,96,475 | 3,14,250 | 3,28,550 | 3,93,808 | 4,36,374 | 4,85,376 | 5,40,812 | – |
| Punjab | 2,66,628 | 2,97,734 | 3,32,147 | 3,55,102 | 3,90,087 | 4,26,988 | 4,79,141 | 5,21,861 | 5,77,829 | – |
| Rajasthan | 4,34,837 | 4,93,551 | 5,61,031 | 6,15,642 | 6,81,485 | 7,58,809 | 8,35,558 | 9,29,124 | – | – |
| Sikkim | 11,165 | 12,338 | 13,862 | 15,407 | 18,034 | 20,687 | 23,495 | 26,786 | – | – |
| Tamil Nadu | 7,51,486 | 8,54,825 | 9,68,530 | 10,72,678 | 11,76,500 | 13,02,639 | 14,61,841 | 16,64,159 | 18,54,239 | 20,54,000 |
| Telangana | 3,59,434 | 4,01,594 | 4,51,580 | 5,05,849 | 5,77,902 | 6,59,033 | 7,53,811 | 8,65,688 | 9,69,604 | – |
| Tripura | 19,208 | 21,663 | 25,593 | 29,533 | 35,938 | 39,612 | 46,133 | – | – | – |
| Uttar Pradesh | 7,24,050 | 8,22,393 | 9,40,356 | 10,11,790 | 11,37,210 | 12,48,374 | 13,76,324 | 15,42,432 | 15,79,807 | 17,91,000 |
| Uttarakhand | 1,15,328 | 1,31,613 | 1,49,074 | 1,61,439 | 1,77,163 | 1,95,125 | 2,22,836 | 2,45,895 | 2,63,233 | – |
| West Bengal | 5,20,485 | 5,91,464 | 6,76,848 | 7,18,082 | 7,97,300 | 8,72,527 | 9,99,585 | 11,77,586 | 13,14,529 | – |
| Andaman and Nicobar Islands | 3,978 | 4,421 | 5,023 | 5,477 | 6,032 | 6,836 | 7,871 | – | – | – |
| Chandigarh | 18,768 | 21,609 | 24,822 | 26,549 | 29,280 | 32,741 | 38,806 | – | – | – |
| Delhi | 3,43,798 | 3,91,388 | 4,43,960 | 4,94,803 | 5,50,804 | 6,15,605 | 6,90,098 | 7,79,652 | – | – |
| Puducherry | 16,818 | 18,875 | 21,870 | 22,574 | 26,617 | 29,573 | 32,962 | 36,656 | – | – |
Nominal GDP from 2001–02 to 2010–11
The following table shows the annual growth in nominal GSDP for the financial years 2001–2 to 2010–11, released by the Planning Commission of India, in the Indian rupees.[1]
Revised data for the past years differ from the tables below. Figures are in crores (units of 10 million) of Indian rupees at current prices.[1] No data was available for the union territories of Dadra and Nagar Haveli, Daman and Diu and Lakshadweep.
| State/union territory | 2001–02 | 2002–03 | 2003–04 | 2004–05 | 2005–06 | 2006–07 | 2007–08 | 2008–09 | 2009–10 | 2010–11 |
|---|---|---|---|---|---|---|---|---|---|---|
| 20,97,726 | 22,61,415 | 25,38,170 | 29,71,464 | 33,90,503 | 39,53,276 | 45,82,086 | 53,03,567 | 61,08,903 | 72,48,860 | |
| Andhra Pradesh | 1,56,711 | 1,67,096 | 1,90,017 | 2,24,713 | 2,55,941 | 3,01,035 | 3,64,813 | 4,26,765 | 4,76,835 | 5,83,762 |
| Arunachal Pradesh | 2,104 | 2,071 | 2,368 | 3,488 | 3,755 | 4,108 | 4,810 | 5,687 | 7,474 | 9,013 |
| Assam | 38,313 | 43,407 | 47,305 | 53,398 | 59,385 | 64,692 | 71,076 | 81,074 | 95,975 | 1,12,688 |
| Bihar | 57,657 | 64,965 | 66,174 | 77,781 | 82,490 | 1,00,737 | 1,13,680 | 1,42,279 | 1,62,923 | 2,04,289 |
| Chhattisgarh | 29,539 | 32,493 | 38,802 | 47,862 | 53,381 | 66,875 | 80,255 | 96,972 | 99,364 | 1,19,420 |
| Goa | 7,097 | 8,100 | 9,301 | 12,713 | 14,327 | 16,523 | 19,565 | 25,414 | 29,126 | 33,605 |
| Gujarat | 1,23,573 | 1,41,534 | 1,68,080 | 2,03,373 | 2,44,736 | 2,83,693 | 3,29,285 | 3,67,912 | 4,31,262 | 5,21,519 |
| Haryana | 65,505 | 72,528 | 82,862 | 95,795 | 1,08,885 | 1,28,732 | 1,51,596 | 1,82,522 | 2,23,600 | 2,60,621 |
| Himachal Pradesh | 17,148 | 18,905 | 20,721 | 24,077 | 27,127 | 30,274 | 33,963 | 41,483 | 48,189 | 57,452 |
| Jammu and Kashmir | 18,039 | 20,326 | 22,194 | 27,305 | 29,920 | 33,230 | 37,099 | 42,315 | 48,385 | 58,073 |
| Jharkhand | 35,069 | 37,967 | 42,449 | 59,758 | 60,901 | 66,935 | 83,950 | 87,794 | 1,00,621 | 1,27,281 |
| Karnataka | 1,12,847 | 1,20,889 | 1,30,990 | 1,66,747 | 1,95,904 | 2,27,237 | 2,70,629 | 3,10,312 | 3,37,559 | 4,10,703 |
| Kerala | 77,924 | 86,895 | 96,698 | 1,19,264 | 1,36,842 | 1,53,758 | 1,75,141 | 2,02,783 | 2,31,999 | 2,63,773 |
| Madhya Pradesh | 86,745 | 86,832 | 1,02,839 | 1,12,927 | 1,24,276 | 1,44,577 | 1,61,479 | 1,97,276 | 2,27,984 | 2,63,396 |
| Maharashtra | 2,73,188 | 2,99,479 | 3,40,600 | 4,15,480 | 4,86,766 | 5,84,498 | 6,84,817 | 7,53,969 | 8,55,751 | 10,35,086 |
| Manipur | 3,369 | 3,506 | 3,979 | 5,133 | 5,718 | 6,137 | 6,783 | 7,399 | 8,254 | 9,137 |
| Meghalaya | 4,478 | 4,763 | 5,280 | 6,559 | 7,265 | 8,625 | 9,735 | 11,617 | 12,709 | 14,583 |
| Mizoram | 1,947 | 2,166 | 2,325 | 2,682 | 2,971 | 3,290 | 3,816 | 4,577 | 5,260 | 6,388 |
| Nagaland | 3,972 | 4,467 | 4,812 | 5,839 | 6,588 | 7,257 | 8,075 | 9,436 | 10,527 | 11,759 |
| Odisha | 46,756 | 49,713 | 61,008 | 77,729 | 85,096 | 1,01,839 | 1,29,274 | 1,48,491 | 1,62,946 | 1,97,530 |
| Punjab | 79,611 | 82,249 | 90,089 | 96,839 | 1,08,637 | 1,27,123 | 1,52,245 | 1,74,039 | 1,97,500 | 2,26,204 |
| Rajasthan | 91,771 | 88,550 | 111,606 | 127,746 | 1,42,236 | 1,71,043 | 1,94,822 | 2,30,949 | 2,65,825 | 3,38,348 |
| Sikkim | 1,136 | 1,276 | 1,430 | 1,739 | 1,993 | 2,161 | 2,506 | 3,229 | 6,133 | 7,412 |
| Tamil Nadu | 1,48,861 | 1,58,155 | 1,75,371 | 2,19,003 | 2,57,833 | 3,10,526 | 3,50,819 | 4,01,336 | 4,79,733 | 5,84,896 |
| Telangana | – | – | – | – | – | – | – | – | – | – |
| Tripura | 6,370 | 6,733 | 7,551 | 8,904 | 9,826 | 10,914 | 11,797 | 13,573 | 15,403 | 17,868 |
| Uttar Pradesh | 1,90,269 | 2,06,855 | 2,26,972 | 2,60,841 | 2,93,172 | 3,36,317 | 3,83,026 | 4,44,685 | 5,23,394 | 6,00,164 |
| Uttarakhand | 15,144 | 18,473 | 20,439 | 24,786 | 29,968 | 36,795 | 45,856 | 56,025 | 70,730 | 83,969 |
| West Bengal | 1,57,144 | 1,68,000 | 1,89,259 | 2,08,656 | 2,30,245 | 2,61,682 | 2,99,483 | 3,41,942 | 3,98,880 | 4,60,959 |
| Andaman and Nicobar Islands | 1,082 | 1,228 | 1,392 | 1,813 | 2,044 | 2,538 | 2,990 | 3,480 | 4,120 | 4,345 |
| Chandigarh | 5,490 | 6,453 | 7,419 | 8,504 | 10,185 | 12,276 | 13,669 | 15,334 | 17,717 | 20,017 |
| Delhi | 65,027 | 71,361 | 79,468 | 1,00,325 | 1,15,374 | 1,35,584 | 1,57,947 | 1,89,553 | 2,19,753 | 2,52,753 |
| Puducherry | 4,259 | 4,931 | 5,438 | 5,754 | 7,977 | 8,335 | 9,251 | 10,050 | 12,304 | 13,092 |
Nominal GSDP growth rate
This table shows annual growth in each state's nominal GSDP growth in percentage.[1][10] No data was available for the union territories of Dadra and Nagar Haveli, Daman and Diu and Lakshadweep.
| State/union territory | 2010–11 | 2011–12 | 2012–13 | 2013–14 | 2014–15 | 2015–16 | 2016–17 | 2017–18 | 2018-19 |
|---|---|---|---|---|---|---|---|---|---|
| 18.66 | 15.77 | 13.80 | 13.0 | 11.0 | 10.4 | 10.8 | 10.0 | 11.2 | |
| Andhra Pradesh | 17.03 | 13.25 | 13.20 | 12.90 | 13.40 | 15.90 | 14.70 | 16.06 | 15.23 |
| Arunachal Pradesh | 20.59 | 17.82 | 13.86 | 16.20 | 23.2 | 3.3 | 9.20 | – | – |
| Assam | 17.41 | 11.65 | 9.60 | 13.30 | 10.10 | 16.50 | 11.60 | – | – |
| Bihar | 25.39 | 21.06 | 14.30 | 12.30 | 8.20 | 7.70 | 15.30 | 14.50 | – |
| Chhattisgarh | 20.18 | 11.26 | 12.30 | 16.50 | 6.90 | 5.90 | 12.90 | 11.20 | 16.76 |
| Goa | 15.38 | 7.20 | −10.00 | −5.80 | 33.10 | 15.10 | 13.80 | 9.47 | – |
| Gujarat | 20.93 | 14.01 | 17.70 | 11.50 | 14.10 | 11.60 | 13.00 | 14.02 | 13.50 |
| Haryana | 16.56 | 15.86 | 16.60 | 15.50 | 9.20 | 10.90 | 12.80 | 12.94 | 11.00 |
| Himachal Pradesh | 19.22 | 13.06 | 13.90 | 14.40 | 9.50 | 10.10 | 10.30 | 8.10 | 10.30 |
| Jammu and Kashmir | 20.02 | 13.24 | 11.40 | 9.70 | 2.90 | 19.10 | 8.20 | – | – |
| Jharkhand | 26.50 | 13.05 | 15.80 | 7.90 | 15.90 | −5.50 | 14.00 | 8.40 | 7.20 |
| Karnataka | 21.7 | 10.8 | 14.80 | 17.40 | 11.80 | 11.00 | 11.80 | 12.10 | – |
| Kerala | 13.70 | 16.73 | 13.30 | 12.80 | 10.20 | 9.60 | 10.70 | – | – |
| Madhya Pradesh | 15.53 | 18.33 | 20.70 | 15.40 | 9.20 | 13.10 | 19.30 | 11.13 | 18.91 |
| Maharashtra | 20.96 | 15.89 | 14.00 | 13.00 | 7.90 | 11.60 | 13.60 | 10.6 | 12.15 |
| Manipur | 10.70 | 14.96 | 6.40 | 17.70 | 12.00 | 7.70 | 7.90 | – | – |
| Meghalaya | 14.75 | 12.54 | 9.80 | 4.90 | 1.30 | 8.10 | 8.40 | – | – |
| Mizoram | 21.44 | 12.68 | 15.20 | 23.10 | 31.20 | 12.10 | 16.30 | – | – |
| Nagaland | 11.70 | 12.28 | 16.00 | 17.60 | 10.80 | 6.10 | 10.10 | – | – |
| Odisha | 21.22 | 8.63 | 13.30 | 13.30 | 6.00 | 5.30 | 14.00 | 10.30 | 11.42 |
| Punjab | 14.53 | 13.36 | 11.70 | 11.60 | 6.90 | 9.90 | 9.80 | 10.07 | 10.72 |
| Rajasthan | 27.28 | 19.23 | 13.50 | 11.60 | 11.70 | 11.10 | 11.00 | 10.70 | – |
| Sikkim | 20.85 | 16.24 | 10.5 | 12.30 | 11.10 | 17.10 | 11.00 | 11.10 | – |
| Tamil Nadu | 21.92 | 13.75 | 13.80 | 13.30 | 10.80 | 9.70 | 8.00 | 12.30 | 11.42 |
| Telangana | 29.78 | 11.99 | 11.70 | 12.40 | 12.00 | 14.20 | 14.00 | 14.10 | 12.00 |
| Tripura | 16.00 | 17.43 | 12.80 | 18.10 | 7.10 | 25.30 | 15.14 | – | – |
| Uttar Pradesh | 14.67 | 13.14 | 13.40 | 14.30 | 7.60 | 12.40 | 9.90 | 10.00 | – |
| Uttarakhand | 18.72 | 16.35 | 14.10 | 13.30 | 8.30 | 8.90 | 11.30 | 11.20 | – |
| West Bengal | 15.56 | 12.91 | 13.64 | 14.44 | 6.09 | 11.03 | 9.44 | 14.56 | 17.81 |
| Chandigarh | 12.98 | 15.96 | 15.10 | 14.90 | 7.00 | 10.40 | 8.60 | – | – |
| Delhi | 15.20 | 17.49 | 13.80 | 13.40 | 11.50 | 10.70 | 12.50 | 11.20 | – |
| Puducherry | 6.40 | 11.75 | 12.20 | 15.90 | 3.20 | 18.00 | 9.90 | 10.00 | – |
| Andaman and Nicobar Islands | 5.46 | 9.23 | 11.10 | 13.60 | 9.10 | 10.10 | 10.20 | – | – |
See also
References
- "Gross State Domestic Product (GSDP) at Current Prices (as on 31-05-2014)" (PDF). Planning Commission Government of India. Archived from the original (PDF) on 15 July 2014.
- "National economic debate – Stock markets or rigged casinos – talk by Professor Dr. R. Vaidyanathan (IIM Bangalore) – 21 Jan 2011, Mumbai". National Economic Debates. Retrieved 1 November 2016.
- "MOSPI Gross State Domestic Product". Ministry of Statistics and Programme Implementation, Government of India. 31 July 2020. Retrieved 8 October 2020.
- "Gross State Domestic Product of Kerala". Department of Economics and Statistics, Government of Kerala. Retrieved 9 June 2019.
- "Economic Survey of Haryana 2018–19: Gross State Domestic Product" (PDF). Department of Economic and Statistical Analysis, Haryana. p. 7. Retrieved 9 June 2019.>
- "World Economic Outlook Database, October 2019". IMF.org. International Monetary Fund. 15 October 2019. Retrieved 3 September 2019.
- "Economic Survey of Maharashtra 2019–20, Directorate of Economics and Statistics, Planning Department" (PDF). Government of Maharashtra. Retrieved 7 April 2020.
- "Report for Selected Countries and Subjects". IMF. Retrieved 17 February 2017.
- "State Domestic Product and other aggregates, 2004–05 series". Ministry of Statistics and Programme Implementation. 27 February 2015. Archived from the original on 23 March 2015. Retrieved 18 June 2015.
- "MOSPI GSDP". MOSPI.