List of states and union territories of India by population
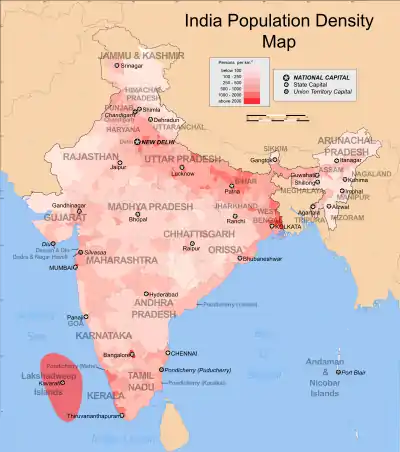
India is a union of 28 states and 8 union territories.[1] As of 2011, with an estimated population of 1.2 billion, India is the world's second most populous country after the People's Republic of China. India occupies 2.4% of the world's area and is home to 17.5% of the world's population.[2] The Indo-Gangetic plains have one of the world's biggest stretches of fertile flat-deep alluvium and are among the most densely populated areas of the world. The eastern and western coastal regions of Deccan Plateau are also densely populated regions of India. The Thar Desert in western Rajasthan is one of the least densely populated deserts in the world. The northern and north-eastern states along the Himalayas contain cold arid deserts with fertile valleys. These states have relatively less population density due to indomitable physical barriers.[3]
Census of India
The first population census in British India was conducted in 1872. Since India's independence in 1947, a census has been conducted every 10 years, the first occurring in 1951.[4] The census in India is conducted by the Office of the Registrar General and Census Commissioner under the Ministry of Home Affairs, and is one of the largest administrative tasks conducted by a federal government.[5]
The latest population figures are based on data from the 2011 census of India.[6] During the decade of 2001–2011, India's annual population growth rate has slowed down from 2.15 percent to 1.76 percent.[6] Based on decennial census data, Dadra and Nagar Haveli and Daman and Diu has the fastest growth rate of 55.1 percent, followed by Meghalaya (27.8 percent) and Arunachal Pradesh (25.9 percent). Nagaland recorded the lowest growth rate of -0.5 percent.[7]
India has 641,000 inhabited villages and 72.2 percent of the total population reside in these rural areas.[7] Of them 145,000 villages have population size of 500–999 persons; 130,000 villages have population size of 1000–1999 and 128,000 villages have population size of 200–499. There are 3,961 villages that have a population of 10,000 persons or more.[2] India's 27.8 percent urban population lives in more than 5,100 towns and over 380 urban agglomerations.[8] In the decade of 1991–2001, migration to major cities caused rapid increase in urban population.[9][10] On the basis of net migrants by last residence during the past decade, Maharashtra had most immigration with 2.3 million, followed by National Capital Territory of Delhi (1.7 million), Gujarat (0.68 million) and Haryana (0.67 million). Uttar Pradesh (−2.6 million) and Bihar (−1.7 million) topped the list for interstate emigration.[11] The five states of Uttar Pradesh, Maharashtra, Bihar, West Bengal and Madhya Pradesh account for almost half (47.90 percent) of the total Indian population.[6]
While the national average for sex ratio shows an increase from 933 in 2001 to 940 in 2011,[6] the 2011 census shows a sharp decline in child sex ratio, the number of females per thousand males in a population between age group 0–6 years.[6] States such as Punjab, Haryana, Himachal Pradesh, Gujarat, Tamil Nadu, Mizoram and Andaman and Nicobar Islands recorded an increase in child sex ratio.[6] National child sex ratio has declined from 927 in 2001 to 914 in 2011.[6] Telangana census was separated from Andhra Pradesh state census figures, after Telangana was officially formed on 2 June 2014.[12]
List
Data from Census 2011 as published by Office of the Registrar General & Census Commissioner,[13] Government of Telangana,[14] and Planning Commission of India.[15] Population density is rounded to the nearest integer.
| Rank | State or union territory | Population | Population (%) | Decadal growth (2001–2012) |
Rural population | Percent rural | Urban population | Percent urban | Area[16] | Density[lower-alpha 1] | Sex ratio |
|---|---|---|---|---|---|---|---|---|---|---|---|
| 1 | Uttar Pradesh | 199,812,341 | 16.51% | 20.2% | 155,317,278 | 77.73% | 44,495,063 | 22.27% | 240,928 km2 (93,023 sq mi) | 828/km2 (2,140/sq mi) | 912 |
| 2 | Maharashtra | 112,374,333 | 9.28% | 20.0% | 61,556,074 | 54.78% | 50,818,259 | 45.22% | 307,713 km2 (118,809 sq mi) | 365/km2 (950/sq mi) | 929 |
| 3 | Bihar | 104,099,452 | 8.6% | 25.4% | 92,341,436 | 88.71% | 11,758,016 | 11.29% | 94,163 km2 (36,357 sq mi) | 1,102/km2 (2,850/sq mi) | 918 |
| 4 | West Bengal | 91,276,115 | 7.54% | 13.8% | 62,183,113 | 68.13% | 29,093,002 | 31.87% | 88,752 km2 (34,267 sq mi) | 1,029/km2 (2,670/sq mi) | 953 |
| 5 | Madhya Pradesh | 72,626,809 | 6% | 16.3% | 52,557,404 | 72.37% | 20,069,405 | 27.63% | 308,245 km2 (119,014 sq mi) | 236/km2 (610/sq mi) | 931 |
| 6 | Tamil Nadu | 72,147,030 | 5.96% | 15.6% | 37,229,590 | 51.6% | 34,917,440 | 48.4% | 130,051 km2 (50,213 sq mi) | 555/km2 (1,440/sq mi) | 996 |
| 7 | Rajasthan | 68,548,437 | 5.66% | 21.3% | 51,500,352 | 75.13% | 17,048,085 | 24.87% | 342,239 km2 (132,139 sq mi) | 201/km2 (520/sq mi) | 928 |
| 8 | Karnataka | 61,095,297 | 5.05% | 15.6% | 37,469,335 | 61.33% | 23,625,962 | 38.67% | 191,791 km2 (74,051 sq mi) | 319/km2 (830/sq mi) | 973 |
| 9 | Gujarat | 60,439,692 | 4.99% | 19.3% | 34,694,609 | 57.4% | 25,745,083 | 42.6% | 196,024 km2 (75,685 sq mi) | 308/km2 (800/sq mi) | 919 |
| 10 | Andhra Pradesh | 49,577,103[lower-alpha 2] | 4.1% | 11.0% | 34,966,693 | 70.53% | 14,610,410 | 29.47% | 162,968 km2 (62,922 sq mi) | 303/km2 (780/sq mi) | 993 |
| 11 | Odisha | 41,974,219 | 3.47% | 14.0% | 34,970,562 | 83.31% | 7,003,656 | 16.69% | 155,707 km2 (60,119 sq mi) | 269/km2 (700/sq mi) | 979 |
| 12 | Telangana | 35,003,674 | 2.89% | 13.58% | 21,395,009 | 61.12% | 13,608,665 | 38.88% | 112,077 km2 (43,273 sq mi) | 312/km2 (810/sq mi) | 988 |
| 13 | Kerala | 33,406,061 | 2.76% | 4.9% | 17,471,135 | 52.3% | 15,934,926 | 47.7% | 38,863 km2 (15,005 sq mi) | 859/km2 (2,220/sq mi) | 1,084 |
| 14 | Jharkhand | 32,988,134 | 2.73% | 22.4% | 25,055,073 | 75.95% | 7,933,061 | 24.05% | 79,714 km2 (30,778 sq mi) | 414/km2 (1,070/sq mi) | 948 |
| 15 | Assam | 31,205,576 | 2.58% | 17.7% | 26,807,034 | 85.90% | 4,398,542 | 14.10% | 78,438 km2 (30,285 sq mi) | 398/km2 (1,030/sq mi) | 958 |
| 16 | Punjab | 27,743,338 | 2.29% | 13.89% | 17,344,192 | 62.52% | 10,399,146 | 37.48% | 50,362 km2 (19,445 sq mi) | 551/km2 (1,430/sq mi) | 895 |
| 17 | Chhattisgarh | 25,545,198 | 2.11% | 22.6% | 19,607,961 | 76.76% | 5,937,237 | 23.24% | 135,191 km2 (52,198 sq mi) | 189/km2 (490/sq mi) | 991 |
| 18 | Haryana | 25,351,462 | 2.09% | 19.9% | 16,509,359 | 65.12% | 8,842,103 | 34.88% | 44,212 km2 (17,070 sq mi) | 573/km2 (1,480/sq mi) | 879 |
| NCT UT1 | Delhi | 16,787,941 | 1.39% | 21.2% | 419,042 | 2.5% | 16,368,899 | 97.5% | 1,484 km2 (573 sq mi) | 11,297/km2 (29,260/sq mi) | 868 |
| UT2 | Jammu and Kashmir | 12,267,032 | 1.01% | 23.6% | 9,064,220 | 73.89% | 3,202,812 | 26.11% | 42,241 km2 (16,309 sq mi)[lower-alpha 3] | 297/km2 (770/sq mi) | 890 |
| 19 | Uttarakhand | 10,086,292 | 0.83% | 18.8% | 7,036,954 | 69.77% | 3,049,338 | 30.23% | 53,483 km2 (20,650 sq mi) | 189/km2 (490/sq mi) | 963 |
| 20 | Himachal Pradesh | 6,864,602 | 0.57% | 12.9% | 6,176,050 | 89.97% | 688,552 | 10.03% | 55,673 km2 (21,495 sq mi) | 123/km2 (320/sq mi) | 972 |
| 21 | Tripura | 3,673,917 | 0.3% | 14.8% | 2,712,464 | 73.83% | 961,453 | 26.17% | 10,486 km2 (4,049 sq mi) | 350/km2 (910/sq mi) | 960 |
| 22 | Meghalaya | 2,966,889 | 0.25% | 27.9% | 2,371,439 | 79.93% | 595,450 | 20.07% | 22,429 km2 (8,660 sq mi) | 132/km2 (340/sq mi) | 989 |
| 23 | Manipur[lower-alpha 4] | 2,570,390 | 0.21% | 18.6% | 1,793,875 | 69.79% | 776,515 | 30.21% | 22,327 km2 (8,621 sq mi) | 122/km2 (320/sq mi) | 992 |
| 24 | Nagaland | 1,978,502 | 0.16% | −0.6% | 1,407,536 | 71.14% | 570,966 | 28.86% | 16,579 km2 (6,401 sq mi) | 119/km2 (310/sq mi) | 931 |
| 25 | Goa | 1,458,545 | 0.12% | 8.2% | 551,731 | 37.83% | 906,814 | 62.17% | 3,702 km2 (1,429 sq mi) | 394/km2 (1,020/sq mi) | 973 |
| 26 | Arunachal Pradesh | 1,383,727 | 0.11% | 26.0% | 1,066,358 | 77.06% | 317,369 | 22.94% | 83,743 km2 (32,333 sq mi) | 17/km2 (44/sq mi) | 938 |
| UT3 | Puducherry | 1,247,953 | 0.1% | 28.1% | 395,200 | 31.67% | 852,753 | 68.33% | 479 km2 (185 sq mi) | 2,598/km2 (6,730/sq mi) | 1,037 |
| 27 | Mizoram | 1,097,206 | 0.09% | 23.5% | 525,435 | 47.89% | 571,771 | 52.11% | 21,081 km2 (8,139 sq mi) | 52/km2 (130/sq mi) | 976 |
| UT4 | Chandigarh | 1,055,450 | 0.09% | 17.2% | 28,991 | 2.75% | 1,026,459 | 97.25% | 114 km2 (44 sq mi) | 9,252/km2 (23,960/sq mi) | 818 |
| 28 | Sikkim | 610,577 | 0.05% | 12.9% | 456,999 | 74.85% | 153,578 | 25.15% | 7,096 km2 (2,740 sq mi) | 86/km2 (220/sq mi) | 890 |
| UT5 | Dadra and Nagar Haveli and Daman and Diu | 585,764 | 0.05% | 55.1% | 243,510 | 41.57% | 342,254 | 58.43% | 603 km2 (233 sq mi) | 970/km2 (2,500/sq mi) | 711 |
| UT6 | Andaman and Nicobar Islands | 380,581 | 0.03% | 6.9% | 237,093 | 62.3% | 143,488 | 37.7% | 8,249 km2 (3,185 sq mi) | 46/km2 (120/sq mi) | 876 |
| UT7 | Ladakh | 274,000 | 0.02% | 17.8% | 43,840 | 16% | 230,160 | 84% | 96,701 km2 (37,336 sq mi)[lower-alpha 5] | 2.8/km2 (7.3/sq mi) | 853 |
| UT8 | Lakshadweep | 64,473 | 0.01% | 6.3% | 14,141 | 21.93% | 50,332 | 78.07% | 32 km2 (12 sq mi) | 2,013/km2 (5,210/sq mi) | 946 |
| Total | India | 1,210,569,573 | 100% | 17.7% | 833,463,448 | 68.84% | 377,106,125 | 31.16% | 3,287,240 km2 (1,269,210 sq mi)[lower-alpha 6] | 382/km2 (990/sq mi) | 940 |
Notes
- For determining population density of India and the State of Jammu and Kashmir, the data excludes areas claimed by India but controlled by Pakistan (78,114 km2) and China (5,180 km2 in Shaksgam Valley and 37,555 km2 under Aksai Chin and other areas).[17][18]
- Calculated by subtracting the population of Telangana from Andhra Pradesh's Census 2011 figures.
- This includes 83,294 square kilometres (32,160 sq mi) of territory controlled by Pakistan, but claimed by India along with Shaksgam Valley territory administered by the People's Republic of China.
- Excludes Mao-Maram, Paomata, and Purul sub-divisions of Senapati district of Manipur.
- This includes 37,555 square kilometres (14,500 sq mi) of Aksai Chin territory and other areas along the eastern border of Ladakh administered by the People's Republic of China, but claimed by India
- This includes 120,849 square kilometres (46,660 sq mi) of territory controlled by Pakistan, but claimed by India along with Aksai Chin and Shaksgam Valley, territories administered by the People's Republic of China.
See also
References
- "India at a Glance: Profile". Government of India. Retrieved 2013-09-30.
- "Area and Population". Government of India (2001). Census of India. Retrieved 2008-10-26.
- "India - General Profile, Land Use Classification and Land Use Pattern" (PDF). National Informatics Centre (NIC). Ministry of Environment and Forests (MoEF). Archived from the original (PDF) on May 14, 2006. Retrieved 2008-12-12.
- "Census Organisation of India". Government of India (2001). Census of India. Archived from the original on December 1, 2008. Retrieved 2008-12-04.
- "Brief history of census". Government of India (2001). Census of India. Retrieved 2008-10-26.
- "India Census 2011, Provisional Population Totals" (PDF). Archived from the original (PDF) on February 18, 2015.
- http://www.thehindu.com/multimedia/archive/00517/India_Census_2011___517160a.pdf
- "Urban Agglomerations (UAs) & towns". Government of India (2001). Census of India. Retrieved 2008-12-04.
- Shinde, Swati (13 Sep 2008). "Migration rate to city will dip". Times of India. Retrieved 2008-12-08.
- "Develop towns to stop migration to urban areas: economist". Chennai, India: Hindu. Dec 3, 2005. Retrieved 2008-12-08.
- "Migration". Government of India (2001). Census of India. Retrieved 2008-10-26.
- "T-party today: India's 29th state Telangana is born - Times of India ►". Retrieved 15 September 2018.
- "Population and decadal change by residence : 2011 (PERSONS)" (PDF). Office of the Registrar General & Census Commissioner, India. p. 2.
- "Statistical Year Book 2015" (PDF). telangana.gov.in. Directorate of Economics and Statistics, Government of Telangana. Retrieved 4 March 2019.
- "Census 2011 (Final Data) - Demographic details, Literate Population (Total, Rural & Urban)" (PDF). planningcommission.gov.in. Planning Commission, Government of India. Archived from the original (PDF) on 27 January 2018. Retrieved 15 January 2019.
- "Area of India/state/district". Government of India (2001). Census of India. Retrieved 2008-10-27.
- "J&K 2011 Population density census" (PDF).
- "Religion PCA 2011 J&K census".