List of metropolitan statistical areas

The United States Office of Management and Budget (OMB) has defined 392 metropolitan statistical areas (MSAs) for the United States, including eight for Puerto Rico.[1] The OMB defines a Metropolitan Statistical Area as one or more adjacent counties, or county equivalents, that have at least one urban core area of at least 50,000 population, plus adjacent territory that has a high degree of social and economic integration with the core as measured by the commuting tie.

United States

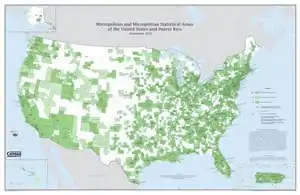
An enlargeable map of the 938 core-based statistical areas (CBSAs) of the United States and Puerto Rico. The 392 MSAs are shown in medium green  . The 546 micropolitan statistical areas (μSAs) are shown in light green  .

The following sortable table lists the 384 MSAs of the United States with the following information:

  1. The MSA rank by population as of July 1, 2019, as estimated by the United States Census Bureau[2]
  2. The MSA name as designated by the United States Office of Management and Budget[1]
  3. The MSA population as of July 1, 2019, as estimated by the United States Census Bureau[2]
  4. The MSA population as of April 1, 2010, as enumerated by the 2010 United States Census[2]
  5. The percent MSA population change from April 1, 2010, to July 1, 2019[2]
  6. The combined statistical area (CSA)[3] if the MSA is a component[1]
The 384 "metropolitan statistical areas" of the United States[2]

Rank Metropolitan statistical area 2019 estimate 2010 Census % change Encompassing combined statistical area
1 New York City-Newark-Jersey City, NY-NJ-PA MSA 19,216,182 18,897,109 +1.69% New York-Newark, NY-NJ-CT-PA CSA
2 Los Angeles-Long Beach-Anaheim, CA MSA 13,214,799 12,828,837 +3.01% Los Angeles-Long Beach, CA CSA
3 Chicago-Naperville-Elgin, IL-IN-WI MSA 9,458,539 9,461,105 −0.03% Chicago-Naperville, IL-IN-WI CSA
4 Dallas-Fort Worth-Arlington, TX MSA 7,573,136 6,366,542 +18.95% Dallas-Fort Worth, TX-OK CSA
5 Houston-The Woodlands-Sugar Land, TX MSA 7,066,141 5,920,416 +19.35% Houston-The Woodlands, TX CSA
6 Washington-Arlington-Alexandria, DC-VA-MD-WV MSA 6,280,487 5,649,540 +11.17% Washington-Baltimore-Arlington, DC-MD-VA-WV-PA CSA
7 Miami-Fort Lauderdale-West Palm Beach, FL MSA 6,166,488 5,564,635 +10.82% Miami-Port St. Lucie-Fort Lauderdale, FL CSA
8 Philadelphia-Camden-Wilmington, PA-NJ-DE-MD MSA 6,102,434 5,965,343 +2.30% Philadelphia-Reading-Camden, PA-NJ-DE-MD CSA
9 Atlanta-Sandy Springs-Alpharetta, GA MSA 6,020,364 5,286,728 +13.88% Atlanta–Athens-Clarke County–Sandy Springs, GA-AL CSA
10 Phoenix-Mesa-Chandler, AZ MSA 4,948,203 4,192,887 +18.01% Phoenix-Mesa, AZ CSA
11 Boston-Cambridge-Newton, MA-NH MSA 4,873,019 4,552,402 +7.04% Boston-Worcester-Providence, MA-RI-NH-CT CSA
12 San Francisco-Oakland-Berkeley, CA MSA 4,731,803 4,335,391 +9.14% San Jose-San Francisco-Oakland, CA CSA
13 Riverside-San Bernardino-Ontario, CA MSA 4,650,631 4,224,851 +10.08% Los Angeles-Long Beach, CA CSA
14 Detroit–Warren–Dearborn, MI MSA 4,319,629 4,296,250 +0.54% Detroit-Warren-Ann Arbor, MI CSA
15 Seattle-Tacoma-Bellevue, WA MSA 3,979,845 3,439,809 +15.70% Seattle-Tacoma, WA CSA
16 Minneapolis-St. Paul-Bloomington, MN-WI MSA 3,654,908 3,346,859 +9.20% Minneapolis-St. Paul, MN-WI CSA
17 San Diego-Chula Vista-Carlsbad, CA MSA 3,338,330 3,095,313 +7.85%
18 Tampa-St. Petersburg-Clearwater, FL MSA 3,194,831 2,783,243 +14.79%
19 Denver-Aurora-Lakewood, CO MSA 2,967,239 2,543,482 +16.66% Denver-Aurora, CO CSA
20 St. Louis, MO-IL MSA 2,803,228 2,787,701 +0.56% St. Louis-St. Charles-Farmington, MO-IL CSA
21 Baltimore-Columbia-Towson, MD MSA 2,800,053 2,710,489 +3.30% Washington-Baltimore-Arlington, DC-MD-VA-WV-PA CSA
22 Charlotte-Concord-Gastonia, NC-SC MSA 2,636,883 2,243,960 +17.51% Charlotte-Concord, NC-SC CSA
23 Orlando-Kissimmee-Sanford, FL MSA 2,608,147 2,134,411 +22.20% Orlando-Lakeland-Deltona, FL CSA
24 San Antonio-New Braunfels, TX MSA 2,550,960 2,142,508 +19.06%
25 Portland-Vancouver-Hillsboro, OR-WA MSA 2,492,412 2,226,009 +11.97% Portland-Vancouver-Salem, OR-WA CSA
26 Sacramento-Roseville-Folsom, CA MSA 2,363,730 2,149,127 +9.99% Sacramento-Roseville, CA CSA
27 Pittsburgh, PA MSA 2,317,600 2,356,285 −1.64% Pittsburgh-New Castle-Weirton, PA-OH-WV CSA
28 Las Vegas-Henderson-Paradise, NV MSA 2,266,715 1,951,269 +16.17% Las Vegas-Henderson, NV-AZ CSA
29 Austin-Round Rock-Georgetown, TX MSA 2,227,083 1,716,289 +29.76%
30 Cincinnati, OH-KY-IN MSA 2,221,208 2,137,667 +3.91% Cincinnati-Wilmington-Maysville, OH-KY-IN CSA
31 Kansas City, MO-KS MSA 2,157,990 2,009,342 +7.40% Kansas City-Overland Park-Kansas City, MO-KS CSA
32 Columbus, OH MSA 2,122,271 1,901,974 +11.58% Columbus-Marion-Zanesville, OH CSA
33 Indianapolis-Carmel-Anderson, IN MSA 2,074,537 1,887,877 +9.89% Indianapolis-Carmel-Muncie, IN CSA
34 Cleveland-Elyria, OH MSA 2,048,449 2,077,240 −1.39% Cleveland-Akron-Canton, OH CSA
35 San Jose-Sunnyvale-Santa Clara, CA MSA 1,990,660 1,836,911 +8.37% San Jose-San Francisco-Oakland, CA CSA
36 Nashville-Davidson–Murfreesboro–Franklin, TN MSA 1,934,317 1,646,200 +17.50% Nashville-Davidson–Murfreesboro, TN CSA
37 Virginia Beach-Norfolk-Newport News, VA-NC MSA 1,768,901 1,713,954 +3.21% Virginia Beach-Norfolk, VA-NC CSA
38 Providence-Warwick, RI-MA MSA 1,624,578 1,600,852 +1.48% Boston-Worcester-Providence, MA-RI-NH-CT CSA
39 Milwaukee-Waukesha, WI MSA 1,575,179 1,555,908 +1.24% Milwaukee-Racine-Waukesha, WI CSA
40 Jacksonville, FL MSA 1,559,514 1,345,596 +15.90% Jacksonville-St. Marys-Palatka, FL-GA CSA
41 Oklahoma City, OK MSA 1,408,950 1,252,987 +12.45% Oklahoma City-Shawnee, OK CSA
42 Raleigh-Cary, NC MSA 1,390,785 1,130,490 +23.02% Raleigh-Durham-Cary, NC CSA
43 Memphis, TN-MS-AR MSA 1,346,045 1,316,100 +2.28% Memphis-Forrest City, TN-MS-AR CSA
44 Richmond, VA MSA 1,291,900 1,186,501 +8.88%
45 New Orleans-Metairie, LA MSA 1,270,530 1,189,866 +6.78% New Orleans-Metairie-Hammond, LA-MS CSA
46 Louisville/Jefferson County, KY-IN MSA 1,265,108 1,202,718 +5.19% Louisville/Jefferson County–Elizabethtown–Bardstown, KY-IN CSA
47 Salt Lake City, UT MSA 1,232,696 1,087,873 +13.31% Salt Lake City-Provo-Orem, UT CSA
48 Hartford-East Hartford-Middletown, CT MSA 1,204,877 1,212,381 −0.62% Hartford-East Hartford, CT CSA
49 Buffalo-Niagara Falls, NY MSA 1,127,983 1,135,509 −0.66% Buffalo-Cheektowaga-Cattaraugus, NY CSA
50 Birmingham-Hoover, AL MSA 1,090,435 1,061,024 +2.77% Birmingham-Hoover-Talladega, AL CSA
51 Grand Rapids-Kentwood, MI MSA 1,077,370 993,670 +8.42% Grand Rapids-Kentwood-Muskegon, MI CSA
52 Rochester, NY MSA 1,069,644 1,079,671 −0.93% Rochester-Batavia-Seneca Falls, NY CSA
53 Tucson, AZ MSA 1,047,279 980,263 +6.84% Tucson-Nogales, AZ CSA
54 Fresno, CA MSA 999,101 930,450 +7.38% Fresno-Madera-Hanford, CA CSA
55 Tulsa, OK MSA 998,626 937,478 +6.52% Tulsa-Muskogee-Bartlesville, OK CSA
56 Urban Honolulu, HI MSA 974,563 953,207 +2.24%
57 Omaha-Council Bluffs, NE-IA MSA 949,442 865,350 +9.72% Omaha-Council Bluffs-Fremont, NE-IA CSA
58 Worcester, MA-CT MSA 947,404 916,980 +3.32% Boston-Worcester-Providence, MA-RI-NH-CT CSA
59 Bridgeport-Stamford-Norwalk, CT MSA 943,332 916,829 +2.89% New York-Newark, NY-NJ-CT-PA CSA
60 Greenville-Anderson, SC MSA 920,477 824,112 +11.69% Greenville-Spartanburg-Anderson, SC CSA
61 Albuquerque, NM MSA 918,018 887,077 +3.49% Albuquerque-Santa Fe-Las Vegas, NM CSA
62 Bakersfield, CA MSA 900,202 839,631 +7.21%
63 Albany-Schenectady-Troy, NY MSA 880,381 870,716 +1.11% Albany-Schenectady, NY CSA
64 Knoxville, TN MSA 869,046 814,914 +6.64% Knoxville-Morristown-Sevierville, TN CSA
65 McAllen-Edinburg-Mission, TX MSA 868,707 774,769 +12.12% McAllen-Edinburg, TX CSA
66 Baton Rouge, LA MSA 854,884 825,905 +3.51%
67 New Haven-Milford, CT MSA 854,757 862,477 −0.90% New York-Newark, NY-NJ-CT-PA CSA
68 Oxnard-Thousand Oaks-Ventura, CA MSA 846,006 823,318 +2.76% Los Angeles-Long Beach, CA CSA
69 El Paso, TX MSA 844,124 804,123 +4.97% El Paso-Las Cruces, TX-NM CSA
70 Allentown-Bethlehem-Easton, PA-NJ MSA 844,052 821,173 +2.79%
71 Columbia, SC MSA 838,433 767,598 +9.23% Columbia-Orangeburg-Newberry, SC CSA
72 North Port-Sarasota-Bradenton, FL MSA 836,995 702,281 +19.18% North Port-Sarasota, FL CSA
73 Dayton-Kettering, OH MSA 807,611 799,232 +1.05% Dayton-Springfield-Kettering, OH CSA
74 Charleston-North Charleston, SC MSA 802,122 664,607 +20.69%
75 Greensboro-High Point, NC MSA 771,851 723,801 +6.64% Greensboro–Winston-Salem–High Point, NC CSA
76 Cape Coral-Fort Myers, FL MSA 770,577 618,754 +24.54% Cape Coral-Fort Myers-Naples, FL CSA
77 Stockton, CA MSA 762,148 685,306 +11.21% San Jose-San Francisco-Oakland, CA CSA
78 Boise City, ID MSA 749,202 616,561 +21.51% Boise City-Mountain Home-Ontario, ID-OR CSA
79 Colorado Springs, CO MSA 745,791 645,613 +15.52%
80 Little Rock-North Little Rock-Conway, AR MSA 742,384 699,757 +6.09% Little Rock-North Little Rock, AR CSA
81 Lakeland-Winter Haven, FL MSA 724,777 602,095 +20.38% Orlando-Lakeland-Deltona, FL CSA
82 Akron, OH MSA 703,479 703,200 +0.04% Cleveland-Akron-Canton, OH CSA
83 Des Moines-West Des Moines, IA MSA 699,292 606,475 +15.30% Des Moines-Ames-West Des Moines, IA CSA
84 Springfield, MA MSA 697,382 692,942 +0.64%
85 Ogden-Clearfield, UT MSA 683,864 597,159 +14.52% Salt Lake City-Provo-Orem, UT CSA
86 Poughkeepsie-Newburgh-Middletown, NY MSA 679,158 670,301 +1.32% New York-Newark, NY-NJ-CT-PA CSA
87 Winston-Salem, NC MSA 676,008 640,595 +5.53% Greensboro–Winston-Salem–High Point, NC CSA
88 Deltona-Daytona Beach-Ormond Beach, FL MSA 668,365 590,289 +13.23% Orlando-Lakeland-Deltona, FL CSA
89 Madison, WI MSA 664,865 605,435 +9.82% Madison-Janesville-Beloit, WI CSA
90 Syracuse, NY MSA 648,593 662,577 −2.11% Syracuse-Auburn, NY CSA
91 Provo-Orem, UT MSA 648,252 526,810 +23.05% Salt Lake City-Provo-Orem, UT CSA
92 Durham-Chapel Hill, NC MSA 644,367 564,273 +14.19% Raleigh-Durham-Cary, NC CSA
93 Toledo, OH MSA 641,816 651,429 −1.48% Toledo-Findlay-Tiffin, OH CSA
94 Wichita, KS MSA 640,218 623,061 +2.75% Wichita-Winfield, KS CSA
95 Augusta-Richmond County, GA-SC MSA 608,980 564,873 +7.81%
96 Palm Bay-Melbourne-Titusville, FL MSA 601,942 543,376 +10.78% Orlando-Lakeland-Deltona, FL CSA
97 Jackson, MS MSA 594,806 586,320 +1.45% Jackson-Vicksburg-Brookhaven, MS CSA
98 Harrisburg-Carlisle, PA MSA 577,941 549,475 +5.18% Harrisburg-York-Lebanon, PA CSA
99 Spokane-Spokane Valley, WA MSA 568,521 514,752 +10.45% Spokane-Spokane Valley-Coeur d'Alene, WA-ID CSA
100 Chattanooga, TN-GA MSA 565,194 528,143 +7.02% Chattanooga-Cleveland-Dalton, TN-GA-AL CSA
101 Scranton–Wilkes-Barre, PA MSA 553,885 563,631 −1.73%
102 Modesto, CA MSA 550,660 514,453 +7.04% San Jose-San Francisco-Oakland, CA CSA
103 Lansing-East Lansing, MI MSA 550,391 534,684 +2.94%
104 Lancaster, PA MSA 545,724 519,445 +5.06%
105 Portland-South Portland, ME MSA 538,500 514,098 +4.75% Portland-Lewiston-South Portland, ME CSA
106 Youngstown-Warren-Boardman, OH-PA MSA 536,081 565,773 −5.25% Youngstown-Warren, OH-PA CSA
107 Fayetteville-Springdale-Rogers, AR MSA 534,904 440,121 +21.54%
108 Fayetteville, NC MSA 526,719 481,061 +9.49% Fayetteville-Lumberton-Laurinburg, NC CSA
109 Lexington-Fayette, KY MSA 517,056 472,099 +9.52% Lexington-Fayette–Richmond–Frankfort, KY CSA
110 Pensacola-Ferry Pass-Brent, FL MSA 502,629 448,991 +11.95% Pensacola-Ferry Pass, FL-AL CSA
111 Myrtle Beach-Conway-North Myrtle Beach, SC-NC MSA 496,901 376,722 +31.90% Myrtle Beach-Conway, SC-NC CSA
112 Santa Rosa-Petaluma, CA MSA 494,336 483,878 +2.16% San Jose-San Francisco-Oakland, CA CSA
113 Port St. Lucie, FL MSA 489,297 424,107 +15.37% Miami-Port St. Lucie-Fort Lauderdale, FL CSA
114 Lafayette, LA MSA 489,207 466,750 +4.81% Lafayette-Opelousas-Morgan City, LA CSA
115 Reno, NV MSA 475,642 425,417 +11.81% Reno-Carson City-Fernley, NV CSA
116 Huntsville, AL MSA 471,824 417,593 +12.99% Huntsville-Decatur, AL CSA
117 Springfield, MO MSA 470,300 436,712 +7.69%
118 Visalia, CA MSA 466,195 442,179 +5.43%
119 Asheville, NC MSA 462,680 424,858 +8.90% Asheville-Marion-Brevard, NC CSA
120 Killeen-Temple, TX MSA 460,303 405,300 +13.57%
121 York-Hanover, PA MSA 449,058 434,972 +3.24% Harrisburg-York-Lebanon, PA CSA
122 Vallejo, CA MSA 447,643 413,344 +8.30% San Jose-San Francisco-Oakland, CA CSA
123 Santa Maria-Santa Barbara, CA MSA 446,499 423,895 +5.33%
124 Salinas, CA MSA 434,061 415,057 +4.58%
125 Salem, OR MSA 433,903 390,738 +11.05% Portland-Vancouver-Salem, OR-WA CSA
126 Mobile, AL MSA 429,536 430,573 −0.24% Mobile-Daphne-Fairhope, AL CSA
127 Corpus Christi, TX MSA 429,024 405,027 +5.92% Corpus Christi-Kingsville-Alice, TX CSA
128 Brownsville-Harlingen, TX MSA 423,163 406,220 +4.17% Brownsville-Harlingen-Raymondville, TX CSA
129 Reading, PA MSA 421,164 411,442 +2.36% Philadelphia-Reading-Camden, PA-NJ-DE-MD CSA
130 Gulfport-Biloxi, MS MSA 417,665 388,488 +7.51%
131 Manchester-Nashua, NH MSA 417,025 400,721 +4.07% Boston-Worcester-Providence, MA-RI-NH-CT CSA
132 Salisbury, MD-DE MSA 415,726 373,802 +11.22% Salisbury-Cambridge, MD-DE CSA
133 Fort Wayne, IN MSA 413,263 388,621 +6.34% Fort Wayne-Huntington-Auburn, IN CSA
134 Flint, MI MSA 405,813 425,790 −4.69% Detroit-Warren-Ann Arbor, MI CSA
135 Peoria, IL MSA 400,561 416,255 −3.77%
136 Canton-Massillon, OH MSA 397,520 404,422 −1.71% Cleveland-Akron-Canton, OH CSA
137 Anchorage, AK MSA 396,317 380,821 +4.07%
138 Shreveport-Bossier City, LA MSA 394,706 398,604 −0.98% Shreveport-Bossier City-Minden, LA CSA
139 Savannah, GA MSA 393,353 347,611 +13.16% Savannah-Hinesville-Statesboro, GA CSA
140 Beaumont-Port Arthur, TX MSA 392,563 388,745 +0.98%
141 Tallahassee, FL MSA 387,227 367,413 +5.39%
142 Naples-Marco Island, FL MSA 384,902 321,520 +19.71% Cape Coral-Fort Myers-Naples, FL CSA
143 Eugene-Springfield, OR MSA 382,067 351,715 +8.63%
144 Davenport-Moline-Rock Island, IA-IL MSA 379,172 379,690 −0.14% Davenport-Moline, IA-IL CSA
145 Montgomery, AL MSA 373,290 374,536 −0.33% Montgomery-Selma-Alexander City, AL CSA
146 Hickory-Lenoir-Morganton, NC MSA 369,711 365,497 +1.15%
147 Ann Arbor, MI MSA 367,601 344,791 +6.62% Detroit-Warren-Ann Arbor, MI CSA
148 Trenton-Princeton, NJ MSA 367,430 366,513 +0.25% New York-Newark, NY-NJ-CT-PA CSA
149 Ocala, FL MSA 365,579 331,298 +10.35%
150 Fort Collins, CO MSA 356,899 299,630 +19.11%
151 Huntington-Ashland, WV-KY-OH MSA 355,873 370,908 −4.05% Charleston-Huntington-Ashland, WV-OH-KY CSA
152 Lincoln, NE MSA 336,374 302,157 +11.32% Lincoln-Beatrice, NE CSA
153 Rockford, IL MSA 336,116 349,431 −3.81% Rockford-Freeport-Rochelle, IL CSA
154 Gainesville, FL MSA 329,128 305,076 +7.88% Gainesville-Lake City, FL CSA
155 Boulder, CO MSA 326,196 294,567 +10.74% Denver-Aurora, CO CSA
156 Greeley, CO MSA 324,492 252,825 +28.35% Denver-Aurora, CO CSA
157 South Bend-Mishawaka, IN-MI MSA 323,613 319,224 +1.37% South Bend-Elkhart-Mishawaka, IN-MI CSA
158 Green Bay, WI MSA 322,906 306,241 +5.44% Green Bay-Shawano, WI CSA
159 Lubbock, TX MSA 322,257 290,805 +10.82% Lubbock-Plainview-Levelland, TX CSA
160 Columbus, GA-AL MSA 321,048 307,788 +4.31% Columbus-Auburn-Opelika, GA-AL CSA
161 Spartanburg, SC MSA 319,785 284,307 +12.48% Greenville-Spartanburg-Anderson, SC CSA
162 Evansville, IN-KY MSA 315,086 311,552 +1.13%
163 Roanoke, VA MSA 313,222 308,707 +1.46%
164 Clarksville, TN-KY MSA 307,820 273,949 +12.36%
165 Kingsport-Bristol, TN-VA MSA 307,202 309,544 −0.76% Johnson City-Kingsport-Bristol, TN-VA CSA
166 Kennewick-Richland, WA MSA 299,612 253,340 +18.26% Kennewick-Richland-Walla Walla, WA CSA
167 Wilmington, NC MSA 297,533 254,884 +16.73%
168 Olympia-Lacey-Tumwater, WA MSA 290,536 252,264 +15.17% Seattle-Tacoma, WA CSA
169 Utica-Rome, NY MSA 289,990 299,397 −3.14%
170 Duluth, MN-WI MSA 288,732 290,637 −0.66%
171 Hagerstown-Martinsburg, MD-WV MSA 288,104 269,140 +7.05% Washington-Baltimore-Arlington, DC-MD-VA-WV-PA CSA
172 Longview, TX MSA 286,657 280,000 +2.38%
173 Crestview-Fort Walton Beach-Destin, FL MSA 284,809 235,865 +20.75%
174 San Luis Obispo-Paso Robles, CA MSA 283,111 269,637 +5.00%
175 Merced, CA MSA 277,680 255,793 +8.56% San Jose-San Francisco-Oakland, CA CSA
176 Laredo, TX MSA 276,652 250,304 +10.53%
177 Waco, TX MSA 273,920 252,772 +8.37%
178 Santa Cruz-Watsonville, CA MSA 273,213 262,382 +4.13% San Jose-San Francisco-Oakland, CA CSA
179 Cedar Rapids, IA MSA 273,032 257,940 +5.85% Cedar Rapids-Iowa City, IA CSA
180 Bremerton-Silverdale-Port Orchard, WA MSA 271,473 251,133 +8.10% Seattle-Tacoma, WA CSA
181 Erie, PA MSA 269,728 280,566 −3.86% Erie-Meadville, PA CSA
182 Sioux Falls, SD MSA 268,232 228,261 +17.51%
183 Norwich-New London, CT MSA 265,206 274,055 −3.23% Hartford-East Hartford, CT CSA
184 Kalamazoo-Portage, MI MSA 265,066 250,331 +5.89% Kalamazoo-Battle Creek-Portage, MI CSA
185 Amarillo, TX MSA 265,053 251,933 +5.21% Amarillo-Pampa-Borger, TX CSA
186 College Station-Bryan, TX MSA 264,728 228,660 +15.77%
187 Atlantic City-Hammonton, NJ MSA 263,670 274,549 −3.96% Philadelphia-Reading-Camden, PA-NJ-DE-MD CSA
188 Lynchburg, VA MSA 263,566 252,634 +4.33%
189 Charleston, WV MSA 257,074 278,009 −7.53% Charleston-Huntington-Ashland, WV-OH-KY CSA
190 Tuscaloosa, AL MSA 252,047 239,207 +5.37%
191 Yakima, WA MSA 250,873 243,231 +3.14%
192 Fort Smith, AR-OK MSA 250,368 248,208 +0.87%
193 Fargo, ND-MN MSA 246,145 208,777 +17.90% Fargo-Wahpeton, ND-MN CSA
194 Binghamton, NY MSA 238,691 251,725 −5.18%
195 Appleton, WI MSA 237,974 225,666 +5.45% Appleton-Oshkosh-Neenah, WI CSA
196 Prescott Valley-Prescott, AZ MSA 235,099 211,033 +11.40%
197 Lafayette-West Lafayette, IN MSA 233,002 210,297 +10.80% Lafayette-West Lafayette-Frankfort, IN CSA
198 Tyler, TX MSA 232,751 209,714 +10.98% Tyler-Jacksonville, TX CSA
199 Topeka, KS MSA 231,969 233,870 −0.81%
200 Macon-Bibb County, GA MSA 229,996 232,293 −0.99% Macon-Bibb County–Warner Robins, GA CSA
201 Bellingham, WA MSA 229,247 201,140 +13.97%
202 Champaign-Urbana, IL MSA 226,033 217,810 +3.78%
203 Daphne-Fairhope-Foley, AL MSA 223,234 182,265 +22.48% Mobile-Daphne-Fairhope, AL CSA
204 Hilton Head Island-Bluffton-Beaufort, SC MSA 222,195 187,010 +18.81%
205 Rochester, MN MSA 221,921 206,877 +7.27% Rochester-Austin, MN CSA
206 Medford, OR MSA 220,944 203,206 +8.73% Medford-Grants Pass, OR CSA
207 Burlington-South Burlington, VT MSA 220,411 211,261 +4.33% Burlington-South Burlington-Barre, VT CSA
208 Chico, CA MSA 219,186 220,000 −0.37%
209 Charlottesville, VA MSA 218,615 201,559 +8.46%
210 Las Cruces, NM MSA 218,195 209,233 +4.28% El Paso-Las Cruces, TX-NM CSA
211 Yuma, AZ MSA 213,787 195,751 +9.21%
212 Athens-Clarke County, GA MSA 213,750 192,541 +11.02% Atlanta–Athens-Clarke County–Sandy Springs, GA-AL CSA
213 Barnstable Town, MA MSA 212,990 215,888 −1.34% Boston-Worcester-Providence, MA-RI-NH-CT CSA
214 Lake Havasu City-Kingman, AZ MSA 212,181 200,186 +5.99% Las Vegas-Henderson, NV-AZ CSA
215 Lake Charles, LA MSA 210,409 199,607 +5.41% Lake Charles-Jennings, LA CSA
216 Columbia, MO MSA 208,173 190,387 +9.34% Columbia-Moberly-Mexico, MO CSA
217 Houma-Thibodaux, LA MSA 208,075 208,178 −0.05%
218 Springfield, IL MSA 206,868 210,170 −1.57% Springfield-Jacksonville-Lincoln, IL CSA
219 Elkhart-Goshen, IN MSA 206,341 197,559 +4.45% South Bend-Elkhart-Mishawaka, IN-MI CSA
220 Florence, SC MSA 204,911 205,566 −0.32%
221 Gainesville, GA MSA 204,441 179,684 +13.78% Atlanta–Athens-Clarke County–Sandy Springs, GA-AL CSA
222 Johnson City, TN MSA 203,649 198,716 +2.48% Johnson City-Kingsport-Bristol, TN-VA CSA
223 St. Cloud, MN MSA 201,964 189,093 +6.81% Minneapolis-St. Paul, MN-WI CSA
224 Monroe, LA MSA 200,261 204,420 −2.03% Monroe-Ruston, LA CSA
225 Jacksonville, NC MSA 197,938 177,772 +11.34%
226 Bend, OR MSA 197,692 157,733 +25.33% Bend-Prineville, OR CSA
227 Racine, WI MSA 196,311 195,408 +0.46% Milwaukee-Racine-Waukesha, WI CSA
228 Saginaw, MI MSA 190,539 200,169 −4.81% Saginaw-Midland-Bay City, MI CSA
229 Punta Gorda, FL MSA 188,910 159,978 +18.08% North Port-Sarasota, FL CSA
230 Terre Haute, IN MSA 186,367 189,764 −1.79%
231 Warner Robins, GA MSA 185,409 167,595 +10.63% Macon-Bibb County–Warner Robins, GA CSA
232 Midland, TX MSA 182,603 141,671 +28.89% Midland-Odessa, TX CSA
233 Billings, MT MSA 181,667 167,167 +8.67%
234 El Centro, CA MSA 181,215 174,528 +3.83%
235 Dover, DE MSA 180,786 162,310 +11.38% Philadelphia-Reading-Camden, PA-NJ-DE-MD CSA
236 Greenville, NC MSA 180,742 168,148 +7.49% Greenville-Kinston-Washington, NC CSA
237 Redding, CA MSA 180,080 177,223 +1.61% Redding-Red Bluff, CA CSA
238 Joplin, MO MSA 179,564 175,518 +2.31% Joplin-Miami, MO-OK CSA
239 Bowling Green, KY MSA 179,240 158,599 +13.01% Bowling Green-Glasgow, KY CSA
240 Jackson, TN MSA 178,644 179,694 −0.58%
241 Kingston, NY MSA 177,573 182,493 −2.70% New York-Newark, NY-NJ-CT-PA CSA
242 St. George, UT MSA 177,556 138,115 +28.56%
243 Yuba City, CA MSA 175,639 166,892 +5.24% Sacramento-Roseville, CA CSA
244 Panama City, FL MSA 174,705 168,852 +3.47%
245 Muskegon, MI MSA 173,566 172,188 +0.80% Grand Rapids-Kentwood-Muskegon, MI CSA
246 Iowa City, IA MSA 173,105 152,586 +13.45% Cedar Rapids-Iowa City, IA CSA
247 Abilene, TX MSA 172,060 165,252 +4.12%
248 Oshkosh-Neenah, WI MSA 171,907 166,994 +2.94% Appleton-Oshkosh-Neenah, WI CSA
249 Bloomington, IL MSA 171,517 169,572 +1.15% Bloomington-Pontiac, IL CSA
250 East Stroudsburg, PA MSA 170,271 169,842 +0.25% New York-Newark, NY-NJ-CT-PA CSA
251 Burlington, NC MSA 169,509 151,131 +12.16% Greensboro–Winston-Salem–High Point, NC CSA
252 Eau Claire, WI MSA 169,304 161,151 +5.06% Eau Claire-Menomonie, WI CSA
253 Bloomington, IN MSA 169,230 159,549 +6.07% Bloomington-Bedford, IN CSA
254 Hattiesburg, MS MSA 168,849 162,410 +3.96% Hattiesburg-Laurel, MS CSA
255 Waterloo-Cedar Falls, IA MSA 168,522 167,819 +0.42%
256 Pueblo, CO MSA 168,424 159,063 +5.89% Pueblo-Cañon City, CO CSA
257 Blacksburg-Christiansburg, VA MSA 167,531 162,958 +2.81%
258 Kahului-Wailuku-Lahaina, HI MSA 167,417 154,834 +8.13%
259 Odessa, TX MSA 166,223 137,130 +21.22% Midland-Odessa, TX CSA
260 Coeur d'Alene, ID MSA 165,697 138,494 +19.64% Spokane-Spokane Valley-Coeur d'Alene, WA-ID CSA
261 Auburn-Opelika, AL MSA 164,542 140,247 +17.32% Columbus-Auburn-Opelika, GA-AL CSA
262 Janesville-Beloit, WI MSA 163,354 160,331 +1.89% Madison-Janesville-Beloit, WI CSA
263 Wausau-Weston, WI MSA 163,285 162,806 +0.29% Wausau-Stevens Point-Wisconsin Rapids, WI CSA
264 State College, PA MSA 162,385 153,990 +5.45% State College-DuBois, PA CSA
265 Sebastian-Vero Beach, FL MSA 159,923 138,028 +15.86% Miami-Port St. Lucie-Fort Lauderdale, FL CSA
266 Jackson, MI MSA 158,510 160,248 −1.08%
267 Madera, CA MSA 157,327 150,865 +4.28% Fresno-Madera-Hanford, CA CSA
268 Chambersburg-Waynesboro, PA MSA 155,027 149,618 +3.62% Washington-Baltimore-Arlington, DC-MD-VA-WV-PA CSA
269 Grand Junction, CO MSA 154,210 146,723 +5.10%
270 Elizabethtown-Fort Knox, KY MSA 153,928 148,338 +3.77% Louisville/Jefferson County–Elizabethtown–Bardstown, KY-IN CSA
271 Niles, MI MSA 153,401 156,813 −2.18% South Bend-Elkhart-Mishawaka, IN-MI CSA
272 Hanford-Corcoran, CA MSA 152,940 152,982 −0.03% Fresno-Madera-Hanford, CA CSA
273 Decatur, AL MSA 152,603 153,829 −0.80% Huntsville-Decatur, AL CSA
274 Bangor, ME MSA 152,148 153,923 −1.15%
275 Alexandria, LA MSA 152,037 153,922 −1.22%
276 Idaho Falls, ID MSA 151,530 133,265 +13.71% Idaho Falls-Rexburg-Blackfoot, ID CSA
277 Wichita Falls, TX MSA 151,254 151,306 −0.03%
278 Jefferson City, MO MSA 151,235 149,807 +0.95%
279 Monroe, MI MSA 150,500 152,021 −1.00% Detroit-Warren-Ann Arbor, MI CSA
280 Santa Fe, NM MSA 150,358 144,170 +4.29% Albuquerque-Santa Fe-Las Vegas, NM CSA
281 Homosassa Springs, FL MSA 149,657 141,236 +5.96%
282 Vineland-Bridgeton, NJ MSA 149,527 156,898 −4.70% Philadelphia-Reading-Camden, PA-NJ-DE-MD CSA
283 Dothan, AL MSA 149,358 145,639 +2.55% Dothan-Ozark, AL CSA
284 Texarkana, TX-AR MSA 148,761 149,198 −0.29%
285 Florence-Muscle Shoals, AL MSA 147,970 147,137 +0.57%
286 Valdosta, GA MSA 147,292 139,588 +5.52%
287 Albany, GA MSA 146,726 153,857 −4.63%
288 Rocky Mount, NC MSA 145,770 152,392 −4.35% Rocky Mount-Wilson-Roanoke Rapids, NC CSA
289 Dalton, GA MSA 144,724 142,227 +1.76% Chattanooga-Cleveland-Dalton, TN-GA-AL CSA
290 Sioux City, IA-NE-SD MSA 144,701 143,577 +0.78%
291 Flagstaff, AZ MSA 143,476 134,421 +6.74%
292 Morristown, TN MSA 142,749 136,608 +4.50% Knoxville-Morristown-Sevierville, TN CSA
293 Logan, UT-ID MSA 142,165 125,442 +13.33%
294 Rapid City, SD MSA 142,107 126,382 +12.44% Rapid City-Spearfish, SD CSA
295 Lebanon, PA MSA 141,793 133,568 +6.16% Harrisburg-York-Lebanon, PA CSA
296 Winchester, VA-WV MSA 140,566 128,472 +9.41% Washington-Baltimore-Arlington, DC-MD-VA-WV-PA CSA
297 Sumter, SC MSA 140,466 142,427 −1.38%
298 Morgantown, WV MSA 139,044 129,709 +7.20% Morgantown-Fairmont, WV CSA
299 Wheeling, WV-OH MSA 138,948 147,950 −6.08%
300 Napa, CA MSA 137,744 136,484 +0.92% San Jose-San Francisco-Oakland, CA CSA
301 La Crosse-Onalaska, WI-MN MSA 136,616 133,665 +2.21%
302 Sherman-Denison, TX MSA 136,212 120,877 +12.69% Dallas-Fort Worth, TX-OK CSA
303 Carbondale-Marion, IL MSA 135,764 139,157 −2.44%
304 Harrisonburg, VA MSA 134,964 125,228 +7.77% Harrisonburg-Staunton-Waynesboro, VA CSA
305 Hammond, LA MSA 134,758 121,097 +11.28% New Orleans-Metairie-Hammond, LA-MS CSA
306 Battle Creek, MI MSA 134,159 136,146 −1.46% Kalamazoo-Battle Creek-Portage, MI CSA
307 Springfield, OH MSA 134,083 138,333 −3.07% Dayton-Springfield-Kettering, OH CSA
308 Jonesboro, AR MSA 133,860 121,026 +10.60% Jonesboro-Paragould, AR CSA
309 The Villages, FL MSA 132,420 93,420 +41.75% Orlando-Lakeland-Deltona, FL CSA
310 Manhattan, KS MSA 130,285 127,081 +2.52%
311 Johnstown, PA MSA 130,192 143,679 −9.39% Johnstown-Somerset, PA CSA
312 Albany-Lebanon, OR MSA 129,749 116,672 +11.21% Portland-Vancouver-Salem, OR-WA CSA
313 Mount Vernon-Anacortes, WA MSA 129,205 116,901 +10.53% Seattle-Tacoma, WA CSA
314 Bismarck, ND MSA 128,949 110,625 +16.56%
315 Lawton, OK MSA 126,415 130,291 −2.97%
316 Sierra Vista-Douglas, AZ MSA 125,922 131,346 −4.13%
317 St. Joseph, MO-KS MSA 125,223 127,329 −1.65% Kansas City-Overland Park-Kansas City, MO-KS CSA
318 Glens Falls, NY MSA 125,148 128,923 −2.93% Albany-Schenectady, NY CSA
319 Pittsfield, MA MSA 124,944 131,219 −4.78%
320 Cleveland, TN MSA 124,942 115,788 +7.91% Chattanooga-Cleveland-Dalton, TN-GA-AL CSA
321 New Bern, NC MSA 124,284 126,802 −1.99% New Bern-Morehead City, NC CSA
322 Farmington, NM MSA 123,958 130,044 −4.68%
323 Ames, IA MSA 123,351 115,848 +6.48% Des Moines-Ames-West Des Moines, IA CSA
324 Goldsboro, NC MSA 123,131 122,623 +0.41%
325 Staunton, VA MSA 123,120 118,502 +3.90% Harrisonburg-Staunton-Waynesboro, VA CSA
326 Lawrence, KS MSA 122,259 110,826 +10.32% Kansas City-Overland Park-Kansas City, MO-KS CSA
327 San Angelo, TX MSA 122,027 112,966 +8.02%
328 Altoona, PA MSA 121,829 127,089 −4.14%
329 Mansfield, OH MSA 121,154 124,475 −2.67% Mansfield-Ashland-Bucyrus, OH CSA
330 Wenatchee, WA MSA 120,629 110,884 +8.79%
331 Missoula, MT MSA 119,600 109,299 +9.42%
332 Owensboro, KY MSA 119,440 114,752 +4.09%
333 Brunswick, GA MSA 118,779 112,370 +5.70%
334 Weirton-Steubenville, WV-OH MSA 116,074 124,454 −6.73% Pittsburgh-New Castle-Weirton, PA-OH-WV CSA
335 Beckley, WV MSA 115,767 124,898 −7.31%
336 Sheboygan, WI MSA 115,340 115,507 −0.14%
337 Muncie, IN MSA 114,135 117,671 −3.00% Indianapolis-Carmel-Muncie, IN CSA
338 Anniston-Oxford, AL MSA 113,605 118,572 −4.19%
339 California-Lexington Park, MD MSA 113,510 105,151 +7.95% Washington-Baltimore-Arlington, DC-MD-VA-WV-PA CSA
340 Williamsport, PA MSA 113,299 116,111 −2.42% Williamsport-Lock Haven, PA CSA
341 Twin Falls, ID MSA 111,290 99,604 +11.73%
342 Longview, WA MSA 110,593 102,410 +7.99% Portland-Vancouver-Salem, OR-WA CSA
343 Michigan City-La Porte, IN MSA 109,888 111,467 −1.42% Chicago-Naperville, IL-IN-WI CSA
344 Kankakee, IL MSA 109,862 113,449 −3.16% Chicago-Naperville, IL-IN-WI CSA
345 Watertown-Fort Drum, NY MSA 109,834 116,229 −5.50%
346 Lewiston-Auburn, ME MSA 108,277 107,702 +0.53% Portland-Lewiston-South Portland, ME CSA
347 Sebring-Avon Park, FL MSA 106,221 98,786 +7.53%
348 Decatur, IL MSA 104,009 110,768 −6.10%
349 Fond du Lac, WI MSA 103,403 101,633 +1.74%
350 Bay City, MI MSA 103,126 107,771 −4.31% Saginaw-Midland-Bay City, MI CSA
351 Gettysburg, PA MSA 103,009 101,407 +1.58% Harrisburg-York-Lebanon, PA CSA
352 Lima, OH MSA 102,351 106,331 −3.74% Lima-Van Wert-Celina, OH CSA
353 Gadsden, AL MSA 102,268 104,430 −2.07%
354 Ithaca, NY MSA 102,180 101,564 +0.61% Ithaca-Cortland, NY CSA
355 Mankato, MN MSA 101,927 96,740 +5.36% Mankato-New Ulm, MN CSA
356 Grand Forks, ND-MN MSA 100,815 98,461 +2.39%
357 Victoria, TX MSA 99,742 94,003 +6.11% Victoria-Port Lavaca, TX CSA
358 Cheyenne, WY MSA 99,500 91,738 +8.46%
359 Hot Springs, AR MSA 99,386 96,024 +3.50% Hot Springs-Malvern, AR CSA
360 Rome, GA MSA 98,498 96,317 +2.26% Atlanta–Athens-Clarke County–Sandy Springs, GA-AL CSA
361 Dubuque, IA MSA 97,311 93,653 +3.91%
362 Cumberland, MD-WV MSA 97,284 103,299 −5.82%
363 Fairbanks, AK MSA 96,849 97,581 −0.75%
364 Cape Girardeau, MO-IL MSA 96,765 96,275 +0.51% Cape Girardeau-Sikeston, MO-IL CSA
365 Pocatello, ID MSA 95,489 90,656 +5.33%
366 Corvallis, OR MSA 93,053 85,579 +8.73% Portland-Vancouver-Salem, OR-WA CSA
367 Ocean City, NJ MSA 92,039 97,265 −5.37% Philadelphia-Reading-Camden, PA-NJ-DE-MD CSA
368 Parkersburg-Vienna, WV MSA 89,339 92,673 −3.60% Parkersburg-Marietta-Vienna, WV-OH CSA
369 Pine Bluff, AR MSA 87,804 100,258 −12.42% Little Rock-North Little Rock, AR CSA
370 Grants Pass, OR MSA 87,487 82,713 +5.77% Medford-Grants Pass, OR CSA
371 Columbus, IN MSA 83,779 76,794 +9.10% Indianapolis-Carmel-Muncie, IN CSA
372 Elmira, NY MSA 83,456 88,830 −6.05% Elmira-Corning, NY CSA
373 Bloomsburg-Berwick, PA MSA 83,194 85,562 −2.77% Bloomsburg-Berwick-Sunbury, PA CSA
374 Midland, MI MSA 83,156 83,629 −0.57% Saginaw-Midland-Bay City, MI CSA
375 Kokomo, IN MSA 82,544 82,752 −0.25% Kokomo-Peru, IN CSA
376 Great Falls, MT MSA 81,366 81,327 +0.05%
377 Hinesville, GA MSA 80,994 77,917 +3.95% Savannah-Hinesville-Statesboro, GA CSA
378 Casper, WY MSA 79,858 75,450 +5.84%
379 Danville, IL MSA 75,758 81,625 −7.19%
380 Grand Island, NE MSA 75,553 72,726 +3.89%
381 Lewiston, ID-WA MSA 62,990 60,888 +3.45%
382 Enid, OK MSA 61,056 60,580 +0.79%
383 Walla Walla, WA MSA 60,760 58,781 +3.37%
384 Carson City, NV MSA 55,916 55,274 +1.16% Reno-Carson City-Fernley, NV CSA

Puerto Rico

The following sortable table lists the eight Metropolitan Statistical Areas (MSAs) of Puerto Rico with the following information:

  1. The MSA rank by population as of July 1, 2019, as estimated by the United States Census Bureau[2]
  2. The MSA name as designated by the United States Office of Management and Budget[1]
  3. The MSA population as of July 1, 2019, as estimated by the United States Census Bureau[2]
  4. The MSA population as of April 1, 2010, as enumerated by the 2010 United States Census[2]
  5. The percent MSA population change from April 1, 2010, to July 1, 2019[2]
  6. The Combined Statistical Area (CSA)[3] if the MSA is a component[1]
The Eight Metropolitan Statistical Areas of the Commonwealth of Puerto Rico

Rank Metropolitan Statistical Area 2019 Estimate 2010 Census Change Encompassing Combined Statistical Area
1 San Juan-Bayamón-Caguas, PR Metropolitan Statistical Area 2,023,227 2,350,126 −13.91% San Juan-Bayamón, PR Combined Statistical Area
2 Aguadilla-Isabela, PR Metropolitan Statistical Area 289,289 339,441 −14.77%
3 Ponce, PR Metropolitan Statistical Area 215,295 262,630 −18.02% Ponce-Yauco-Coamo, PR Combined Statistical Area
4 Arecibo, PR Metropolitan Statistical Area 174,606 199,471 −12.47% San Juan-Bayamón, PR Combined Statistical Area
5 San Germán, PR Metropolitan Statistical Area 121,464 137,462 −11.64% Mayagüez-San Germán, PR Combined Statistical Area
6 Mayagüez, PR Metropolitan Statistical Area 94,975 116,211 −18.27% Mayagüez-San Germán, PR Combined Statistical Area
7 Yauco, PR Metropolitan Statistical Area 85,830 107,333 −20.03% Ponce-Yauco-Coamo, PR Combined Statistical Area
8 Guayama, PR Metropolitan Statistical Area 72,914 84,214 −13.42% San Juan-Bayamón, PR Combined Statistical Area

See also

References

This article is issued from Wikipedia. The text is licensed under Creative Commons - Attribution - Sharealike. Additional terms may apply for the media files.