Low-carbon power
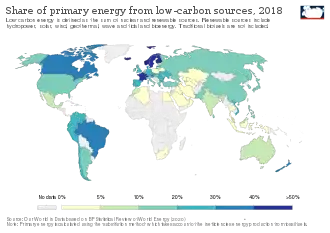
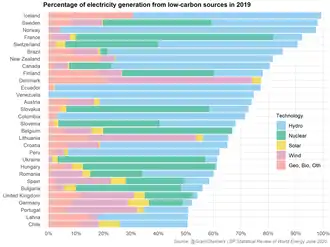
Low-carbon power comes from processes or technologies that produce power with substantially lower amounts of carbon dioxide emissions than is emitted from conventional fossil fuel power generation. It includes low carbon power generation sources such as wind power, solar power, hydropower and nuclear power.[1][2] The term largely excludes conventional fossil fuel plant sources, and is only used to describe a particular subset of operating fossil fuel power systems, specifically, those that are successfully coupled with a flue gas carbon capture and storage (CCS) system.[3] Globally, 36.4% of electricity generation comes from low-carbon sources.[4] As of 2018 the largest low-carbon energy sources globally were hydropower and nuclear power, with the latter providing over 50% of low-carbon power alone in United States and European Union.[5]
| Part of a series about |
| Sustainable energy |
|---|
 |
| Overview |
| Energy conservation |
| Renewable energy |
| Sustainable transport |
|
History
Over the past 30 years, significant findings regarding global warming highlighted the need to curb carbon emissions. From this, the idea for low-carbon power was born. The Intergovernmental Panel on Climate Change (IPCC), established by the World Meteorological Organization (WMO) and the United Nations Environment Program (UNEP) in 1988, set the scientific precedence for the introduction of low-carbon power. The IPCC has continued to provide scientific, technical and socio-economic advice to the world community, through its periodic assessment reports and special reports.[6]
Internationally, the most prominent early step in the direction of low carbon power was the signing of the Kyoto Protocol, which came into force on 16 February 2005, under which most industrialized countries committed to reduce their carbon emissions. The historical event set the political precedence for introduction of low-carbon power technology.
On a social level, perhaps the biggest factor contributing to the general public's awareness of climate change and the need for new technologies, including low carbon power, came from the documentary An Inconvenient Truth, which clarified and highlighted the problem of global warming.
Power sources by carbon dioxide emissions
Vattenfall study
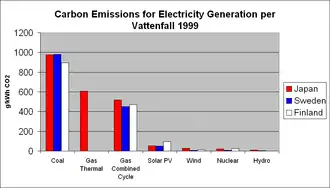
In 1997, the Swedish utility Vattenfall did a study of full life cycle emissions of nuclear, hydro, coal, gas, peat and wind which the utility uses to produce electricity. The result of the study concluded that the grams of CO2 per kWh of electricity by source are nuclear (5), hydroelectric (9), wind (15), natural gas (503), peat (636), coal (781).[7]
Sovacool life cycle study survey
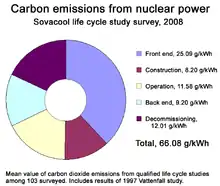
A 2008 meta analysis, "Valuing the use Gas Emissions from Nuclear Power: A Critical Survey,"[8] by Benjamin K. Sovacool, analysed 103 life cycle studies of greenhouse gas-equivalent emissions for nuclear power plants. The studies surveyed included the 1997 Vattenfall comparative emissions study, among others. Sovacool's analysis calculated that the mean value of emissions over the lifetime of a nuclear power plant is 66 g/kWh. Comparative results for wind power, hydroelectricity, solar thermal power, and solar photovoltaic, were 9-10 g/kWh, 10-13 g/kWh, 13 g/kWh and 32 g/kWh respectively.[9] Sovacool's analysis has been criticized for poor methodology and data selection.[10]
Yale University life cycle analysis of nuclear power
A 2012 life cycle assessment (LCA) review by Yale University said that "depending on conditions, median life cycle GHG emissions [for nuclear electricity generation technologies] could be 9 to 110 g CO
2-eq/kWh by 2050." It stated:[1]
"The collective LCA literature indicates that life cycle GHG emissions from nuclear power are only a fraction of traditional fossil sources and comparable to renewable technologies."
It added that for the most common category of reactors, the Light water reactor (LWR):
"Harmonization decreased the median estimate for all LWR technology categories so that the medians of BWRs, PWRs, and all LWRs are similar, at approximately 12 g CO
2-eq/kWh"
Differentiating attributes of low-carbon power sources
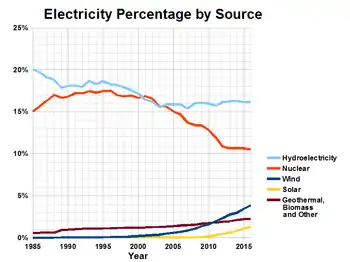
There are many options for lowering current levels of carbon emissions. Some options, such as wind power and solar power, produce low quantities of total life cycle carbon emissions, using entirely renewable sources. Other options, such as nuclear power, produce a comparable amount of carbon dioxide emissions as renewable technologies in total life cycle emissions, but consume non-renewable, but sustainable[11] materials (uranium). The term low-carbon power can also include power that continues to utilize the world's natural resources, such as natural gas and coal, but only when they employ techniques that reduce carbon dioxide emissions from these sources when burning them for fuel, such as the, as of 2012, pilot plants performing Carbon capture and storage.[3][12]
As the single largest emitter of carbon dioxide in the United States, the electric-power industry accounted for 39% of CO2 emissions in 2004, a 27% increase since 1990.[13] Because the cost of reducing emissions in the electricity sector appears to be lower than in other sectors such as transportation, the electricity sector may deliver the largest proportional carbon reductions under an economically efficient climate policy.[14]
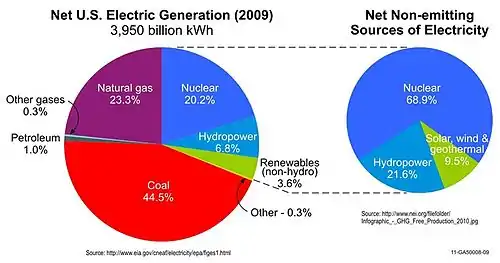
Technologies to produce electric power with low-carbon emissions are already in use at various scales. Together, they account for roughly 28% of all U.S. electric-power production, with nuclear power representing the majority (20%), followed by hydroelectric power (7%).[14] However, demand for power is increasing, driven by increased population and per capita demand, and low-carbon power can supplement the supply needed.[15]
In 2016, the United Kingdom official statistics show low carbon sources for electricity account for more than 45% of the power generated. However, the amount of time that electricity is being produced during the year differs depending on the power station. Nuclear power produced electricity 77% of the time, which is much larger than wind power which produced electricity 29% of the time.[16]
| EROEI | energy sources in 2013 |
|---|---|
| 3.5 | Biomass (corn) |
| 3.9 | Solar PV (Germany) |
| 16 | Wind (E-66 turbine) |
| 19 | Solar thermal CSP (desert) |
| 28 | Fossil gas in a CCGT |
| 30 | Coal |
| 49 | Hydro (medium-sized dam) |
| 75 | Nuclear (in a PWR) |
| Source:[17] | |
According to a transatlantic collaborative research paper on Energy return on energy Invested (EROEI), conducted by six analysts led by D. Weißbach, and described as "...the most extensive overview so far based on a careful evaluation of available Life Cycle Assessments".[18] It was published in the peer reviewed journal Energy in 2013. The uncorrected for their intermittency("unbuffered") EROEI for each energy source analyzed is as depicted in the attached table at right.[17][19][20] While the buffered (corrected for their intermittency) EROEI stated in the paper for all low-carbon power sources, with the exception of nuclear and biomass, were yet lower still. As when corrected for their weather intermittency/"buffered", the EROEI figures for intermittent energy sources as stated in the paper is diminished – a reduction of EROEI dependent on how reliant they are on back up energy sources.[17][20]
Although the methodological integrity of this paper was challenged by, Marco Raugei, in late 2013.[21] The authors of the initial paper responded to each of Raugei's concerns in 2014, and after analysis, each of Raugei's concerns were summarized as "not scientifically justified" and based on faulty EROEI understandings due to "politically motivated energy evaluations".[22]
Technologies
The 2014 Intergovernmental Panel on Climate Change report identifies nuclear, wind, solar and hydroelectricity in suitable locations as technologies that can provide electricity with less than 5% of the lifecycle greenhouse gas emissions of coal power.[23]
Hydroelectric power
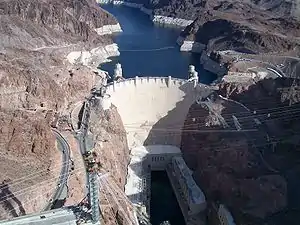
Hydroelectric plants have the advantage of being long-lived and many existing plants have operated for more than 100 years. Hydropower is also an extremely flexible technology from the perspective of power grid operation. Large hydropower provides one of the lowest cost options in today's energy market, even compared to fossil fuels and there are no harmful emissions associated with plant operation.[24] However, there are typically low greenhouse gas emissions with reservoirs, and possibly high emissions in the tropics.
Hydroelectric power is the world's largest low carbon source of electricity, supplying 15.6% of total electricity in 2019.[25] China is by far the world's largest producer of hydroelectricity in the world, followed by Brazil and Canada.
However, there are several significant social and environmental disadvantages of large-scale hydroelectric power systems: dislocation, if people are living where the reservoirs are planned, release of significant amounts of carbon dioxide and methane during construction and flooding of the reservoir, and disruption of aquatic ecosystems and birdlife.[26] There is a strong consensus now that countries should adopt an integrated approach towards managing water resources, which would involve planning hydropower development in co-operation with other water-using sectors.[24]
Nuclear power
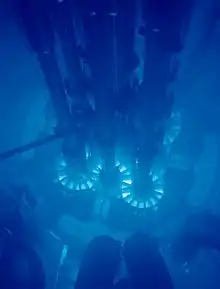
Nuclear power, with a 10.6% share of world electricity production as of 2013, is the second largest low-carbon power source.[27]
Nuclear power, in 2010, also provided two thirds of the twenty seven nation European Union's low-carbon energy,[28] with some EU nations sourcing a large fraction of their electricity from nuclear power; for example France derives 79% of its electricity from nuclear. As of 2020 nuclear power provided 47% low-carbon power in the EU[29] with countries largely based on nuclear power routinely achieving carbon intensity of 30-60 gCO2eq/kWh.[30]
According to the IAEA and the European Nuclear Society, worldwide there were 68 civil nuclear power reactors under construction in 15 countries in 2013.[31][32] China has 29 of these nuclear power reactors under construction, as of 2013, with plans to build many more,[32][33] while in the US the licenses of almost half its reactors have been extended to 60 years,[34] and plans to build another dozen are under serious consideration.[35] There is also a considerable number of new reactors being built in South Korea, India, and Russia.
Nuclear power's capability to add significantly to future low carbon energy growth depends on several factors, including the economics of new reactor designs, such as Generation III reactors, public opinion and national and regional politics.
The 104 U.S. nuclear plants are undergoing a Light Water Reactor Sustainability Program, to sustainably extend the life span of the U.S. nuclear fleet by a further 20 years. With further US power plants under construction in 2013, such as the two AP1000s at Vogtle Electric Generating Plant. However the Economics of new nuclear power plants are still evolving and plans to add to those plants are mostly in flux.[36]
Wind power
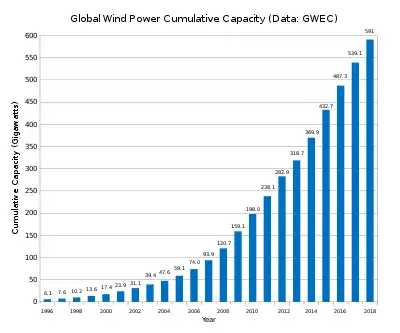
Worldwide there are now over two hundred thousand wind turbines operating, with a total nameplate capacity of 238,351 MW as of end 2011,[38] while not correcting for Wind power's comparatively low ~30% capacity factor. The European Union alone passed some 100,000 MW nameplate capacity in September 2012,[39] while the United States surpassed 50,000 MW in August 2012 and China passed 50,000 MW the same month.[40][41] World wind generation capacity more than quadrupled between 2000 and 2006, doubling about every three years. The United States pioneered wind farms and led the world in installed capacity in the 1980s and into the 1990s. In 1997 German installed capacity surpassed the U.S. and led until once again overtaken by the U.S. in 2008. China has been rapidly expanding its wind installations in the late 2000s and passed the U.S. in 2010 to become the world leader.
At the end of 2011, worldwide nameplate capacity of wind-powered generators was 238 gigawatts (GW), growing by 40.5 GW of nameplate capacity over the preceding year.[42] Between 2005 and 2010 the average annual growth in new installations was 27.6 percent. According to the World Wind Energy Association, an industry organization, in 2010 wind power generated 430 TWh or about 2.5% of worldwide electricity usage,[43] up from 1.5% in 2008 and 0.1% in 1997. Wind power's share of worldwide electricity usage at the end of 2014 was 3.1%.[44] Several countries have already achieved relatively high levels of penetration, such as 28% of stationary (grid) electricity production in Denmark (2011),[45] 19% in Portugal (2011),[46] 16% in Spain (2011),[47] 14% in Ireland (2010 to 2014)[48] and 8% in Germany (2011).[49] As of 2011, 83 countries around the world were using wind power on a commercial basis.
Solar power
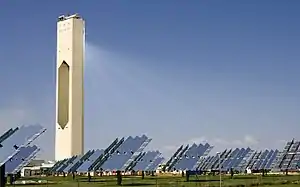
Solar power is the conversion of sunlight into electricity, either directly using photovoltaics (PV), or indirectly using concentrated solar power (CSP). Concentrated solar power systems use lenses or mirrors and tracking systems to focus a large area of sunlight into a small beam. Photovoltaics convert light into electric current using the photoelectric effect.[50]
Commercial concentrated solar power plants were first developed in the 1980s. The 354 MW SEGS CSP installation is the largest solar power plant in the world, located in the Mojave Desert of California. Other large CSP plants include the Solnova Solar Power Station (150 MW) and the Andasol solar power station (150 MW), both in Spain. The over 200 MW Agua Caliente Solar Project in the United States, and the 214 MW Charanka Solar Park in India, are the world's largest photovoltaic plants. Solar power's share of worldwide electricity usage at the end of 2014 was 1%.[44]
Geothermal power
Geothermal electricity is electricity generated from geothermal energy. Technologies in use include dry steam power plants, flash steam power plants and binary cycle power plants. Geothermal electricity generation is used in 24 countries[51] while geothermal heating is in use in 70 countries.[52]
Current worldwide installed capacity is 10,715 megawatts (MW), with the largest capacity in the United States (3,086 MW),[53] Philippines, and Indonesia. Estimates of the electricity generating potential of geothermal energy vary from 35 to 2000 GW.[52]
Geothermal power is considered to be sustainable because the heat extraction is small compared to the Earth's heat content.[54] The emission intensity of existing geothermal electric plants is on average 122 kg of CO
2 per megawatt-hour (MW·h) of electricity, a small fraction of that of conventional fossil fuel plants.[55]
Tidal power
Tidal power is a form of hydropower that converts the energy of tides into electricity or other useful forms of power. The first large-scale tidal power plant (the Rance Tidal Power Station) started operation in 1966. Although not yet widely used, tidal power has potential for future electricity generation. Tides are more predictable than wind energy and solar power.
Carbon capture and storage
Carbon capture and storage captures carbon dioxide from the flue gas of power plants or other industry, transporting it to an appropriate location where it can be buried securely in an underground reservoir. While the technologies involved are all in use, and carbon capture and storage is occurring in other industries (e.g., at the Sleipner gas field), no large scale integrated project has yet become operational within the power industry.
Improvements to current carbon capture and storage technologies could reduce CO2 capture costs by at least 20-30% over approximately the next decade, while new technologies under development promise more substantial cost reduction.[56]
Outlook and requirements
Emissions
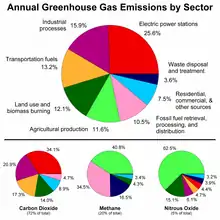
The Intergovernmental Panel on Climate Change stated in its first working group report that “most of the observed increase in globally averaged temperatures since the mid-20th century is very likely due to the observed increase in anthropogenic greenhouse gas concentrations, contribute to climate change.[57]
As a percentage of all anthropogenic greenhouse gas emissions, carbon dioxide (CO2) accounts for 72 percent (see Greenhouse gas), and has increased in concentration in the atmosphere from 315 parts per million (ppm) in 1958 to more than 375 ppm in 2005.[58]
Emissions from energy make up more than 61.4 percent of all greenhouse gas emissions.[59] Power generation from traditional coal fuel sources accounts for 18.8 percent of all world greenhouse gas emissions, nearly double that emitted by road transportation.[59]
Estimates state that by 2020 the world will be producing around twice as much carbon emissions as it was in 2000.[60]
The European Union hopes to sign a law mandating net-zero greenhouse gas emissions in the coming year for all 27 countries in the union.
Electricity usage
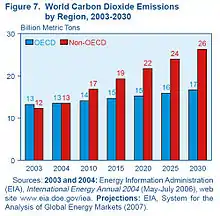
World energy consumption is predicted to increase from 123,000 TWh (421 quadrillion BTU) in 2003 to 212,000 TWh (722 quadrillion BTU) in 2030.[61] Coal consumption is predicted to nearly double in that same time.[62] The fastest growth is seen in non-OECD Asian countries, especially China and India, where economic growth drives increased energy use.[63] By implementing low-carbon power options, world electricity demand could continue to grow while maintaining stable carbon emission levels.
In the transportation sector there are moves away from fossil fuels and towards electric vehicles, such as mass transit and the electric car. These trends are small, but may eventually add a large demand to the electrical grid.
Domestic and industrial heat and hot water have largely been supplied by burning fossil fuels such as fuel oil or natural gas at the consumers' premises. Some countries have begun heat pump rebates to encourage switching to electricity, potentially adding a large demand to the grid.[64]
Energy infrastructure
By 2015, one-third of the 2007 U.S. coal plants were more than 50 years old.[65] Nearly two-thirds of the generation capacity required to meet power demand in 2030 is yet to be built.[65] There were 151 new coal-fired power plants planned for the U.S., providing 90 GW of power.[56] By 2012, that had dropped to 15, mostly due to new rules limiting mercury emissions, and limiting carbon emissions to 1,000 pounds of CO2 per megawatt-hour of electricity produced.[66]
Investment
Investment in low-carbon power sources and technologies is increasing at a rapid rate. Zero-carbon power sources produce about 2% of the world's energy, but account for about 18% of world investment in power generation, attracting $100 billion of investment capital in 2006.[67]
See also
References
- Warner, Ethan S. (2012). "Life Cycle Greenhouse Gas Emissions of Nuclear Electricity Generation". Journal of Industrial Ecology. 16: S73–S92. doi:10.1111/j.1530-9290.2012.00472.x. S2CID 153286497.
- "The European Strategic Energy Technology Plan SET-Plan Towards a low-carbon future" (PDF). 2010. p. 6. Archived from the original (PDF) on 11 February 2014.
... nuclear plants ... currently provide 1/3 of the EU’s electricity and 2/3 of its low-carbon energy.
- https://www.gov.uk/innovation-funding-for-low-carbon-technologies-opportunities-for-bidders Innovation funding for low-carbon technologies: opportunities for bidders. "Meeting the energy challenge and government programme names nuclear power in the future energy mix, alongside other low-carbon sources, renewables and carbon capture and storage (CCS)."
- "Global electricity data summarized by LowCarbonPower.org, based on data compiled by BP for the year 2019". LowCarbonPower.org. Retrieved 12 May 2020.
- "PRIS - Trend reports - Electricity Supplied". pris.iaea.org. Retrieved 18 June 2020.
- "Intergovernmental Panel on Climate Change Web site". IPCC.ch. Archived from the original on 25 August 2006. Retrieved 1 October 2017.
- "vattenfall.com" (PDF). Vattenfall.com. Retrieved 1 October 2017.
- Benjamin K. Sovacool. Valuing the greenhouse gas emissions from nuclear power: A critical survey Energy Policy, Vol. 36, 2008, pp. 2940-2953.
- Benjamin K. Sovacool. Valuing the greenhouse gas emissions from nuclear power: A critical survey. Energy Policy, Vol. 36, 2008, p. 2950.
- Jef Beerten, Erik Laes, Gaston Meskens, and William D’haeseleer Greenhouse gas emissions in the nuclear life cycle: A balanced appraisal Energy Policy, Vol. 37, Issue 12, 2009, pp. 5056–5068.
- "Is Nuclear Energy Renewable Energy?". large.Stanford.edu. Retrieved 1 October 2017.
- "Amid Economic Concerns, Carbon Capture Faces a Hazy Future". NationalGeographic.com. 23 May 2012. Retrieved 1 October 2017.
- Clayton, Mark (6 April 2006). "New case for regulating CO2 emissions". Retrieved 1 October 2017 – via Christian Science Monitor.
- "Promoting Low-Carbon Electricity Production - Issues in Science and Technology". www.Issues.org. Archived from the original on 27 September 2013. Retrieved 1 October 2017.
- "The U.S. Electric Power Sector and Climate Change Mitigation - Center for Climate and Energy Solutions". www.PewClimate.org. Archived from the original on 8 February 2012. Retrieved 1 October 2017.
- "Nuclear Power Contributes 21 Percent of Low Carbon Power Generation in 2016". ProQuest 1923971079. Cite journal requires
|journal=(help) - Weißbach, D. (2013). "Energy intensities, EROIs (energy returned on invested), and energy payback times of electricity generating power plants". Energy. 52: 210–221. doi:10.1016/j.energy.2013.01.029.
- "Energy intensities, EROIs, and energy payback times of electricity generating power plants. pg 2" (PDF). Festkoerper-Kernphysik.de. Retrieved 1 October 2017.
- "Energy intensities, EROIs, and energy payback times of electricity generating power plants. pg 29" (PDF). Festkoerper-Kernphysik.de. Retrieved 1 October 2017.
- Dailykos - GETTING TO ZERO: Is renewable energy economically viable? by Keith Pickering MON 8 July 2013 AT 04:30 AM PDT.
- Raugei, Marco (2013). "Comments on "Energy intensities, EROIs (energy returned on invested), and energy payback times of electricity generating power plants"—Making clear of quite some confusion". Energy. 59: 781–782. doi:10.1016/j.energy.2013.07.032.
- Weißbach, D. (2014). "Reply on "Comments on 'Energy intensities, EROIs (energy returned on invested), and energy payback times of electricity generating power plants' – Making clear of quite some confusion"". Energy. 68: 1004–1006. doi:10.1016/j.energy.2014.02.026.
- http://www.ipcc.ch/pdf/assessment-report/ar5/wg3/ipcc_wg3_ar5_chapter7.pdf
- International Energy Agency (2007). Renewables in global energy supply: An IEA facts sheet (PDF), OECD, p. 3.
- https://lowcarbonpower.org/type/hydro
- Duncan Graham-Rowe. Hydroelectric power's dirty secret revealed New Scientist, 24 February 2005.
- http://www.iea.org/publications/freepublications/publication/KeyWorld_Statistics_2015.pdf pg25
- "Archived copy" (PDF). Archived from the original (PDF) on 11 February 2014. Retrieved 17 August 2015.CS1 maint: archived copy as title (link) The European Strategic Energy Technology Plan SET-Plan Towards a low-carbon future 2010. Nuclear power provides "2/3 of the EU's low carbon energy" pg 6.
- "Assuring the Backbone of a Carbon-free Power System by 2050 -Call for a Timely and Just Assessment of Nuclear Energy" (PDF).
- "Live CO₂ emissions of electricity consumption". electricitymap.tmrow.co. Retrieved 14 May 2020.
- "PRIS - Home". www.IAEA.org. Retrieved 1 October 2017.
- Society, Author: Marion Bruenglinghaus, ENS, European Nuclear. "Nuclear power plants, world-wide". www.EuroNuclear.org. Archived from the original on 19 May 2013. Retrieved 1 October 2017.
- "China Nuclear Power - Chinese Nuclear Energy - World Nuclear Association". www.World-Nuclear.org. Retrieved 1 October 2017.
- "Nuclear Power in the USA". World Nuclear Association. June 2008. Retrieved 25 July 2008.
- Matthew L. Wald (7 December 2010). Nuclear ‘Renaissance’ Is Short on Largess The New York Times.
- Location of Projected New Nuclear Power Reactors
- "GWEC Global Wind Statistics 2011" (PDF). Global Wind Energy Commission. Retrieved 15 March 2012.
- Global Wind Statistics 2 July 2012
- "EU wind power capacity reaches 100GW". UPI. 1 October 2012. Retrieved 31 October 2012.
- "China's on-grid wind power capacity grows". China Daily. 16 August 2012. Retrieved 31 October 2012.
- "US Reaches 50 GW of Wind Energy Capacity in Q2 of 2012". Clean Technica. 10 August 2012. Retrieved 31 October 2012.
- "Global status overview". GWEC. Retrieved 31 October 2012.
- "World Wind Energy Report 2010" (PDF). Report. World Wind Energy Association. February 2011. Archived from the original (PDF) on 4 September 2011. Retrieved 8 August 2011.
- http://www.ren21.net/wp-content/uploads/2015/07/REN12-GSR2015_Onlinebook_low1.pdf pg31
- "Månedlig elforsyningsstatistik" (in Danish). summary tab B58-B72: Danish Energy Agency. 18 January 2012. Archived from the original on 3 March 2012. Retrieved 11 March 2012.CS1 maint: location (link)
- "Monthly Statistics – SEN". February 2012.
- "the Spanish electricity system: preliminary report 2011" (PDF). January 2012. p. 13. Archived from the original (PDF) on 13 May 2012.
- "Renewables". eirgrid.com. Archived from the original on 15 June 2009. Retrieved 22 November 2010.
- Bundesministerium für Wirtschaft und Technologie (February 2012). "Die Energiewende in Deutschland" (PDF) (in German). Berlin. p. 4.
- "Energy Sources: Solar". Department of Energy. Retrieved 19 April 2011.
- Geothermal Energy Association. Geothermal Energy: International Market Update May 2010, p. 4-6.
- Fridleifsson, Ingvar B.; Bertani, Ruggero; Huenges, Ernst; Lund, John W.; Ragnarsson, Arni; Rybach, Ladislaus (11 February 2008), O. Hohmeyer and T. Trittin (ed.), The possible role and contribution of geothermal energy to the mitigation of climate change (PDF), Luebeck, Germany, pp. 59–80, retrieved 6 April 2009
- Geothermal Energy Association. Geothermal Energy: International Market Update May 2010, p. 7.
- Rybach, Ladislaus (September 2007), "Geothermal Sustainability" (PDF), Geo-Heat Centre Quarterly Bulletin, Klamath Falls, Oregon: Oregon Institute of Technology, 28 (3), pp. 2–7, ISSN 0276-1084, retrieved 9 May 2009
- Bertani, Ruggero; Thain, Ian (July 2002), "Geothermal Power Generating Plant CO2 Emission Survey" (PDF), IGA News, International Geothermal Association (49): 1–3, retrieved 13 May 2009
- The National Energy Technology Laboratory Web site “Tracking New Coal Fired Power Plants”
- Climate Change 2007: The Physical Science Basis. Contribution of Working Group I to the Fourth Assessment Report of the Intergovernmental Panel on Climate Change. Intergovernmental Panel on Climate Change (2007-02-05). Retrieved on 2007-02-02. Archived 14 November 2007 at the Wayback Machine
- "Carbon Dioxide Information Analysis Center (CDIAC), the primary climate-change data and information analysis center of the U.S. Department of Energy (DOE)" (PDF). ORNL.gov. Retrieved 1 October 2017.
- "World Resources Institute; "Greenhouse Gases and Where They Come From"". WRI.org. Archived from the original on 14 July 2007. Retrieved 1 October 2017.
- "Energy Information Administration; "World Carbon Emissions by Region"". DOE.gov. Archived from the original on 14 March 2009. Retrieved 1 October 2017.
- "EIA - International Energy Outlook 2017". www.eia.DOE.gov. Retrieved 1 October 2017.
- "Prediction of energy consumption world-wide - Time for change". TimeForChange.org. Retrieved 1 October 2017.
- "Energy Information Administration; "World Market Energy Consumption by Region"". DOE.gov. Retrieved 1 October 2017.
- "Air source heat pumps". EnergySavingTrust.org.uk. Retrieved 1 October 2017.
- National Resources Defense Council Web site; "Hearing on Future Options for Generation of Electricity from Coal"
- Keith Johnson in Washington, Rebecca Smith in San Francisco and Kris Maher in Pittsburgh (28 March 2012). "EPA Proposes CO - WSJ". WSJ.
- "United Nations Environment Program Global Trends in Sustainable Energy Investment 2007". UNEP.org. Retrieved 1 October 2017.
