Nebraska's 3rd congressional district
Nebraska's 3rd congressional district is a congressional district in the U.S. state of Nebraska that encompasses its western three-fourths; it is one of the largest non-at-large districts in the country, covering nearly 65,000 square miles (170,000 km2), two time zones and 68 counties. It includes Grand Island, Kearney, Hastings, North Platte, Alliance, and Scottsbluff. Additionally, it encompasses the Sandhills region and a large majority of the Platte River.
| Nebraska's 3rd congressional district | |||
|---|---|---|---|
.tif.png.webp) Nebraska's 3rd congressional district since January 3, 2013 | |||
| Representative |
| ||
| Distribution |
| ||
| Population (2019) | 597,568 | ||
| Median household income | $55,729[1] | ||
| Ethnicity |
| ||
| Cook PVI | R+27[2] | ||
Nebraska has had at least three congressional districts since 1883. The district's current configuration dates from 1963, when Nebraska lost a seat as a result of the 1960 United States Census. At that time, most of the old 3rd and 4th districts were merged to form the new 3rd district. It is one of the most Republican districts in the nation, as Democrats have only come close to winning it three times as currently drawn, in 1974, 1990, and 2006, all years where the incumbent was not running for reelection. Republican presidential and gubernatorial candidates routinely carry the district with margins of 40 percent or more, while Franklin D. Roosevelt in 1936 was the last Democratic presidential candidate to win a plurality within the current district boundaries.
Excepting historically Democratic Saline County on the district's eastern boundary and Dakota County which has only been within the district since 2013, the last Democrat to carry any county within the district at a presidential level was Jimmy Carter in 1976. Although the Nebraska Legislature is elected on a nonpartisan basis, all but two members representing significant portions of the district are known to be Republicans. With a Cook Partisan Voting Index (CPVI) of R+27, it is the most Republican congressional district outside the Southern United States. It is currently held by Republican Adrian Smith, who was first elected in 2006. The previous U.S. Representative, Tom Osborne, did not seek reelection in order to wage an unsuccessful campaign for the Republican nomination for Governor of Nebraska.
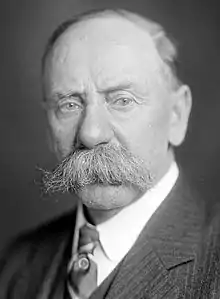
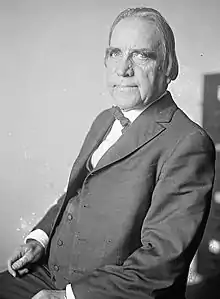
List of members representing the district
Recent election results
2004
| Party | Candidate | Votes | % | |
|---|---|---|---|---|
| Republican | Tom Osborne (Incumbent) | 218,751 | 87.5% | |
| Democratic | Donna J. Anderson | 26,434 | 10.5% | |
| Nebraska | Joseph A. Rosberg | 3,396 | 1.4% | |
| Green | Roy Guisinger | 1,555 | .6% | |
| Total votes | 250,136 | 100.0% | ||
| Republican hold | ||||
2006
| Party | Candidate | Votes | % | |
|---|---|---|---|---|
| Republican | Adrian Smith | 113,687 | 54.99% | |
| Democratic | Scott Kleeb | 93,046 | 45.01% | |
| Total votes | 206,733 | 100.0% | ||
| Republican hold | ||||
2008
| Party | Candidate | Votes | % | |
|---|---|---|---|---|
| Republican | Adrian Smith (Incumbent) | 183,117 | 76.87% | |
| Democratic | Jay C. Stoddard | 55,087 | 23.13% | |
| Total votes | 238,204 | 100.0% | ||
| Republican hold | ||||
2010
| Party | Candidate | Votes | % | |
|---|---|---|---|---|
| Republican | Adrian Smith (Incumbent) | 117,275 | 70.12% | |
| Democratic | Rebekah Davis | 29,932 | 17.9% | |
| Independent | Dan Hill | 20,036 | 11.98% | |
| Total votes | 167,243 | 100.0% | ||
| Republican hold | ||||
2012
| Party | Candidate | Votes | % | |
|---|---|---|---|---|
| Republican | Adrian Smith (Incumbent) | 187,423 | 74.2% | |
| Democratic | Mark Sullivan | 65,266 | 25.8% | |
| Total votes | 252,689 | 100.0% | ||
| Republican hold | ||||
2014
| Party | Candidate | Votes | % | |
|---|---|---|---|---|
| Republican | Adrian Smith (Incumbent) | 139,440 | 75.4% | |
| Democratic | Mark Sullivan | 45,524 | 24.6% | |
| Total votes | 184,964 | 100.0% | ||
| Republican hold | ||||
2016
| Party | Candidate | Votes | % | |
|---|---|---|---|---|
| Republican | Adrian Smith (Incumbent) | 226,720 | 100% | |
| Total votes | 226,720 | 100.0% | ||
| Republican hold | ||||
2018
| Party | Candidate | Votes | % | |
|---|---|---|---|---|
| Republican | Adrian Smith (Incumbent) | 163,650 | 76.7% | |
| Democratic | Paul Theobald | 49,654 | 23.3% | |
| Total votes | 213,304 | 100.0% | ||
| Republican hold | ||||
2020
| Party | Candidate | Votes | % | |
|---|---|---|---|---|
| Republican | Adrian Smith (Incumbent) | 225,157 | 78.5% | |
| Democratic | Mark Elworth Jr. | 50,690 | 17.7% | |
| Libertarian | Dustin C. Hobbs | 10,923 | 3.8% | |
| Total votes | 336,962 | 100.0% | ||
| Republican hold | ||||
Recent results in presidential elections
| Year | Office | Results |
|---|---|---|
| 2000 | President | George W. Bush 71% – Al Gore 25% |
| 2004 | President | George W. Bush 75% – John Kerry 24% |
| 2008 | President | John McCain 69% – Barack Obama 30% |
| 2012 | President | Mitt Romney 70% – Barack Obama 28% |
| 2016 | President | Donald Trump 74% – Hillary Clinton 20% |
| 2020 | President | Donald Trump 75% – Joe Biden 22% |
Historical district boundaries

References
- https://www.census.gov/mycd/?st=31&cd=03
- "Partisan Voting Index – Districts of the 115th Congress" (PDF). The Cook Political Report. April 7, 2017. Retrieved April 7, 2017.
- Martis, Kenneth C. (1989). The Historical Atlas of Political Parties in the United States Congress. New York: Macmillan Publishing Company.
- Martis, Kenneth C. (1982). The Historical Atlas of United States Congressional Districts. New York: Macmillan Publishing Company.
- Congressional Biographical Directory of the United States 1774–present
.jpg.webp)
.jpg.webp)

.jpg.webp)

.jpg.webp)
.jpg.webp)
.jpg.webp)
.jpg.webp)
.jpg.webp)

