Saline County, Nebraska
Saline County is a county in the U.S. state of Nebraska. As of the 2010 United States Census, the population was 14,200.[1] Its county seat is Wilber.[2]
Saline County | |
|---|---|
| County of Saline | |
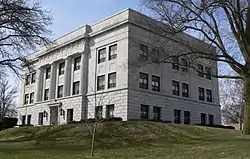 Saline County Courthouse in Wilber | |
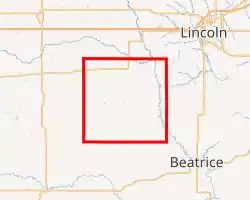
Interactive map of Saline County | |
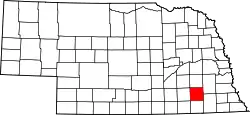 Location within the U.S. state of Nebraska | |
| Country | |
| State | |
| Established | March 16, 1855 |
| Organized | February 18, 1867 |
| County seat | Wilber |
| Largest city | Crete |
| Area | |
| • Total | 576 sq mi (1,490 km2) |
| • Land | 574 sq mi (1,490 km2) |
| • Water | 2.3 sq mi (6 km2) |
| Population | |
| • Estimate (2018) | 14,350 |
| • Density | 25.2/sq mi (9.7/km2) |
| Time zone | UTC−6 (Central) |
| • Summer (DST) | UTC−5 (CDT) |
| Area code | 402/531 |
| FIPS code | 31151 |
| GNIS feature ID | 835897 |
| Website | www.co.saline.ne.us |
In the Nebraska license plate system, Saline County is represented by the prefix 22 (it had the twenty-second-largest number of vehicles registered in the state when the license plate system was established in 1922).
History
Saline County was formed in 1855 and organized in 1867.[3][4] The first permanent settler arrived in 1858.[5]
Geography
The terrain of Saline County is composed of low rolling hills, sloping to the east-southeast.[6] Most of the county's area is devoted to agriculture. The Big Blue River flows southward in the eastern part of the county. The middle and southern parts of the county are drained by Swan Creek and Turkey Creek, which combine and discharge into Big Blue River at the county's east boundary line close to its SE corner.[7] The county has an area of 576 square miles (1,490 km2), of which 574 square miles (1,490 km2) is land and 2.3 square miles (6.0 km2) (0.4%) is water.[8]
Major highways
Adjacent counties
- Lancaster County – northeast
- Gage County – southeast
- Jefferson County – south
- Thayer County – southwest
- Fillmore County – west
- York County – northwest
- Seward County – north
Protected areas
- Willard Meyer Natural Resource District - Swan Lake[9]
Demographics
| Historical population | |||
|---|---|---|---|
| Census | Pop. | %± | |
| 1860 | 39 | — | |
| 1870 | 3,106 | 7,864.1% | |
| 1880 | 14,491 | 366.5% | |
| 1890 | 20,097 | 38.7% | |
| 1900 | 18,252 | −9.2% | |
| 1910 | 17,866 | −2.1% | |
| 1920 | 16,514 | −7.6% | |
| 1930 | 16,536 | 0.1% | |
| 1940 | 15,010 | −9.2% | |
| 1950 | 14,046 | −6.4% | |
| 1960 | 12,542 | −10.7% | |
| 1970 | 12,809 | 2.1% | |
| 1980 | 13,131 | 2.5% | |
| 1990 | 12,715 | −3.2% | |
| 2000 | 13,843 | 8.9% | |
| 2010 | 14,200 | 2.6% | |
| 2018 (est.) | 14,350 | [10] | 1.1% |
| US Decennial Census[11] 1790-1960[12] 1900-1990[13] 1990-2000[14] 2010-2013[1] | |||
As of the 2000 United States Census,[15] there were 13,843 people, 5,188 households, and 3,507 families in the county. The population density was 24 people per square mile (9/km2). There were 5,611 housing units at an average density of 10 per square mile (4/km2). The racial makeup of the county was 92.99% White, 0.36% Black or African American, 0.38% Native American, 1.70% Asian, 0.03% Pacific Islander, 3.40% from other races, and 1.15% from two or more races. 6.58% of the population were Hispanic or Latino of any race.
There were 5,188 households, out of which 32.80% had children under the age of 18 living with them, 56.50% were married couples living together, 7.20% had a female householder with no husband present, and 32.40% were non-families. 27.50% of all households were made up of individuals, and 14.30% had someone living alone who was 65 years of age or older. The average household size was 2.50 and the average family size was 3.04.
The county population contained 25.10% under the age of 18, 12.30% from 18 to 24, 25.00% from 25 to 44, 20.30% from 45 to 64, and 17.20% who were 65 years of age or older. The median age was 36 years. For every 100 females there were 97.80 males. For every 100 females age 18 and over, there were 95.10 males.
The median income for a household in the county was $35,914, and the median income for a family was $44,199. Males had a median income of $30,467 versus $22,690 for females. The per capita income for the county was $16,287. About 6.40% of families and 9.40% of the population were below the poverty line, including 8.90% of those under age 18 and 9.00% of those age 65 or over.
Communities
Villages
Unincorporated communities
Politics
Since 1972, Saline County has been a swing county in presidential elections, voting for the national winner in all elections since then aside from 1988, 2012, & 2020. It was formerly a strongly Democratic county, voting Republican only four times between 1900 and 1968.
| Year | Republican | Democratic | Third Parties |
|---|---|---|---|
| 2020 | 62.8% 3,631 | 34.4% 1,986 | 2.8% 163 |
| 2016 | 58.5% 3,004 | 33.7% 1,733 | 7.8% 399 |
| 2012 | 51.6% 2,557 | 46.2% 2,289 | 2.3% 112 |
| 2008 | 46.4% 2,434 | 50.9% 2,674 | 2.7% 143 |
| 2004 | 55.2% 3,071 | 43.5% 2,420 | 1.4% 75 |
| 2000 | 50.2% 2,581 | 45.1% 2,321 | 4.7% 243 |
| 1996 | 37.6% 1,945 | 48.8% 2,523 | 13.7% 707 |
| 1992 | 30.2% 1,740 | 42.1% 2,425 | 27.8% 1,600 |
| 1988 | 42.8% 2,355 | 56.7% 3,125 | 0.5% 29 |
| 1984 | 54.5% 2,942 | 44.2% 2,385 | 1.2% 67 |
| 1980 | 54.2% 2,934 | 35.2% 1,908 | 10.6% 574 |
| 1976 | 41.2% 2,330 | 56.6% 3,205 | 2.2% 127 |
| 1972 | 51.6% 2,828 | 48.4% 2,654 | |
| 1968 | 44.7% 2,341 | 48.6% 2,543 | 6.7% 350 |
| 1964 | 30.1% 1,780 | 69.9% 4,125 | |
| 1960 | 45.0% 2,881 | 55.0% 3,523 | |
| 1956 | 48.9% 3,248 | 51.1% 3,395 | |
| 1952 | 60.2% 4,221 | 39.8% 2,792 | |
| 1948 | 42.3% 2,641 | 57.7% 3,598 | |
| 1944 | 45.5% 3,255 | 54.5% 3,899 | |
| 1940 | 46.5% 3,673 | 53.5% 4,229 | |
| 1936 | 32.1% 2,637 | 66.8% 5,480 | 1.1% 89 |
| 1932 | 25.2% 1,993 | 73.9% 5,831 | 0.9% 72 |
| 1928 | 45.7% 3,347 | 54.0% 3,955 | 0.4% 26 |
| 1924 | 43.1% 2,834 | 47.5% 3,123 | 9.4% 619 |
| 1920 | 58.7% 3,197 | 39.9% 2,172 | 1.5% 80 |
| 1916 | 35.1% 1,469 | 63.2% 2,646 | 1.7% 70 |
| 1912 | 29.7% 1,185 | 48.7% 1,942 | 21.5% 858 |
| 1908 | 46.5% 2,048 | 51.0% 2,249 | 2.5% 109 |
| 1904 | 61.4% 2,390 | 28.5% 1,108 | 10.2% 396 |
| 1900 | 51.3% 2,238 | 46.3% 2,018 | 2.4% 106 |
References
- "State & County QuickFacts". United States Census Bureau. Retrieved September 22, 2013.
- "Find a County". National Association of Counties. Retrieved 7 June 2011.
- Fitzpatrick, Lilian Linder (1925). Nebraska Place-Names. Lincoln: University of Nebraska Studies in Language, Literature, and Criticism. p. 122. Retrieved December 17, 2014.
- "Saline County". Nebraska Association of County Officials. Retrieved December 17, 2014.
- Burr, George L. (1921). History of Hamilton and Clay Counties, Nebraska, Vol. 1. S.J. Clarke Publishing Co. p. 135.
- "Find an Altitude" Google Maps (accessed 28 January 2019)
- Saline County NE Google Maps (accessed 28 January 2019)
- "2010 Census Gazetteer Files". US Census Bureau. August 22, 2012. Archived from the original on November 13, 2013. Retrieved December 11, 2014.
- Willard Meyer Natural Resource District-Swan Lake Google Maps (accessed 28 January 2019)
- "Population and Housing Unit Estimates". Retrieved December 26, 2019.
- "US Decennial Census". US Census Bureau. Retrieved December 11, 2014.
- "Historical Census Browser". University of Virginia Library. Retrieved December 11, 2014.
- "Population of Counties by Decennial Census: 1900 to 1990". US Census Bureau. Retrieved December 11, 2014.
- "Census 2000 PHC-T-4. Ranking Tables for Counties: 1990 and 2000" (PDF). US Census Bureau. Retrieved December 11, 2014.
- "U.S. Census website". US Census Bureau. Retrieved 31 January 2008.
- Election Results
External links
Places adjacent to Saline County, Nebraska | ||||||||||
|---|---|---|---|---|---|---|---|---|---|---|
| ||||||||||
Municipalities and communities of Saline County, Nebraska, United States | ||
|---|---|---|
| Cities | Map of Nebraska highlighting Saline County | |
| Villages | ||
| Unincorporated communities | ||
| Footnotes | ‡This populated place also has portions in an adjacent county or counties | |
| ||
| Authority control |
|---|