Tehkummah
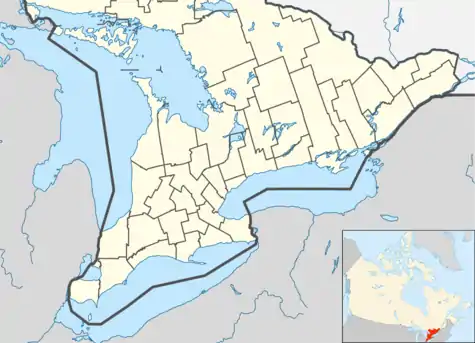
Tehkummah is a township in the Canadian province of Ontario, located on Manitoulin Island.
Tehkummah | |
|---|---|
| Township of Tehkummah | |
 The MS Chi-Cheemaun docking in South Baymouth | |
 Tehkummah | |
| Coordinates: 45°39′N 81°59′W | |
| Country | Canada |
| Province | Ontario |
| District | Manitoulin |
| Incorporated | 1881 |
| Government | |
| • Type | Township |
| • Reeve | David Jaggard |
| • MP | Carol Hughes (NDP) |
| • MPP | Michael Mantha (NDP) |
| Area | |
| • Land | 132.69 km2 (51.23 sq mi) |
| Population (2016)[1] | |
| • Total | 436 |
| • Density | 3.3/km2 (9/sq mi) |
| Time zone | UTC-5 (EST) |
| • Summer (DST) | UTC-4 (EDT) |
| Postal code | P0P 2C0 |
| Area code(s) | 705 |
Communities
The best known community in the township is South Baymouth, the northern docking point of the MS Chi-Cheemaun passenger-car ferry which traverses the Main Channel of Georgian Bay from the community of Tobermory on the Bruce Peninsula. At the dock, the provincial Highway 6, whose southern segment ends at Tobermory, resumes and continues northward to its terminus at Highway 17 north of Espanola.
The administrative centre of the township is the community of Tehkummah.
The township also includes the ghost towns of Michael's Bay and Snowville.
Demographics
| Canada census – Tehkummah community profile | |||
|---|---|---|---|
| 2016 | 2011 | 2006 | |
| Population: | 436 (+7.4% from 2011) | 406 (+6.3% from 2006) | 382 (+4.1% from 2001) |
| Land area: | 132.48 km2 (51.15 sq mi) | 132.48 km2 (51.15 sq mi) | 132.48 km2 (51.15 sq mi) |
| Population density: | 3.3/km2 (8.5/sq mi) | 3.1/km2 (8.0/sq mi) | 2.9/km2 (7.5/sq mi) |
| Median age: | 59.0 (M: 58.9, F: 59.2) | 54.0 (M: 52.8, F: 54.2) | |
| Total private dwellings: | 333 | 353 | 291 |
| Median household income: | $50,432 | $35,061 | |
| References: 2016[2] 2011[3] 2006[4] earlier[5] | |||
Climate
| Climate data for South Baymouth (1981−2010) | |||||||||||||
|---|---|---|---|---|---|---|---|---|---|---|---|---|---|
| Month | Jan | Feb | Mar | Apr | May | Jun | Jul | Aug | Sep | Oct | Nov | Dec | Year |
| Record high °C (°F) | 7.8 (46.0) |
8.0 (46.4) |
15.0 (59.0) |
24.5 (76.1) |
29.5 (85.1) |
30.0 (86.0) |
33.9 (93.0) |
32.5 (90.5) |
28.3 (82.9) |
23.9 (75.0) |
17.2 (63.0) |
14.0 (57.2) |
33.9 (93.0) |
| Average high °C (°F) | −3.2 (26.2) |
−2.4 (27.7) |
1.5 (34.7) |
8.2 (46.8) |
14.6 (58.3) |
19.3 (66.7) |
23.3 (73.9) |
22.5 (72.5) |
17.4 (63.3) |
11.3 (52.3) |
5.3 (41.5) |
−0.4 (31.3) |
9.8 (49.6) |
| Daily mean °C (°F) | −7.9 (17.8) |
−7.2 (19.0) |
−3.3 (26.1) |
3.8 (38.8) |
9.7 (49.5) |
14.2 (57.6) |
18.2 (64.8) |
17.9 (64.2) |
13.5 (56.3) |
7.7 (45.9) |
2.1 (35.8) |
−4.2 (24.4) |
5.4 (41.7) |
| Average low °C (°F) | −12.5 (9.5) |
−12 (10) |
−8 (18) |
−0.7 (30.7) |
4.8 (40.6) |
9.0 (48.2) |
13.1 (55.6) |
13.3 (55.9) |
9.5 (49.1) |
4.0 (39.2) |
−1 (30) |
−7.9 (17.8) |
1.0 (33.8) |
| Record low °C (°F) | −37 (−35) |
−36.5 (−33.7) |
−31.1 (−24.0) |
−19.5 (−3.1) |
−4.4 (24.1) |
0.0 (32.0) |
4.4 (39.9) |
−0.6 (30.9) |
−3.5 (25.7) |
−8.3 (17.1) |
−19 (−2) |
−33 (−27) |
−37 (−35) |
| Average precipitation mm (inches) | 78.1 (3.07) |
49.8 (1.96) |
63.9 (2.52) |
69.2 (2.72) |
71.6 (2.82) |
58.6 (2.31) |
50.9 (2.00) |
74.2 (2.92) |
95.2 (3.75) |
112.0 (4.41) |
92.2 (3.63) |
94.0 (3.70) |
909.6 (35.81) |
| Average rainfall mm (inches) | 13.1 (0.52) |
6.5 (0.26) |
38.0 (1.50) |
57.9 (2.28) |
71.6 (2.82) |
58.6 (2.31) |
50.9 (2.00) |
74.2 (2.92) |
95.2 (3.75) |
111.9 (4.41) |
73.6 (2.90) |
29.6 (1.17) |
681.1 (26.81) |
| Average snowfall cm (inches) | 65.0 (25.6) |
43.3 (17.0) |
25.9 (10.2) |
11.3 (4.4) |
0.0 (0.0) |
0.0 (0.0) |
0.0 (0.0) |
0.0 (0.0) |
0.0 (0.0) |
0.08 (0.03) |
18.5 (7.3) |
64.5 (25.4) |
228.4 (89.9) |
| Average precipitation days (≥ 0.2 mm) | 15.9 | 11.2 | 10.5 | 12.1 | 11.2 | 10.2 | 7.9 | 10.6 | 12.9 | 14.9 | 14.1 | 17.4 | 148.9 |
| Average rainy days (≥ 0.2 mm) | 2.7 | 1.9 | 5.6 | 10.2 | 11.2 | 10.2 | 7.9 | 10.6 | 12.9 | 14.9 | 10.6 | 5.9 | 104.5 |
| Average snowy days (≥ 0.2 cm) | 13.5 | 9.7 | 5.6 | 2.5 | 0.0 | 0.0 | 0.0 | 0.0 | 0.0 | 0.08 | 3.8 | 12.8 | 48.1 |
| Mean monthly sunshine hours | 74.3 | 97.5 | 162.8 | 190.8 | 242.9 | 264.6 | 307.1 | 256.2 | 187.8 | 127.9 | 70.4 | 57.5 | 2,039.8 |
| Percent possible sunshine | 26.2 | 33.4 | 44.2 | 47.1 | 52.6 | 56.4 | 64.7 | 58.6 | 49.8 | 37.6 | 24.6 | 21.1 | 43.0 |
| Source: Environment Canada[6] | |||||||||||||
See also
References
- "Tehkummah Census profile". 2016 Census of Population. Statistics Canada. Retrieved 2012-02-22.
- "2016 Community Profiles". 2016 Canadian Census. Statistics Canada. February 21, 2017. Retrieved 2019-06-20.
- "2011 Community Profiles". 2011 Canadian Census. Statistics Canada. July 5, 2013. Retrieved 2012-02-22.
- "2006 Community Profiles". 2006 Canadian Census. Statistics Canada. March 30, 2011. Retrieved 2012-02-22.
- "2001 Community Profiles". 2001 Canadian Census. Statistics Canada. February 17, 2012.
- "South Baymouth, Ontario". Canadian Climate Normals 1981–2010. Environment Canada. Retrieved February 16, 2015.
External links
Places adjacent to Tehkummah | |
|---|---|
This article is issued from Wikipedia. The text is licensed under Creative Commons - Attribution - Sharealike. Additional terms may apply for the media files.
