List of municipalities in Ontario
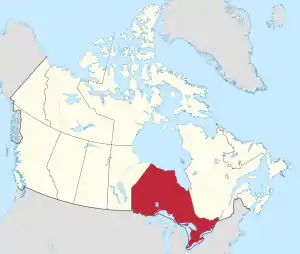
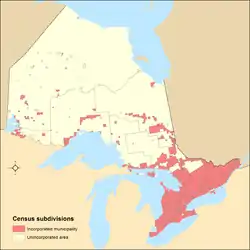
Ontario is the most populous province in Canada with 13,448,494 residents as of 2016 and is third-largest in land area[lower-alpha 1] at 908,699 km2 (350,851 sq mi).[2] Ontario's 444 municipalities[3] cover only 17% of the province's land mass yet are home to 99% of its population.[4] These municipalities provide local or regional municipal government services within either a single-tier or shared two-tier municipal structure.[5]
A municipality in Ontario is "a geographic area whose inhabitants are incorporated" according to the Municipal Act, 2001.[6] Ontario's three municipality types include upper and lower-tier municipalities within the two-tier structure, and single-tier municipalities (unitary authorities) that are exempt from the two-tier structure.[5] Single and lower-tier municipalities are grouped together as local municipalities.[6] Of Ontario's 444 municipalities, 30 of them are upper-tier municipalities and 414 are local municipalities—241 lower-tier municipalities and 173 single-tier municipalities.
The Municipal Act, 2001 is the legislation that enables incorporation and stipulates governance of Ontario's municipalities, excluding the City of Toronto, which is subject to the City of Toronto Act, 2006.[7] The Municipal Act, 2001 provides lower and single-tier municipalities with the authority to incorporate as cities, towns, villages, townships, or generically as municipalities.[5][8] There are no minimum population thresholds or other requirements for these municipal sub-types. A municipality can change its status to any of these so long as its resulting name is not being used by another municipality.[9] For upper-tier municipalities, the act provides them with the authority to incorporate as counties, regions and district municipalities.[5][8]
Ontario's largest municipality by population is the City of Toronto with 2,731,571 residents, while the largest by land area is the City of Greater Sudbury at 3,228.35 km2 (1,246.47 sq mi).[4] The City of Ottawa, Canada's capital city, is the province's second-most populous municipality with 934,243 residents.[4] Ontario's smallest municipality by population is the Township of Cockburn Island with 0 residents,[lower-alpha 2] while the smallest by land area is the Village of Westport at 1.68 km2 (0.65 sq mi).[4] The first community to incorporate as a municipality in Ontario was Brockville in 1832.[11]
Upper-tier municipalities
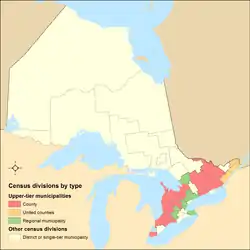
Ontario's Municipal Act, 2001 defines upper-municipality as "a municipality of which two or more lower-tier municipalities form part for municipal purposes".[6] Ontario has 30 upper-tier municipalities that comprise multiple lower-tier municipalities,[8] which have a total population of 6,622,900, a total land area of 87,449.74 km2 (33,764.53 sq mi). These upper-tier municipalities include 19 counties, 3 united counties and 8 regional municipalities[lower-alpha 3] or regions, all of which represent 30 of Ontario's 49 census divisions.[6][12] Regional governments are responsible for arterial roads, health services, policing, region-wide land use planning and development, sewer and water systems, social services, transit, and waste disposal, whereas county governments have the lesser responsibilities of arterial roads, county land use planning, health services, and social services.[8]
| Name[13] | Municipal sub-type[6] |
2016 Census of Population[12] | ||||
|---|---|---|---|---|---|---|
| Population (2016) |
Population (2011) |
Change | Land area (km²) |
Population density | ||
| Bruce[lower-alpha 4] | County | 66,491 | 64,709 | +2.8% | 3984.82 | 16.7/km2 |
| Dufferin | County | 61,735 | 56,881 | +8.5% | 1,486.44 | 41.5/km2 |
| Durham[lower-alpha 5] | Regional municipality | 645,731 | 608,031 | +6.2% | 2521.23 | 256.1/km2 |
| Elgin[lower-alpha 6] | County | 50,069 | 49,556 | +1.0% | 1,845.4 | 27.1/km2 |
| Essex[lower-alpha 7] | County | 181,530 | 177,720 | +2.1% | 1,662.73 | 109.2/km2 |
| Frontenac[lower-alpha 8] | County | 26,677 | 26,390 | +1.1% | 3,336.57 | 8.0/km2 |
| Grey | County | 93,830 | 92,568 | +1.4% | 4,513.50 | 20.8/km2 |
| Haliburton | County | 18,062 | 17,056 | +5.9% | 4,076.08 | 4.4/km2 |
| Halton | Regional municipality | 548,435 | 501,674 | +9.3% | 964.05 | 568.9/km2 |
| Hastings[lower-alpha 9] | County | 39,628 | 39,888 | −0.7% | 5,291.59 | 7.5/km2 |
| Huron | County | 59,297 | 59,100 | +0.3% | 3,399.27 | 17.4/km2 |
| Lambton[lower-alpha 10] | County | 123,399 | 124,623 | −1.0% | 2,842.94 | 43.4/km2 |
| Lanark[lower-alpha 11] | County | 59,918 | 56,689 | +5.7% | 3,025.98 | 19.8/km2 |
| Leeds and Grenville[lower-alpha 12] | United counties | 69,819 | 67,958 | +2.7% | 3,350.08 | 20.8/km2 |
| Lennox and Addington | County | 42,888 | 41,809 | +2.6% | 2,839.68 | 15.1/km2 |
| Middlesex[lower-alpha 13] | County | 71,551 | 70,796 | +1.1% | 2,821.02 | 25.4/km2 |
| Muskoka[lower-alpha 14] | Regional municipality[lower-alpha 3] | 60,391 | 57,807 | +4.5% | 3,877.38 | 15.6/km2 |
| Niagara | Regional municipality | 447,888 | 431,346 | +3.8% | 1,854.23 | 241.5/km2 |
| Northumberland[lower-alpha 15] | County | 85,103 | 81,657 | +4.2% | 1,892.56 | 45.0/km2 |
| Oxford | Regional municipality[lower-alpha 3] | 110,862 | 105,719 | +4.9% | 2,039.61 | 54.4/km2 |
| Peel | Regional municipality | 1,381,739 | 1,296,809 | +6.5% | 1,246.95 | 1,108.1/km2 |
| Perth[lower-alpha 16] | County | 38,066 | 37,554 | +1.4% | 2,177.79 | 17.5/km2 |
| Peterborough[lower-alpha 17] | County | 55,783 | 54,786 | +1.8% | 3,769.18 | 14.8/km2 |
| Prescott and Russell | United counties | 89,333 | 85,381 | +4.6% | 2,004.47 | 44.6/km2 |
| Renfrew[lower-alpha 18] | County | 88,072 | 86,534 | +1.8% | 7,426.2 | 11.9/km2 |
| Simcoe[lower-alpha 19] | County | 305,516 | 277,262 | +10.2% | 4,273.69 | 71.5/km2 |
| Stormont, Dundas and Glengarry[lower-alpha 20] | United counties | 65,353 | 64,824 | +0.8% | 3,236.45 | 20.2/km2 |
| Waterloo | Regional municipality | 535,154 | 507,096 | +5.5% | 1,368.92 | 390.9/km2 |
| Wellington[lower-alpha 21] | County | 90,932 | 86,672 | +4.9% | 2,573.35 | 35.3/km2 |
| York[lower-alpha 22] | Regional municipality | 1,109,648 | 1,032,249 | +7.5% | 1,747.58 | 635.0/km2 |
| Total upper-tier municipalities | 6,622,900 | 6,261,144 | +5.8% | 87,449.74 | 75.7/km2 | |
| Province of Ontario | 13,448,494 | 12,851,821 | +4.6% | 908,699.33 | 14.8/km2 | |
Local municipalities
Ontario's Municipal Act, 2001 defines local municipality as "a single-tier municipality or a lower-tier municipality".[6] Combined, Ontario has 414 local municipalities comprising 173 single-tier municipalities and 241 lower-tier municipalities. The 414 local municipalities have a total population of 13,357,197, a total land area of 155,673 km2 (60,106 sq mi). These totals represent 99.3% of Ontario's population and 17.1% of its land area.
Single-tier municipalities
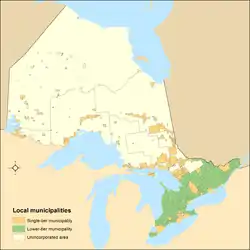
Ontario's Municipal Act, 2001 defines a single-tier municipality as "a municipality, other than an upper-tier municipality, that does not form part of an upper-tier municipality for municipal purposes".[6] In southern Ontario, single-tier municipalities are either politically separate from but geographically within neighbouring counties or were formed through the amalgamation of upper-tier and lower-tier municipalities. All municipalities in northern Ontario are single-tier municipalities as upper-tier municipalities are not present. Single-tier municipalities provide for all local government services.[8] Ontario has 173 single-tier municipalities comprising 32 cities, 23 municipalities, 28 towns, 85 townships, and 5 villages.
Lower-tier municipalities
Ontario's Municipal Act, 2001 defines a lower-tier municipality as "a municipality that forms part of an upper-tier municipality for municipal purposes".[6] Ontario has 241 lower-tier municipalities comprising 19 cities, 41 municipalities, 61 towns, 114 townships and 6 villages.[8] Within regions, they are responsible for providing certain local services that are not provided by the regional municipality.[8] Within counties, they are responsible for providing a wider range of local services since counties as upper-tier municipalities provide fewer local services than regions.[8]
List of local municipalities
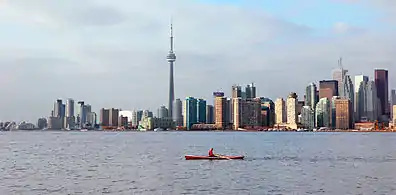 Toronto is Ontario's capital and most populous municipality.
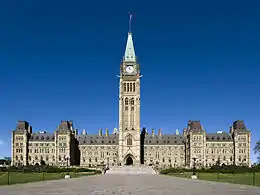
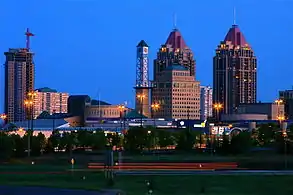 Skyline of Mississauga, Ontario's third largest municipality by population and suburb of Toronto
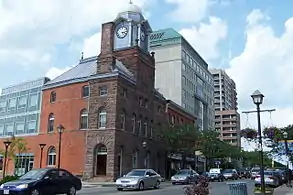 Downtown Brampton, Ontario's fourth largest municipality by population and suburb of Toronto
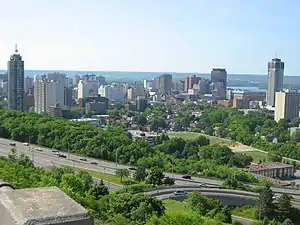 Skyline of downtown Hamilton
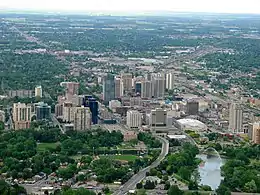 Skyline of downtown London, Ontario, the largest city in southwestern Ontario by population
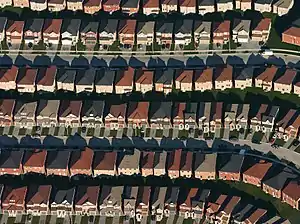 Suburban tract housing in Markham, Ontario's seventh largest municipality by population and suburb of Toronto
.jpg.webp) Vaughan as viewed from Canada's Wonderland
Vaughan as viewed from Canada's Wonderland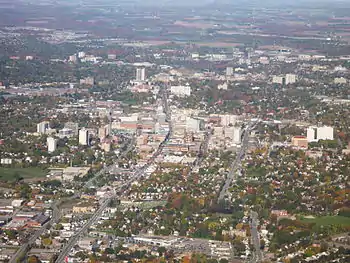 Downtown of Kitchener
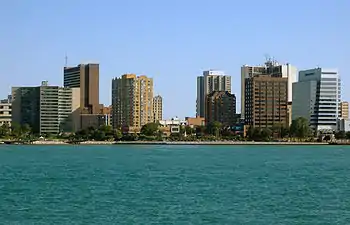 Skyline of downtown Windsor seen from Detroit, Michigan
| Name[13] | Municipal status[13] |
Census subdivision type[4] |
Census division[33][34][35] |
2016 Census of Population[4] | ||||
|---|---|---|---|---|---|---|---|---|
| Population (2016) |
Population (2011) |
Change | Land area (km²) |
Population density | ||||
| Addington Highlands | Lower-tier | Township | Lennox and Addington | 2,323 | 2,517 | −7.7% | 1,328.32 | 1.7/km2 |
| Adelaide-Metcalfe | Lower-tier | Township | Middlesex | 2,990 | 3,028 | −1.3% | 331.46 | 9.0/km2 |
| Adjala-Tosorontio | Lower-tier | Township | Simcoe | 10,975 | 10,603 | +3.5% | 372.34 | 29.5/km2 |
| Admaston/Bromley | Lower-tier | Township | Renfrew | 2,935 | 2,844 | +3.2% | 524.06 | 5.6/km2 |
| Ajax | Lower-tier | Town | Durham | 119,677 | 109,600 | +9.2% | 67.00 | 1,786.2/km2 |
| Alberton | Single-tier | Township | Rainy River | 969 | 864 | +12.2% | 116.66 | 8.3/km2 |
| Alfred and Plantagenet | Lower-tier | Township | Prescott and Russell | 9,680 | 9,196 | +5.3% | 392.31 | 24.7/km2 |
| Algonquin Highlands | Lower-tier | Township | Haliburton | 2,351 | 2,186 | +7.5% | 1,007.20 | 2.3/km2 |
| Alnwick/Haldimand | Lower-tier | Township | Northumberland | 6,869 | 6,617 | +3.8% | 398.45 | 17.2/km2 |
| Amaranth | Lower-tier | Township | Dufferin | 4,079 | 3,963 | +2.9% | 264.58 | 15.4/km2 |
| Amherstburg | Lower-tier | Town | Essex | 21,936 | 21,556 | +1.8% | 185.61 | 118.2/km2 |
| The Archipelago | Single-tier | Township | Parry Sound | 531 | 566 | −6.2% | 606.14 | 0.9/km2 |
| Armour | Single-tier | Township | Parry Sound | 1,414 | 1,372 | +3.1% | 164.64 | 8.6/km2 |
| Armstrong | Single-tier | Township | Timiskaming | 1,166 | 1,216 | −4.1% | 90.20 | 12.9/km2 |
| Arnprior | Lower-tier | Town | Renfrew | 8,795 | 8,114 | +8.4% | 13.07 | 672.9/km2 |
| Arran-Elderslie | Lower-tier | Municipality | Bruce | 6,803 | 6,810 | −0.1% | 460.07 | 14.8/km2 |
| Ashfield-Colborne-Wawanosh | Lower-tier | Township | Huron | 5,422 | 5,582 | −2.9% | 586.97 | 9.2/km2 |
| Asphodel-Norwood | Lower-tier | Township | Peterborough | 4,109 | 4,041 | +1.7% | 161.02 | 25.5/km2 |
| Assiginack | Single-tier | Township | Manitoulin | 1,013 | 960 | +5.5% | 226.72 | 4.5/km2 |
| Athens | Lower-tier | Township | Leeds and Grenville | 3,013 | 3,118 | −3.4% | 127.88 | 23.6/km2 |
| Atikokan | Single-tier | Town | Rainy River | 2,753 | 2,787 | −1.2% | 319.52 | 8.6/km2 |
| Augusta | Lower-tier | Township | Leeds and Grenville | 7,353 | 7,430 | −1.0% | 314.66 | 23.4/km2 |
| Aurora | Lower-tier | Town | York | 55,445 | 53,203 | +4.2% | 49.85 | 1,112.2/km2 |
| Aylmer | Lower-tier | Town | Elgin | 7,492 | 7,151 | +4.8% | 6.26 | 1,196.8/km2 |
| Baldwin | Single-tier | Township | Sudbury | 605[36] | 551 | +9.8% | 83.20 | 7.3/km2 |
| Bancroft | Lower-tier | Town | Hastings | 3,881 | 3,880 | 0.0% | 229.51 | 16.9/km2 |
| Barrie | Single-tier | City | Simcoe | 141,434 | 136,063 | +3.9% | 99.04 | 1,428.0/km2 |
| Bayham | Lower-tier | Municipality | Elgin | 7,396 | 6,989 | +5.8% | 244.97 | 30.2/km2 |
| Beckwith | Lower-tier | Township | Lanark | 7,644 | 6,986 | +9.4% | 240.47 | 31.8/km2 |
| Belleville | Single-tier | City | Hastings | 50,716 | 49,454 | +2.6% | 247.25 | 205.1/km2 |
| Billings | Single-tier | Township | Manitoulin | 603 | 506 | +19.2% | 209.64 | 2.9/km2 |
| Black River-Matheson | Single-tier | Township | Cochrane | 2,438 | 2,410 | +1.2% | 1,163.45 | 2.1/km2 |
| Blandford-Blenheim | Lower-tier | Township | Oxford | 7,399 | 7,359 | +0.5% | 382.33 | 19.4/km2 |
| Blind River | Single-tier | Town | Algoma | 3,472 | 3,549 | −2.2% | 525.65 | 6.6/km2 |
| The Blue Mountains | Lower-tier | Town | Grey | 7,025 | 6,453 | +8.9% | 287.24 | 24.5/km2 |
| Bluewater | Lower-tier | Municipality | Huron | 7,136 | 7,044 | +1.3% | 417.00 | 17.1/km2 |
| Bonfield | Single-tier | Township | Nipissing | 1,975 | 2,016 | −2.0% | 208.38 | 9.5/km2 |
| Bonnechere Valley | Lower-tier | Township | Renfrew | 3,674 | 3,763 | −2.4% | 593.75 | 6.2/km2 |
| Bracebridge | Lower-tier | Town | Muskoka | 16,010 | 15,414 | +3.9% | 628.22 | 25.5/km2 |
| Bradford West Gwillimbury | Lower-tier | Town | Simcoe | 35,325 | 28,077 | +25.8% | 201.04 | 175.7/km2 |
| Brampton | Lower-tier | City | Peel | 593,638 | 523,906 | +13.3% | 266.36 | 2,228.7/km2 |
| Brant | Single-tier | City | Brant | 36,707 | 35,638 | +3.0% | 843.25 | 43.5/km2 |
| Brantford | Single-tier | City | Brant | 97,496 | 93,650 | +4.1% | 72.44 | 1,345.9/km2 |
| Brethour | Single-tier | Township | Timiskaming | 97 | 129 | −24.8% | 82.08 | 1.2/km2 |
| Brighton | Lower-tier | Municipality | Northumberland | 11,844 | 10,928 | +8.4% | 222.71 | 53.2/km2 |
| Brock | Lower-tier | Township | Durham | 11,642 | 11,341 | +2.7% | 423.34 | 27.5/km2 |
| Brockton | Lower-tier | Municipality | Bruce | 9,461 | 9,432 | +0.3% | 565.18 | 16.7/km2 |
| Brockville | Single-tier | City | Leeds and Grenville | 21,346 | 21,870 | −2.4% | 20.85 | 1,023.8/km2 |
| Brooke-Alvinston | Lower-tier | Municipality | Lambton | 2,411 | 2,548 | −5.4% | 311.31 | 7.7/km2 |
| Bruce Mines | Single-tier | Town | Algoma | 582 | 566 | +2.8% | 6.22 | 93.6/km2 |
| Brudenell, Lyndoch and Raglan | Lower-tier | Township | Renfrew | 1,503 | 1,658 | −9.3% | 706.24 | 2.1/km2 |
| Burk's Falls | Single-tier | Village | Parry Sound | 981 | 967 | +1.4% | 3.07 | 319.5/km2 |
| Burlington | Lower-tier | City | Halton | 183,314 | 175,779 | +4.3% | 185.66 | 987.4/km2 |
| Burpee and Mills | Single-tier | Township | Manitoulin | 343 | 308 | +11.4% | 218.49 | 1.6/km2 |
| Caledon | Lower-tier | Town | Peel | 66,502 | 59,460 | +11.8% | 688.16 | 96.6/km2 |
| Callander | Single-tier | Municipality | Parry Sound | 3,863 | 3,864 | 0.0% | 105.98 | 36.5/km2 |
| Calvin | Single-tier | Municipality | Nipissing | 516 | 568 | −9.2% | 140.98 | 3.7/km2 |
| Cambridge | Lower-tier | City | Waterloo | 129,920 | 126,748 | +2.5% | 113.01 | 1,149.6/km2 |
| Carleton Place | Lower-tier | Town | Lanark | 10,644 | 9,809 | +8.5% | 9.05 | 1,176.1/km2 |
| Carling | Single-tier | Township | Parry Sound | 1,125 | 1,248 | −9.9% | 248.85 | 4.5/km2 |
| Carlow/Mayo | Lower-tier | Township | Hastings | 864 | 892 | −3.1% | 390.79 | 2.2/km2 |
| Casey | Single-tier | Township | Timiskaming | 368 | 374 | −1.6% | 80.86 | 4.6/km2 |
| Casselman | Lower-tier | Village | Prescott and Russell | 3,548 | 3,626 | −2.2% | 5.12 | 693.0/km2 |
| Cavan-Monaghan | Lower-tier | Township | Peterborough | 8,829 | 8,601 | +2.7% | 306.33 | 28.8/km2 |
| Central Elgin | Lower-tier | Municipality | Elgin | 12,607 | 12,743 | −1.1% | 280.33 | 45.0/km2 |
| Central Frontenac | Lower-tier | Township | Frontenac | 4,373 | 4,556 | −4.0% | 1,025.20 | 4.3/km2 |
| Central Huron | Lower-tier | Municipality | Huron | 7,576 | 7,586 | −0.1% | 449.58 | 16.9/km2 |
| Central Manitoulin | Single-tier | Municipality | Manitoulin | 2,084 | 1,958 | +6.4% | 431.11 | 4.8/km2 |
| Centre Hastings | Lower-tier | Municipality | Hastings | 4,774 | 4,574 | +4.4% | 222.86 | 21.4/km2 |
| Centre Wellington | Lower-tier | Township | Wellington | 28,191 | 26,693 | +5.6% | 407.54 | 69.2/km2 |
| Chamberlain | Single-tier | Township | Timiskaming | 332 | 297 | +11.8% | 110.59 | 3.0/km2 |
| Champlain | Lower-tier | Township | Prescott and Russell | 8,706 | 8,573 | +1.6% | 207.27 | 42.0/km2 |
| Chapleau | Single-tier | Township | Sudbury | 1,964 | 2,116 | −7.2% | 14.22 | 138.1/km2 |
| Chapple | Single-tier | Township | Rainy River | 638 | 741 | −13.9% | 527.94 | 1.2/km2 |
| Charlton and Dack | Single-tier | Municipality | Timiskaming | 686 | 671 | +2.2% | 92.72 | 7.4/km2 |
| Chatham-Kent | Single-tier | Municipality | Chatham-Kent | 101,647 | 103,671 | −2.0% | 2,457.90 | 41.4/km2 |
| Chatsworth | Lower-tier | Township | Grey | 6,630 | 6,437 | +3.0% | 596.19 | 11.1/km2 |
| Chisholm | Single-tier | Township | Nipissing | 1,291 | 1,263 | +2.2% | 206.73 | 6.2/km2 |
| Clarence-Rockland | Lower-tier | City | Prescott and Russell | 24,512 | 23,185 | +5.7% | 297.71 | 82.3/km2 |
| Clarington | Lower-tier | Municipality | Durham | 92,013 | 84,548 | +8.8% | 611.40 | 150.5/km2 |
| Clearview | Lower-tier | Township | Simcoe | 14,151 | 13,734 | +3.0% | 557.10 | 25.4/km2 |
| Cobalt | Single-tier | Town | Timiskaming | 1,128 | 1,133 | −0.4% | 2.08 | 542.3/km2 |
| Cobourg | Lower-tier | Town | Northumberland | 19,440 | 18,519 | +5.0% | 22.36 | 869.4/km2 |
| Cochrane | Single-tier | Town | Cochrane | 5,321 | 5,340 | −0.4% | 539.12 | 9.9/km2 |
| Cockburn Island | Single-tier | Township | Manitoulin | 0 | 0[lower-alpha 2] | NA | 171.04 | 0.0/km2 |
| Coleman | Single-tier | Township | Timiskaming | 595 | 597 | −0.3% | 178.89 | 3.3/km2 |
| Collingwood | Lower-tier | Town | Simcoe | 21,793 | 19,241 | +13.3% | 33.78 | 645.1/km2 |
| Conmee | Single-tier | Township | Thunder Bay | 819 | 764 | +7.2% | 169.13 | 4.8/km2 |
| Cornwall | Single-tier | City | Stormont, Dundas and Glengarry | 46,589 | 46,340 | +0.5% | 61.56 | 756.8/km2 |
| Cramahe | Lower-tier | Township | Northumberland | 6,355 | 6,073 | +4.6% | 202.16 | 31.4/km2 |
| Dawn-Euphemia | Lower-tier | Township | Lambton | 1,967 | 2,049 | −4.0% | 445.12 | 4.4/km2 |
| Dawson | Single-tier | Township | Rainy River | 468 | 563 | −16.9% | 339.50 | 1.4/km2 |
| Deep River | Lower-tier | Town | Renfrew | 4,109 | 4,193 | −2.0% | 50.13 | 82.0/km2 |
| Deseronto | Lower-tier | Town | Hastings | 1,774 | 1,835 | −3.3% | 2.51 | 706.8/km2 |
| Dorion | Single-tier | Township | Thunder Bay | 316 | 338 | −6.5% | 212.11 | 1.5/km2 |
| Douro-Dummer | Lower-tier | Township | Peterborough | 6,709 | 6,805 | −1.4% | 458.95 | 14.6/km2 |
| Drummond/North Elmsley | Lower-tier | Township | Lanark | 7,773 | 7,487 | +3.8% | 366.13 | 21.2/km2 |
| Dryden | Single-tier | City | Kenora | 7,749 | 7,617 | +1.7% | 66.19 | 117.1/km2 |
| Dubreuilville | Single-tier | Township | Algoma | 613 | 635 | −3.5% | 89.50 | 6.8/km2 |
| Dutton/Dunwich | Lower-tier | Municipality | Elgin | 3,866 | 3,876 | −0.3% | 294.58 | 13.1/km2 |
| Dysart, Dudley, Harcourt, Guilford, Harburn, Bruton, Havelock, Eyre and Clyde | Lower-tier | Municipality | Haliburton | 6,280 | 5,966 | +5.3% | 1,485.98 | 4.2/km2 |
| Ear Falls | Single-tier | Township | Kenora | 995 | 1,026 | −3.0% | 330.96 | 3.0/km2 |
| East Ferris | Single-tier | Municipality | Nipissing | 4,750 | 4,766 | −0.3% | 155.17 | 30.6/km2 |
| East Garafraxa | Lower-tier | Township | Dufferin | 2,579 | 2,595 | −0.6% | 166.07 | 15.5/km2 |
| East Gwillimbury | Lower-tier | Town | York | 23,991 | 22,473 | +6.8% | 245.04 | 97.9/km2 |
| East Hawkesbury | Lower-tier | Township | Prescott and Russell | 3,296 | 3,335 | −1.2% | 235.01 | 14.0/km2 |
| East Zorra-Tavistock | Lower-tier | Township | Oxford | 7,129 | 6,836 | +4.3% | 242.30 | 29.4/km2 |
| Edwardsburgh/Cardinal | Lower-tier | Township | Leeds and Grenville | 7,093 | 6,959 | +1.9% | 311.25 | 22.8/km2 |
| Elizabethtown-Kitley | Lower-tier | Township | Leeds and Grenville | 9,854 | 9,724 | +1.3% | 557.71 | 17.7/km2 |
| Elliot Lake | Single-tier | City | Algoma | 10,741 | 11,348 | −5.3% | 714.65 | 15.0/km2 |
| Emo | Single-tier | Township | Rainy River | 1,333 | 1,252 | +6.5% | 203.09 | 6.6/km2 |
| Englehart | Single-tier | Town | Timiskaming | 1,479 | 1,519 | −2.6% | 3.02 | 489.7/km2 |
| Enniskillen | Lower-tier | Township | Lambton | 2,796 | 2,930 | −4.6% | 338.16 | 8.3/km2 |
| Erin | Lower-tier | Town | Wellington | 11,439 | 10,770 | +6.2% | 297.76 | 38.4/km2 |
| Espanola | Single-tier | Town | Sudbury | 5,048[36] | 5,364 | −5.9% | 82.82 | 61.0/km2 |
| Essa | Lower-tier | Township | Simcoe | 21,083 | 18,505 | +13.9% | 280.03 | 75.3/km2 |
| Essex | Lower-tier | Town | Essex | 20,427 | 19,600 | +4.2% | 277.97 | 73.5/km2 |
| Evanturel | Single-tier | Township | Timiskaming | 449 | 452 | −0.7% | 89.31 | 5.0/km2 |
| Faraday | Lower-tier | Township | Hastings | 1,401 | 1,468 | −4.6% | 219.62 | 6.4/km2 |
| Fauquier-Strickland | Single-tier | Township | Cochrane | 536 | 530 | +1.1% | 1,013.25 | 0.5/km2 |
| Fort Erie | Lower-tier | Town | Niagara | 30,710 | 29,960 | +2.5% | 166.27 | 184.7/km2 |
| Fort Frances | Single-tier | Town | Rainy River | 7,739 | 7,952 | −2.7% | 25.51 | 303.4/km2 |
| French River | Single-tier | Municipality | Sudbury | 2,662 | 2,442 | +9.0% | 735.48 | 3.6/km2 |
| Front of Yonge | Lower-tier | Township | Leeds and Grenville | 2,607 | 2,752 | −5.3% | 128.47 | 20.3/km2 |
| Frontenac Islands | Lower-tier | Township | Frontenac | 1,760 | 1,864 | −5.6% | 175.04 | 10.1/km2 |
| Gananoque | Single-tier | Town | Leeds and Grenville | 5,159 | 5,194 | −0.7% | 7.03 | 733.9/km2 |
| Gauthier | Single-tier | Township | Timiskaming | 138 | 123 | +12.2% | 88.41 | 1.6/km2 |
| Georgian Bay | Lower-tier | Township | Muskoka | 2,499 | 2,482 | +0.7% | 547.61 | 4.6/km2 |
| Georgian Bluffs | Lower-tier | Township | Grey | 10,479 | 10,404 | +0.7% | 604.37 | 17.3/km2 |
| Georgina | Lower-tier | Town | York | 45,418 | 43,517 | +4.4% | 287.75 | 157.8/km2 |
| Gillies | Single-tier | Township | Thunder Bay | 474 | 473 | +0.2% | 93.05 | 5.1/km2 |
| Goderich | Lower-tier | Town | Huron | 7,628 | 7,526 | +1.4% | 8.64 | 882.9/km2 |
| Gordon/Barrie Island | Single-tier | Municipality | Manitoulin | 490 | 526 | −6.8% | 267.77 | 1.8/km2 |
| Gore Bay | Single-tier | Town | Manitoulin | 867 | 850 | +2.0% | 5.23 | 165.8/km2 |
| Grand Valley | Lower-tier | Town | Dufferin | 2,956 | 2,726 | +8.4% | 158.23 | 18.7/km2 |
| Gravenhurst | Lower-tier | Town | Muskoka | 12,311 | 12,055 | +2.1% | 518.06 | 23.8/km2 |
| Greater Madawaska | Lower-tier | Township | Renfrew | 2,518 | 2,485 | +1.3% | 1,035.59 | 2.4/km2 |
| Greater Napanee | Lower-tier | Town | Lennox and Addington | 15,892 | 15,511 | +2.5% | 461.17 | 34.5/km2 |
| Greater Sudbury | Single-tier | City | Greater Sudbury | 161,531 | 160,274 | +0.8% | 3,228.35 | 50.0/km2 |
| Greenstone | Single-tier | Municipality | Thunder Bay | 4,636 | 4,724 | −1.9% | 2,767.19 | 1.7/km2 |
| Grey Highlands | Lower-tier | Municipality | Grey | 9,804 | 9,520 | +3.0% | 882.51 | 11.1/km2 |
| Grimsby | Lower-tier | Town | Niagara | 27,314 | 25,325 | +7.9% | 68.93 | 396.3/km2 |
| Guelph/Eramosa | Lower-tier | Township | Wellington | 12,854 | 12,380 | +3.8% | 291.67 | 44.1/km2 |
| Guelph | Single-tier | City | Wellington | 131,794 | 121,688 | +8.3% | 87.22 | 1,511.1/km2 |
| Haldimand | Single-tier | City | Haldimand-Norfolk | 45,608 | 44,876 | +1.6% | 1,251.54 | 36.4/km2 |
| Halton Hills | Lower-tier | Town | Halton | 61,161 | 59,013 | +3.6% | 276.27 | 221.4/km2 |
| Hamilton | Single-tier | City | Hamilton | 536,917 | 519,949 | +3.3% | 1,117.29 | 480.6/km2 |
| Hamilton | Lower-tier | Township | Northumberland | 10,942 | 10,702 | +2.2% | 256.08 | 42.7/km2 |
| Hanover | Lower-tier | Town | Grey | 7,688 | 7,490 | +2.6% | 9.80 | 784.5/km2 |
| Harley | Single-tier | Township | Timiskaming | 551 | 539 | +2.2% | 92.30 | 6.0/km2 |
| Harris | Single-tier | Township | Timiskaming | 545 | 523 | +4.2% | 49.88 | 10.9/km2 |
| Hastings Highlands | Lower-tier | Municipality | Hastings | 4,078 | 4,168 | −2.2% | 972.35 | 4.2/km2 |
| Havelock-Belmont-Methuen | Lower-tier | Township | Peterborough | 4,530 | 4,523 | +0.2% | 542.73 | 8.3/km2 |
| Hawkesbury | Lower-tier | Town | Prescott and Russell | 10,263 | 10,551 | −2.7% | 9.62 | 1,066.8/km2 |
| Head, Clara and Maria | Lower-tier | Township | Renfrew | 248 | 235 | +5.5% | 728.38 | 0.3/km2 |
| Hearst | Single-tier | Town | Cochrane | 5,070 | 5,090 | −0.4% | 98.52 | 51.5/km2 |
| Highlands East | Lower-tier | Municipality | Haliburton | 3,343 | 3,249 | +2.9% | 704.63 | 4.7/km2 |
| Hilliard | Single-tier | Township | Timiskaming | 223 | 204 | +9.3% | 91.38 | 2.4/km2 |
| Hilton | Single-tier | Township | Algoma | 307 | 261 | +17.6% | 115.82 | 2.7/km2 |
| Hilton Beach | Single-tier | Village | Algoma | 171 | 145 | +17.9% | 2.62 | 65.3/km2 |
| Hornepayne | Single-tier | Township | Algoma | 980 | 1,050 | −6.7% | 204.07 | 4.8/km2 |
| Horton | Lower-tier | Township | Renfrew | 2,887 | 2,719 | +6.2% | 158.51 | 18.2/km2 |
| Howick | Lower-tier | Township | Huron | 3,873 | 3,856 | +0.4% | 287.06 | 13.5/km2 |
| Hudson | Single-tier | Township | Timiskaming | 503 | 476 | +5.7% | 90.37 | 5.6/km2 |
| Huntsville | Lower-tier | Town | Muskoka | 19,816 | 19,056 | +4.0% | 710.01 | 27.9/km2 |
| Huron East | Lower-tier | Municipality | Huron | 9,138 | 9,264 | −1.4% | 669.22 | 13.7/km2 |
| Huron Shores | Single-tier | Municipality | Algoma | 1,664 | 1,723 | −3.4% | 457.35 | 3.6/km2 |
| Huron-Kinloss | Lower-tier | Township | Bruce | 7,069 | 6,790 | +4.1% | 440.76 | 16.0/km2 |
| Ignace | Single-tier | Township | Kenora | 1,202 | 1,202 | 0.0% | 72.82 | 16.5/km2 |
| Ingersoll | Lower-tier | Town | Oxford | 12,757 | 12,146 | +5.0% | 12.75 | 1,000.5/km2 |
| Innisfil | Lower-tier | Town | Simcoe | 36,566 | 32,727 | +11.7% | 262.71 | 139.2/km2 |
| Iroquois Falls | Single-tier | Town | Cochrane | 4,537 | 4,595 | −1.3% | 600.01 | 7.6/km2 |
| James | Single-tier | Township | Timiskaming | 420 | 424 | −0.9% | 86.36 | 4.9/km2 |
| Jocelyn | Single-tier | Township | Algoma | 313 | 237 | +32.1% | 131.45 | 2.4/km2 |
| Johnson | Single-tier | Township | Algoma | 751 | 750 | +0.1% | 120.27 | 6.2/km2 |
| Joly | Single-tier | Township | Parry Sound | 304 | 284 | +7.0% | 194.73 | 1.6/km2 |
| Kapuskasing | Single-tier | Town | Cochrane | 8,292 | 8,196 | +1.2% | 84.37 | 98.3/km2 |
| Kawartha Lakes | Single-tier | City | Kawartha Lakes | 75,423 | 73,219 | +3.0% | 3,084.38 | 24.5/km2 |
| Kearney | Single-tier | Town | Parry Sound | 882 | 841 | +4.9% | 532.00 | 1.7/km2 |
| Kenora | Single-tier | City | Kenora | 15,096 | 15,348 | −1.6% | 211.59 | 71.3/km2 |
| Kerns | Single-tier | Township | Timiskaming | 358 | 359 | −0.3% | 90.64 | 3.9/km2 |
| Killaloe, Hagarty and Richards | Lower-tier | Township | Renfrew | 2,420 | 2,402 | +0.7% | 396.80 | 6.1/km2 |
| Killarney | Single-tier | Municipality | Sudbury | 386 | 505 | −23.6% | 1,653.32 | 0.2/km2 |
| Kincardine | Lower-tier | Municipality | Bruce | 11,389 | 11,174 | +1.9% | 537.94 | 21.2/km2 |
| King | Lower-tier | Township | York | 24,512 | 19,899 | +23.2% | 333.25 | 73.6/km2 |
| Kingston | Single-tier | City | Frontenac | 123,798 | 123,363 | +0.4% | 451.19 | 274.4/km2 |
| Kingsville | Lower-tier | Town | Essex | 21,552 | 21,362 | +0.9% | 246.83 | 87.3/km2 |
| Kirkland Lake | Single-tier | Town | Timiskaming | 7,981 | 8,493 | −6.0% | 262.13 | 30.4/km2 |
| Kitchener | Lower-tier | City | Waterloo | 233,222 | 219,153 | +6.4% | 136.77 | 1,705.2/km2 |
| La Vallee | Single-tier | Township | Rainy River | 938 | 988 | −5.1% | 237.84 | 3.9/km2 |
| Laird | Single-tier | Township | Algoma | 1,047 | 1,057 | −0.9% | 102.48 | 10.2/km2 |
| Lake of Bays | Lower-tier | Township | Muskoka | 3,167 | 3,476 | −8.9% | 677.91 | 4.7/km2 |
| Lake of the Woods | Single-tier | Township | Rainy River | 230 | 296 | −22.3% | 751.31 | 0.3/km2 |
| Lakeshore | Lower-tier | Town | Essex | 36,611 | 34,546 | +6.0% | 530.33 | 69.0/km2 |
| Lambton Shores | Lower-tier | Municipality | Lambton | 10,631 | 10,656 | −0.2% | 331.20 | 32.1/km2 |
| Lanark Highlands | Lower-tier | Township | Lanark | 5,338 | 5,128 | +4.1% | 1,048.83 | 5.1/km2 |
| Larder Lake | Single-tier | Township | Timiskaming | 730 | 684 | +6.7% | 229.52 | 3.2/km2 |
| LaSalle | Lower-tier | Town | Essex | 30,180 | 28,643 | +5.4% | 65.35 | 461.8/km2 |
| Latchford | Single-tier | Town | Timiskaming | 313 | 387 | −19.1% | 153.53 | 2.0/km2 |
| Laurentian Hills | Lower-tier | Town | Renfrew | 2,961 | 2,811 | +5.3% | 642.03 | 4.6/km2 |
| Laurentian Valley | Lower-tier | Township | Renfrew | 9,387 | 9,657 | −2.8% | 551.43 | 17.0/km2 |
| Leamington | Lower-tier | Municipality | Essex | 27,595 | 28,403 | −2.8% | 262.01 | 105.3/km2 |
| Leeds and the Thousand Islands | Lower-tier | Township | Leeds and Grenville | 9,465 | 9,277 | +2.0% | 612.45 | 15.5/km2 |
| Limerick | Lower-tier | Township | Hastings | 346 | 352 | −1.7% | 205.37 | 1.7/km2 |
| Lincoln | Lower-tier | Town | Niagara | 23,787 | 22,487 | +5.8% | 162.81 | 146.1/km2 |
| London | Single-tier | City | Middlesex | 383,822 | 366,151 | +4.8% | 420.35 | 913.1/km2 |
| Loyalist | Lower-tier | Township | Lennox and Addington | 16,971 | 16,221 | +4.6% | 341.02 | 49.8/km2 |
| Lucan Biddulph | Lower-tier | Township | Middlesex | 4,700 | 4,338 | +8.3% | 169.14 | 27.8/km2 |
| Macdonald, Meredith and Aberdeen Additional | Single-tier | Township | Algoma | 1,609 | 1,464 | +9.9% | 164.05 | 9.8/km2 |
| Machar | Single-tier | Township | Parry Sound | 882 | 923 | −4.4% | 184.35 | 4.8/km2 |
| Machin | Single-tier | Municipality | Kenora | 971 | 935 | +3.9% | 291.81 | 3.3/km2 |
| Madawaska Valley | Lower-tier | Township | Renfrew | 4,123 | 4,282 | −3.7% | 672.51 | 6.1/km2 |
| Madoc | Lower-tier | Township | Hastings | 2,078 | 2,166 | −4.1% | 277.97 | 7.5/km2 |
| Magnetawan | Single-tier | Municipality | Parry Sound | 1,390 | 1,454 | −4.4% | 531.53 | 2.6/km2 |
| Malahide | Lower-tier | Township | Elgin | 9,292 | 9,146 | +1.6% | 395.05 | 23.5/km2 |
| Manitouwadge | Single-tier | Township | Thunder Bay | 1,937 | 2,105 | −8.0% | 352.07 | 5.5/km2 |
| Mapleton | Lower-tier | Township | Wellington | 10,527 | 9,989 | +5.4% | 534.87 | 19.7/km2 |
| Marathon | Single-tier | Town | Thunder Bay | 3,273 | 3,353 | −2.4% | 170.54 | 19.2/km2 |
| Markham | Lower-tier | City | York | 328,966 | 301,709 | +9.0% | 212.35 | 1,549.2/km2 |
| Markstay-Warren | Single-tier | Municipality | Sudbury | 2,656 | 2,297 | +15.6% | 512.78 | 5.2/km2 |
| Marmora and Lake | Lower-tier | Municipality | Hastings | 3,953 | 4,074 | −3.0% | 557.08 | 7.1/km2 |
| Matachewan | Single-tier | Township | Timiskaming | 225 | 409 | −45.0% | 543.58 | 0.4/km2 |
| Mattawa | Single-tier | Town | Nipissing | 1,993 | 2,023 | −1.5% | 3.66 | 544.5/km2 |
| Mattawan | Single-tier | Township | Nipissing | 161 | 162 | −0.6% | 201.00 | 0.8/km2 |
| Mattice-Val Côté | Single-tier | Township | Cochrane | 648 | 686 | −5.5% | 414.00 | 1.6/km2 |
| McDougall | Single-tier | Municipality | Parry Sound | 2,702 | 2,705 | −0.1% | 268.48 | 10.1/km2 |
| McGarry | Single-tier | Township | Timiskaming | 609 | 595 | +2.4% | 86.67 | 7.0/km2 |
| McKellar | Single-tier | Township | Parry Sound | 1,111 | 1,144 | −2.9% | 180.88 | 6.1/km2 |
| McMurrich/Monteith | Single-tier | Township | Parry Sound | 824 | 779 | +5.8% | 277.92 | 3.0/km2 |
| McNab/Braeside | Lower-tier | Township | Renfrew | 7,178 | 7,371 | −2.6% | 255.76 | 28.1/km2 |
| Meaford | Lower-tier | Municipality | Grey | 10,991 | 11,100 | −1.0% | 588.57 | 18.7/km2 |
| Melancthon | Lower-tier | Township | Dufferin | 3,008 | 2,839 | +6.0% | 310.79 | 9.7/km2 |
| Merrickville-Wolford | Lower-tier | Village | Leeds and Grenville | 3,067 | 2,850 | +7.6% | 214.55 | 14.3/km2 |
| Middlesex Centre | Lower-tier | Municipality | Middlesex | 17,262 | 16,487 | +4.7% | 588.11 | 29.4/km2 |
| Midland | Lower-tier | Town | Simcoe | 16,864 | 16,572 | +1.8% | 35.34 | 477.2/km2 |
| Milton | Lower-tier | Town | Halton | 110,128 | 84,362 | +30.5% | 363.22 | 303.2/km2 |
| Minden Hills | Lower-tier | Township | Haliburton | 6,088 | 5,655 | +7.7% | 878.27 | 6.9/km2 |
| Minto | Lower-tier | Town | Wellington | 8,671 | 8,334 | +4.0% | 300.69 | 28.8/km2 |
| Mississauga | Lower-tier | City | Peel | 721,599 | 713,443 | +1.1% | 292.43 | 2,467.6/km2 |
| Mississippi Mills | Lower-tier | Town | Lanark | 13,163 | 12,385 | +6.3% | 519.58 | 25.3/km2 |
| Mono | Lower-tier | Town | Dufferin | 8,609 | 7,546 | +14.1% | 277.83 | 31.0/km2 |
| Montague | Lower-tier | Township | Lanark | 3,761 | 3,483 | +8.0% | 279.66 | 13.4/km2 |
| Moonbeam | Single-tier | Township | Cochrane | 1,231 | 1,101 | +11.8% | 235.58 | 5.2/km2 |
| Moosonee | Single-tier | Town | Cochrane | 1,481 | 1,725 | −14.1% | 546.72 | 2.7/km2 |
| Morley | Single-tier | Township | Rainy River | 481 | 508 | −5.3% | 390.61 | 1.2/km2 |
| Morris-Turnberry | Lower-tier | Municipality | Huron | 3,496 | 3,413 | +2.4% | 376.56 | 9.3/km2 |
| Mulmur | Lower-tier | Township | Dufferin | 3,478 | 3,391 | +2.6% | 286.77 | 12.1/km2 |
| Muskoka Lakes | Lower-tier | Township | Muskoka | 6,588 | 6,707 | −1.8% | 794.26 | 8.3/km2 |
| Nairn and Hyman | Single-tier | Township | Sudbury | 342 | 477 | −28.3% | 160.82 | 2.1/km2 |
| The Nation | Lower-tier | Municipality | Prescott and Russell | 12,808 | 11,668 | +9.8% | 658.32 | 19.5/km2 |
| Neebing | Single-tier | Municipality | Thunder Bay | 2,055 | 1,986 | +3.5% | 877.27 | 2.3/km2 |
| New Tecumseth | Lower-tier | Town | Simcoe | 34,242 | 30,234 | +13.3% | 274.21 | 124.9/km2 |
| Newbury | Lower-tier | Village | Middlesex | 466 | 447 | +4.3% | 1.77 | 263.3/km2 |
| Newmarket | Lower-tier | Town | York | 84,224 | 79,978 | +5.3% | 38.45 | 2,190.5/km2 |
| Niagara Falls | Lower-tier | City | Niagara | 88,071 | 82,997 | +6.1% | 209.73 | 419.9/km2 |
| Niagara-on-the-Lake | Lower-tier | Town | Niagara | 17,511 | 15,400 | +13.7% | 132.81 | 131.9/km2 |
| Nipigon | Single-tier | Township | Thunder Bay | 1,642 | 1,631 | +0.7% | 109.11 | 15.0/km2 |
| Nipissing | Single-tier | Township | Parry Sound | 1,707 | 1,704 | +0.2% | 393.80 | 4.3/km2 |
| Norfolk | Single-tier | City | Haldimand-Norfolk | 64,044 | 63,175 | +1.4% | 1,607.55 | 39.8/km2 |
| North Algona Wilberforce | Lower-tier | Township | Renfrew | 2,915 | 2,873 | +1.5% | 378.98 | 7.7/km2 |
| North Bay | Single-tier | City | Nipissing | 51,553 | 53,651 | −3.9% | 319.11 | 161.6/km2 |
| North Dumfries | Lower-tier | Township | Waterloo | 10,215 | 9,334 | +9.4% | 187.43 | 54.5/km2 |
| North Dundas | Lower-tier | Township | Stormont, Dundas and Glengarry | 11,278 | 11,225 | +0.5% | 503.08 | 22.4/km2 |
| North Frontenac | Lower-tier | Township | Frontenac | 1,898 | 1,857 | +2.2% | 1,164.77 | 1.6/km2 |
| North Glengarry | Lower-tier | Township | Stormont, Dundas and Glengarry | 10,109 | 10,251 | −1.4% | 643.46 | 15.7/km2 |
| North Grenville | Lower-tier | Municipality | Leeds and Grenville | 16,451 | 15,085 | +9.1% | 352.18 | 46.7/km2 |
| North Huron | Lower-tier | Township | Huron | 4,932 | 4,884 | +1.0% | 178.82 | 27.6/km2 |
| North Kawartha | Lower-tier | Township | Peterborough | 2,479 | 2,289 | +8.3% | 776.01 | 3.2/km2 |
| North Middlesex | Lower-tier | Municipality | Middlesex | 6,352 | 6,658 | −4.6% | 597.88 | 10.6/km2 |
| North Perth | Lower-tier | Municipality | Perth | 13,130 | 12,631 | +4.0% | 493.14 | 26.6/km2 |
| The North Shore | Single-tier | Township | Algoma | 497 | 509 | −2.4% | 239.08 | 2.1/km2 |
| North Stormont | Lower-tier | Township | Stormont, Dundas and Glengarry | 6,873 | 6,775 | +1.4% | 515.91 | 13.3/km2 |
| Northeastern Manitoulin and the Islands | Single-tier | Municipality | Manitoulin | 2,712 | 2,706 | +0.2% | 496.09 | 5.5/km2 |
| Northern Bruce Peninsula | Lower-tier | Municipality | Bruce | 3,999 | 3,744 | +6.8% | 783.99 | 5.1/km2 |
| Norwich | Lower-tier | Township | Oxford | 11,001 | 10,721 | +2.6% | 431.27 | 25.5/km2 |
| Oakville | Lower-tier | Town | Halton | 193,832 | 182,520 | +6.2% | 138.89 | 1,395.6/km2 |
| O'Connor | Single-tier | Township | Thunder Bay | 663 | 685 | −3.2% | 108.78 | 6.1/km2 |
| Oil Springs | Lower-tier | Village | Lambton | 648 | 704 | −8.0% | 8.19 | 79.1/km2 |
| Oliver Paipoonge | Single-tier | Municipality | Thunder Bay | 5,922 | 5,732 | +3.3% | 350.91 | 16.9/km2 |
| Opasatika | Single-tier | Township | Cochrane | 226 | 214 | +5.6% | 330.44 | 0.7/km2 |
| Orangeville | Lower-tier | Town | Dufferin | 28,900 | 27,975 | +3.3% | 15.61 | 1,851.4/km2 |
| Orillia | Single-tier | City | Simcoe | 31,166 | 30,586 | +1.9% | 28.58 | 1,090.5/km2 |
| Oro-Medonte | Lower-tier | Township | Simcoe | 21,036 | 20,078 | +4.8% | 587.08 | 35.8/km2 |
| Oshawa | Lower-tier | City | Durham | 159,458 | 149,607 | +6.6% | 145.64 | 1,094.9/km2 |
| Otonabee-South Monaghan | Lower-tier | Township | Peterborough | 6,670 | 6,581 | +1.4% | 347.13 | 19.2/km2 |
| Ottawa | Single-tier | City | Ottawa | 934,243 | 883,391 | +5.8% | 2,790.30 | 334.8/km2 |
| Owen Sound | Lower-tier | City | Grey | 21,341 | 21,688 | −1.6% | 24.27 | 879.3/km2 |
| Papineau-Cameron | Single-tier | Township | Nipissing | 1,016 | 978 | +3.9% | 566.39 | 1.8/km2 |
| Parry Sound | Single-tier | Town | Parry Sound | 6,408 | 6,191 | +3.5% | 13.40 | 478.2/km2 |
| Pelee | Single-tier | Township | Essex | 235 | 171 | +37.4% | 41.79 | 5.6/km2 |
| Pelham | Lower-tier | Town | Niagara | 17,110 | 16,598 | +3.1% | 126.43 | 135.3/km2 |
| Pembroke | Single-tier | City | Renfrew | 13,882 | 14,360 | −3.3% | 14.56 | 953.4/km2 |
| Penetanguishene | Lower-tier | Town | Simcoe | 8,962 | 9,111 | −1.6% | 25.58 | 350.4/km2 |
| Perry | Single-tier | Township | Parry Sound | 2,454 | 2,317 | +5.9% | 187.22 | 13.1/km2 |
| Perth | Lower-tier | Town | Lanark | 5,930 | 5,840 | +1.5% | 12.25 | 484.1/km2 |
| Perth East | Lower-tier | Township | Perth | 12,261 | 12,011 | +2.1% | 712.14 | 17.2/km2 |
| Perth South | Lower-tier | Township | Perth | 3,810 | 3,993 | −4.6% | 393.14 | 9.7/km2 |
| Petawawa | Lower-tier | Town | Renfrew | 17,187 | 15,988 | +7.5% | 166.69 | 103.1/km2 |
| Peterborough | Single-tier | City | Peterborough | 81,032 | 78,777 | +2.9% | 64.25 | 1,261.2/km2 |
| Petrolia | Lower-tier | Town | Lambton | 5,742 | 5,528 | +3.9% | 12.68 | 452.8/km2 |
| Pickering | Lower-tier | City | Durham | 91,771 | 88,721 | +3.4% | 231.55 | 396.3/km2 |
| Pickle Lake | Single-tier | Township | Kenora | 388 | 425 | −8.7% | 252.18 | 1.5/km2 |
| Plummer Additional | Single-tier | Township | Algoma | 660 | 650 | +1.5% | 220.30 | 3.0/km2 |
| Plympton-Wyoming | Lower-tier | Town | Lambton | 7,795 | 7,576 | +2.9% | 318.78 | 24.5/km2 |
| Point Edward | Lower-tier | Village | Lambton | 2,037 | 2,034 | +0.1% | 3.28 | 621.0/km2 |
| Port Colborne | Lower-tier | City | Niagara | 18,306 | 18,424 | −0.6% | 121.96 | 150.1/km2 |
| Port Hope | Lower-tier | Municipality | Northumberland | 16,753 | 16,214 | +3.3% | 278.87 | 60.1/km2 |
| Powassan | Single-tier | Municipality | Parry Sound | 3,455 | 3,378 | +2.3% | 224.56 | 15.4/km2 |
| Prescott | Single-tier | Town | Leeds and Grenville | 4,222 | 4,284 | −1.4% | 4.93 | 856.4/km2 |
| Prince | Single-tier | Township | Algoma | 1,010 | 1,031 | −2.0% | 85.30 | 11.8/km2 |
| Prince Edward | Single-tier | City | Prince Edward | 24,735 | 25,258 | −2.1% | 1,050.49 | 23.5/km2 |
| Puslinch | Lower-tier | Township | Wellington | 7,336 | 7,029 | +4.4% | 214.62 | 34.2/km2 |
| Quinte West | Single-tier | City | Hastings | 43,577 | 43,086 | +1.1% | 494.02 | 88.2/km2 |
| Rainy River | Single-tier | Town | Rainy River | 807 | 842 | −4.2% | 3.11 | 259.5/km2 |
| Ramara | Lower-tier | Township | Simcoe | 9,488 | 9,275 | +2.3% | 418.82 | 22.7/km2 |
| Red Lake | Single-tier | Municipality | Kenora | 4,107 | 4,670 | −12.1% | 610.06 | 6.7/km2 |
| Red Rock | Single-tier | Township | Thunder Bay | 895 | 942 | −5.0% | 62.21 | 14.4/km2 |
| Renfrew | Lower-tier | Town | Renfrew | 8,223 | 8,218 | +0.1% | 12.78 | 643.4/km2 |
| Richmond Hill | Lower-tier | City | York | 195,022 | 185,541 | +5.1% | 101.11 | 1,928.8/km2 |
| Rideau Lakes | Lower-tier | Township | Leeds and Grenville | 10,326 | 10,207 | +1.2% | 729.22 | 14.2/km2 |
| Russell | Lower-tier | Township | Prescott and Russell | 16,520 | 15,247 | +8.3% | 199.11 | 83.0/km2 |
| Ryerson | Single-tier | Township | Parry Sound | 648 | 634 | +2.2% | 187.92 | 3.4/km2 |
| Sables-Spanish Rivers | Single-tier | Township | Sudbury | 3,188[36] | 3,075 | +3.7% | 815.21 | 3.9/km2 |
| Sarnia | Lower-tier | City | Lambton | 71,594 | 72,366 | −1.1% | 164.85 | 434.3/km2 |
| Saugeen Shores | Lower-tier | Town | Bruce | 13,715 | 12,661 | +8.3% | 171.05 | 80.2/km2 |
| Sault Ste. Marie | Single-tier | City | Algoma | 73,368 | 75,141 | −2.4% | 223.24 | 328.7/km2 |
| Schreiber | Single-tier | Township | Thunder Bay | 1,059 | 1,126 | −6.0% | 36.80 | 28.8/km2 |
| Scugog | Lower-tier | Township | Durham | 21,617 | 21,569 | +0.2% | 474.71 | 45.5/km2 |
| Seguin | Single-tier | Township | Parry Sound | 4,304 | 3,988 | +7.9% | 595.68 | 7.2/km2 |
| Selwyn | Lower-tier | Township | Peterborough | 17,060 | 16,846 | +1.3% | 315.69 | 54.0/km2 |
| Severn | Lower-tier | Township | Simcoe | 13,477 | 12,377 | +8.9% | 549.75 | 24.5/km2 |
| Shelburne | Lower-tier | Town | Dufferin | 8,126 | 5,846 | +39.0% | 6.56 | 1,238.7/km2 |
| Shuniah | Single-tier | Municipality | Thunder Bay | 2,798 | 2,737 | +2.2% | 570.99 | 4.9/km2 |
| Sioux Lookout | Single-tier | Municipality | Kenora | 5,272 | 5,037 | +4.7% | 378.12 | 13.9/km2 |
| Sioux Narrows-Nestor Falls | Single-tier | Township | Kenora | 567 | 720 | −21.3% | 1,223.12 | 0.5/km2 |
| Smiths Falls | Single-tier | Town | Lanark | 8,780 | 8,978 | −2.2% | 9.66 | 908.9/km2 |
| Smooth Rock Falls | Single-tier | Town | Cochrane | 1,330 | 1,376 | −3.3% | 200.10 | 6.6/km2 |
| South Algonquin | Single-tier | Township | Nipissing | 1,096 | 1,211 | −9.5% | 873.43 | 1.3/km2 |
| South Bruce Peninsula | Lower-tier | Town | Bruce | 8,416 | 8,413 | 0.0% | 532.29 | 15.8/km2 |
| South Bruce | Lower-tier | Municipality | Bruce | 5,639 | 5,685 | −0.8% | 487.48 | 11.6/km2 |
| South Dundas | Lower-tier | Municipality | Stormont, Dundas and Glengarry | 10,833 | 10,794 | +0.4% | 521.06 | 20.8/km2 |
| South Frontenac | Lower-tier | Township | Frontenac | 18,646 | 18,113 | +2.9% | 971.56 | 19.2/km2 |
| South Glengarry | Lower-tier | Township | Stormont, Dundas and Glengarry | 13,150 | 13,162 | −0.1% | 605.36 | 21.7/km2 |
| South Huron | Lower-tier | Municipality | Huron | 10,096 | 9,945 | +1.5% | 425.41 | 23.7/km2 |
| South River | Single-tier | Village | Parry Sound | 1,114 | 1,049 | +6.2% | 4.15 | 268.4/km2 |
| South Stormont | Lower-tier | Township | Stormont, Dundas and Glengarry | 13,110 | 12,617 | +3.9% | 447.58 | 29.3/km2 |
| Southgate | Lower-tier | Township | Grey | 7,354 | 7,190 | +2.3% | 644.38 | 11.4/km2 |
| Southwest Middlesex | Lower-tier | Municipality | Middlesex | 5,723 | 5,860 | −2.3% | 427.88 | 13.4/km2 |
| South-West Oxford | Lower-tier | Township | Oxford | 7,664 | 7,544 | +1.6% | 370.73 | 20.7/km2 |
| Southwold | Lower-tier | Township | Elgin | 4,421 | 4,494 | −1.6% | 301.74 | 14.7/km2 |
| Spanish | Single-tier | Town | Algoma | 712 | 696 | +2.3% | 108.67 | 6.6/km2 |
| Springwater | Lower-tier | Township | Simcoe | 19,059 | 18,223 | +4.6% | 536.28 | 35.5/km2 |
| St. Catharines | Lower-tier | City | Niagara | 133,113 | 131,400 | +1.3% | 96.13 | 1,384.7/km2 |
| St. Charles | Single-tier | Municipality | Sudbury | 1,269 | 1,282 | −1.0% | 321.75 | 3.9/km2 |
| St. Clair | Lower-tier | Township | Lambton | 14,086 | 14,515 | −3.0% | 619.17 | 22.7/km2 |
| St. Joseph | Single-tier | Township | Algoma | 1,240 | 1,201 | +3.2% | 129.12 | 9.6/km2 |
| St. Marys | Single-tier | Town | Perth | 7,265 | 6,655 | +9.2% | 12.45 | 583.5/km2 |
| St. Thomas | Single-tier | City | Elgin | 38,909 | 37,905 | +2.6% | 35.63 | 1,092.0/km2 |
| Stirling-Rawdon | Lower-tier | Township | Hastings | 4,882 | 4,978 | −1.9% | 282.33 | 17.3/km2 |
| Stone Mills | Lower-tier | Township | Lennox and Addington | 7,702 | 7,560 | +1.9% | 709.17 | 10.9/km2 |
| Stratford | Single-tier | City | Perth | 31,465 | 30,903 | +1.8% | 28.28 | 1,112.6/km2 |
| Strathroy-Caradoc | Lower-tier | Municipality | Middlesex | 20,867 | 20,978 | −0.5% | 270.77 | 77.1/km2 |
| Strong | Single-tier | Township | Parry Sound | 1,439 | 1,341 | +7.3% | 159.93 | 9.0/km2 |
| Sundridge | Single-tier | Village | Parry Sound | 961 | 985 | −2.4% | 2.30 | 417.8/km2 |
| Tarbutt | Single-tier | Township | Algoma | 534 | 396 | +34.8% | 52.82 | 10.1/km2 |
| Tay | Lower-tier | Township | Simcoe | 10,033 | 9,736 | +3.1% | 139.07 | 72.1/km2 |
| Tay Valley | Lower-tier | Township | Lanark | 5,665 | 5,571 | +1.7% | 550.01 | 10.3/km2 |
| Tecumseh | Lower-tier | Town | Essex | 23,229 | 23,610 | −1.6% | 94.64 | 245.4/km2 |
| Tehkummah | Single-tier | Township | Manitoulin | 436 | 406 | +7.4% | 132.69 | 3.3/km2 |
| Temagami | Single-tier | Municipality | Nipissing | 802 | 840 | −4.5% | 1,905.92 | 0.4/km2 |
| Temiskaming Shores | Single-tier | City | Timiskaming | 9,920 | 10,400 | −4.6% | 178.11 | 55.7/km2 |
| Terrace Bay | Single-tier | Township | Thunder Bay | 1,611 | 1,471 | +9.5% | 152.82 | 10.5/km2 |
| Thames Centre | Lower-tier | Municipality | Middlesex | 13,191 | 13,000 | +1.5% | 433.99 | 30.4/km2 |
| Thessalon | Single-tier | Town | Algoma | 1,286 | 1,279 | +0.5% | 4.52 | 284.5/km2 |
| Thornloe | Single-tier | Village | Timiskaming | 112 | 123 | −8.9% | 6.59 | 17.0/km2 |
| Thorold | Lower-tier | City | Niagara | 18,801 | 17,931 | +4.9% | 82.99 | 226.5/km2 |
| Thunder Bay | Single-tier | City | Thunder Bay | 107,909 | 108,359 | −0.4% | 328.36 | 328.6/km2 |
| Tillsonburg | Lower-tier | Town | Oxford | 15,872 | 15,301 | +3.7% | 22.33 | 710.8/km2 |
| Timmins | Single-tier | City | Cochrane | 41,788 | 43,165 | −3.2% | 2,978.83 | 14.0/km2 |
| Tiny | Lower-tier | Township | Simcoe | 11,787 | 11,232 | +4.9% | 336.93 | 35.0/km2 |
| Toronto[lower-alpha 23] | Single-tier[lower-alpha 23] | City | Toronto | 2,731,571 | 2,615,060 | +4.5% | 630.20 | 4,334.5/km2 |
| Trent Hills | Lower-tier | Municipality | Northumberland | 12,900 | 12,604 | +2.3% | 511.95 | 25.2/km2 |
| Trent Lakes | Lower-tier | Municipality | Peterborough | 5,397 | 5,100 | +5.8% | 861.32 | 6.3/km2 |
| Tudor and Cashel | Lower-tier | Township | Hastings | 586 | 586 | 0.0% | 445.66 | 1.3/km2 |
| Tweed | Lower-tier | Municipality | Hastings | 6,044 | 6,057 | −0.2% | 953.47 | 6.3/km2 |
| Tyendinaga | Lower-tier | Township | Hastings | 4,297 | 4,150 | +3.5% | 312.92 | 13.7/km2 |
| Uxbridge | Lower-tier | Township | Durham | 21,176 | 20,623 | +2.7% | 420.95 | 50.3/km2 |
| Val Rita-Harty | Single-tier | Township | Cochrane | 762 | 817 | −6.7% | 381.18 | 2.0/km2 |
| Vaughan | Lower-tier | City | York | 306,233 | 288,301 | +6.2% | 273.56 | 1,119.4/km2 |
| Wainfleet | Lower-tier | Township | Niagara | 6,372 | 6,356 | +0.3% | 217.31 | 29.3/km2 |
| Warwick | Lower-tier | Township | Lambton | 3,692 | 3,717 | −0.7% | 290.20 | 12.7/km2 |
| Wasaga Beach | Lower-tier | Town | Simcoe | 20,675 | 17,537 | +17.9% | 58.64 | 352.6/km2 |
| Waterloo | Lower-tier | City | Waterloo | 104,986 | 98,780 | +6.3% | 64.02 | 1,639.9/km2 |
| Wawa | Single-tier | Municipality | Algoma | 2,905 | 2,975 | −2.4% | 416.21 | 7.0/km2 |
| Welland | Lower-tier | City | Niagara | 52,293 | 50,631 | +3.3% | 81.04 | 645.3/km2 |
| Wellesley | Lower-tier | Township | Waterloo | 11,260 | 10,713 | +5.1% | 277.76 | 40.5/km2 |
| Wellington North | Lower-tier | Township | Wellington | 11,914 | 11,477 | +3.8% | 526.21 | 22.6/km2 |
| West Elgin | Lower-tier | Municipality | Elgin | 4,995 | 5,157 | −3.1% | 322.48 | 15.5/km2 |
| West Grey | Lower-tier | Municipality | Grey | 12,518 | 12,286 | +1.9% | 876.16 | 14.3/km2 |
| West Lincoln | Lower-tier | Township | Niagara | 14,500 | 13,837 | +4.8% | 387.81 | 37.4/km2 |
| West Nipissing | Single-tier | Municipality | Nipissing | 14,364 | 14,149 | +1.5% | 1,993.63 | 7.2/km2 |
| West Perth | Lower-tier | Municipality | Perth | 8,865 | 8,919 | −0.6% | 579.36 | 15.3/km2 |
| Westport | Lower-tier | Village | Leeds and Grenville | 590 | 628 | −6.1% | 1.68 | 351.2/km2 |
| Whitby | Lower-tier | Town | Durham | 128,377 | 122,022 | +5.2% | 146.66 | 875.3/km2 |
| Whitchurch-Stouffville | Lower-tier | Town | York | 45,837 | 37,628 | +21.8% | 206.22 | 222.3/km2 |
| White River | Single-tier | Township | Algoma | 645 | 607 | +6.3% | 96.78 | 6.7/km2 |
| Whitestone | Single-tier | Municipality | Parry Sound | 916 | 918 | −0.2% | 957.93 | 1.0/km2 |
| Whitewater Region | Lower-tier | Township | Renfrew | 7,009 | 6,921 | +1.3% | 539.51 | 13.0/km2 |
| Wilmot | Lower-tier | Township | Waterloo | 20,545 | 19,223 | +6.9% | 263.78 | 77.9/km2 |
| Windsor | Single-tier | City | Essex | 217,188 | 210,891 | +3.0% | 146.38 | 1,483.7/km2 |
| Wollaston | Lower-tier | Township | Hastings | 670 | 708 | −5.4% | 219.14 | 3.1/km2 |
| Woodstock | Lower-tier | City | Oxford | 40,902 | 37,754 | +8.3% | 48.97 | 835.2/km2 |
| Woolwich | Lower-tier | Township | Waterloo | 25,006 | 23,145 | +8.0% | 326.15 | 76.7/km2 |
| Zorra | Lower-tier | Township | Oxford | 8,138 | 8,058 | +1.0% | 528.94 | 15.4/km2 |
| Total local (single and lower-tier) municipalities | 13,357,208 | 12,764,756 | +4.6% | 155,672.56 | 85.8/km2 | |||
| Province of Ontario | 13,448,494 | 12,851,821 | +4.6% | 908,699.33 | 14.8/km2 | |||
See also
Notes
- Although Ontario is the third-largest province in land area, it is second-largest in total area after accounting for its freshwater area.[1]
- Although the Township of Cockburn Island's population is published as 0 by Statistics Canada, 1 of its 79 private dwellings was occupied by usual residents. To protect privacy, Statistics Canada has rounded Cockburn Island's actual population to the nearest 5, which in this case is 0.[10] Its seasonal summer population is much higher.
- Though Muskoka and Oxford are officially named the District Municipality of Muskoka and the County of Oxford respectively, both are actually regional municipalities per the definition of "regional municipality" in Ontario's Municipal Act, 2001, which states that a regional municipality "means an upper-tier municipality that was a regional or district municipality or the County of Oxford on December 31, 2002".[6]
- Demographic information excludes the Saugeen 29 and Neyaashiinigmiing 27 Indian Reserves.[14]
- Demographic information excludes the Mississaugas of Scugog Island Indian Reserve.[15]
- Demographic information excludes the city of St. Thomas which is independent of Elgin County but included in the Elgin County Census Division.[16]
- Demographic information excludes the city of Windsor and the township of Pelee which are independent of Essex County but included in the Essex County Census Division.[17]
- Demographic information excludes the city of Kingston which is independent of Frontenac County but included in the Frontenac County Census Division.[18]
- Demographic information excludes the Tyendinaga Mohawk Territory Indian Reserve, and the cities of Belleville and Quinte West which are independent of Hastings County but included in the Hastings County Census Division.[19]
- Demographic information excludes the Chippewas of Kettle and Stony Point First Nation, Aamjiwnaang First Nation, and Walpole Island Indian Reserves which are independent of Lambton County but included in the Lambton County Census Division. Walpole Island was incompletely enumerated in the 2011 census and population figures are not included in the 2011 population.[20]
- Demographic information excludes the city of Smiths Falls which is independent of Lanark County but included in the Lanark County Census Division.[21]
- Demographic information excludes the city of Brockville and towns of Gananoque and Prescott which are independent of Leeds and Grenville but included in the Leeds and Grenville Census Division.[22]
- Demographic information excludes the city of London and the Chippewas of the Thames 42, Munsee-Delaware 1, Oneida 41 Indian Reserves which are independent of Middlesex County but included in the Middlesex County Census Division. Chippewas of the Thames 42 and Oneida 41 were incompletely enumerated in the 2016 census and population figures are not included in the 2016 population.[23]
- Demographic information excludes the Moose Point 79 Indian Reserve which is independent of District Municipality of Muskoka but included in the District Municipality of Muskoka Census Division.[24]
- Demographic information excludes the Alderville First Nation Indian Reserve which is independent of Northumberland County but included in the Northumberland County Census Division.[25]
- Demographic information excludes the City of Stratford and Town of St. Marys which are independent of Perth County but included in the Perth County Census Division.[26]
- Demographic information excludes the city of Peterborough and the Curve Lake First Nation 35 and Hiawatha First Nation Indian Reserves which are independent of Peterborough County but included in the Peterborough County Census Division.[27]
- Demographic information excludes the city of Pembroke and the Pikwakanagan (Golden Lake 39) Indian Reserve which are independent of Renfrew County but included in the Renfrew County Census Division.[28]
- Demographic information excludes the cities of Barrie and Orillia and the Christian Island 30, Christian Island 30A, and Mnjikaning First Nation 32 Indian Reserves which are independent of Simcoe County but included in the Simcoe County Census Division.[29]
- Demographic information exclude the single-tier municipality of Cornwall and the Akwesasne 59 Indian Reserve which are independent of Stormont, Dundas and Glengarry but included in the Stormont, Dundas and Glengarry Census Division. Akwesasne 59 was incompletely enumerated in the 2011 census and population figures are not included in the 2011 population.[30]
- Demographic information exclude the city of Guelph which is independent of Wellington County but included in the Wellington County Census Division.[31]
- Demographic information exclude the Chippewas of Georgina Island First Nation Indian Reserve which is independent of Regional Municipality of York but included in the Regional Municipality of York Census Division.[32]
- A unique set of legal powers, beyond other single-tier municipalities, is provided by the City of Toronto Act, 2006, SO 2006, c 11, Sch A.
References
- "Land and freshwater area, by province and territory". Statistics Canada. February 1, 2005. Retrieved December 18, 2014.
- "Population and dwelling counts, for Canada, provinces and territories, 2016 and 2011 censuses – 100% data". Statistics Canada. February 8, 2017. Retrieved February 11, 2017.
- "List of Ontario Municipalities". Ontario Ministry of Municipal Affairs and Housing. Archived from the original on February 28, 2013. Retrieved June 20, 2013.
- "Population and Dwelling Count Highlight Tables, 2016 Census". Statistics Canada. February 8, 2017. Retrieved February 8, 2017.
- "The Municipal Councillor's Guide" (PDF). Ontario Ministry of Municipal Affairs and Housing. Archived from the original on January 14, 2009. Retrieved June 25, 2013.
- "Municipal Act, S.O. 2001, Chapter 25". Service Ontario. Retrieved July 3, 2013.
- "City of Toronto Act, 2006". e-Laws. Government of Ontario. Retrieved August 20, 2013.
- "Ontario Municipalities". Association of Municipalities of Ontario. Retrieved June 25, 2013.
- "Town of Markham ready to take another shot at city status". Metro. Free Daily News Group Inc. May 10, 2013. Archived from the original on August 18, 2013. Retrieved August 18, 2013.
- "Census Profile: Cockburn Island, TP, Ontario (Census subdivision)". Statistics Canada. March 1, 2013. Retrieved June 27, 2013.
- Doug Grant. "A Short History: Brockville – Ontario's First Incorporated Town". City of Brockville. Archived from the original on August 21, 2010. Retrieved June 20, 2013.
- "Population and dwelling counts, for Canada, provinces and territories, and census divisions, 2016 and 2011 censuses". Statistics Canada. August 9, 2017. Retrieved July 28, 2017.
- "List of Ontario Municipalities". Ontario Municipal Affairs and Housing. September 21, 2012. Archived from the original on February 28, 2013. Retrieved January 3, 2013.
- "Standard Geographical Classification (SGC) 2001 Bruce County". Statistics Canada. October 7, 2014. Retrieved January 23, 2016.
- "Standard Geographical Classification (SGC) 2001 Durham Regional Municipality". Statistics Canada. October 7, 2014. Retrieved January 23, 2016.
- "Elgin County". County of Elgin. 2012. Retrieved January 23, 2016.
- "Our Municipalities". County of Essex. 2014. Retrieved January 23, 2016.
- "Township Boundaries" (PDF). County of Frontenac. 2010. Retrieved January 23, 2016.
- "Member Municipalities". County of Hastings. 2016. Retrieved January 23, 2016.
- "Local Municipalities". County of Lambton. 2016. Retrieved January 23, 2016.
- "Local Municipalities". The County of Lanark. 2014. Retrieved January 23, 2016.
- "Member Municipalities". United Counties of Leeds and Grenville. 2015. Archived from the original on January 30, 2016. Retrieved January 23, 2016.
- "Municipalities". Middlesex County. 2012. Retrieved January 23, 2016.
- "Long Range Solid Waste Management Plan Environmental Assessment Waste Quantity Projections and Existing Environment Profile". The District Municipality of Muskoka. 2016. p. 16. Retrieved January 26, 2016.
- "Northumberland County". Northumberland. 2015. Retrieved January 26, 2016.
- "About Perth County". Perth County. Archived from the original on February 2, 2016. Retrieved January 26, 2016.
- "Municipalities". County of Peterborough. 2016. Retrieved January 26, 2016.
- "Municipalities". County of Renfrew. 2016. Retrieved January 26, 2016.
- "Municipal Partners". Simcoe County. 2014. Retrieved January 27, 2016.
- "Municipalities". Stormont, Dundas and Glengarry. 2015. Retrieved January 27, 2016.
- "Local Towns and Townships". County of Wellington. 2015. Retrieved January 27, 2016.
- "Local Municipalities". The Regional Municipality of York. 2016. Retrieved January 27, 2016.
- "Population and dwelling counts, for Canada, provinces and territories, census divisions and census subdivisions (municipalities), 2016 and 2011 censuses – 100% data (Ontario)". Statistics Canada. February 8, 2018. p. 1 of 3. Retrieved December 27, 2018.
- "Population and dwelling counts, for Canada, provinces and territories, census divisions and census subdivisions (municipalities), 2016 and 2011 censuses – 100% data (Ontario)". Statistics Canada. February 8, 2018. p. 2 of 3. Retrieved December 27, 2018.
- "Population and dwelling counts, for Canada, provinces and territories, census divisions and census subdivisions (municipalities), 2016 and 2011 censuses – 100% data (Ontario)". Statistics Canada. February 8, 2018. p. 3 of 3. Retrieved December 27, 2018.
- "Population and dwelling count amendments, 2016 Census". Statistics Canada. January 16, 2018. Retrieved February 3, 2018.
External links
| |||||||||||||||||||||||||