Tropical cyclones in 2006
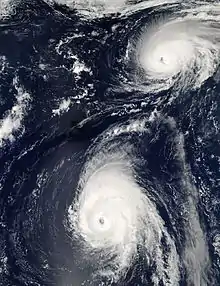
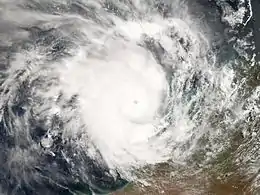
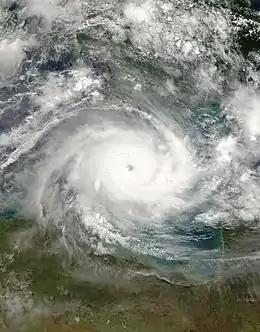
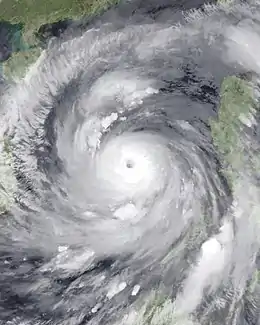
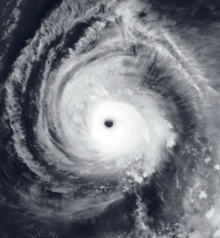
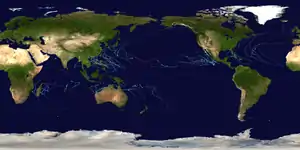
Throughout 2006, 133 tropical cyclones formed in seven bodies of water known as tropical cyclone basins. Of these, 80 have been named, including two tropical cyclones in the South Atlantic Ocean, and a tropical cyclone in the Mediterranean Sea, by various weather agencies when they attained maximum sustained winds of 35 knots (65 km/h, 40 mph). The strongest storms of the year were Typhoon Yagi in the Western Pacific, and Cyclone Glenda of the Australian region. The deadliest and costliest storms of the year were a series of five typhoons that struck the Philippines; Chanchu, Bilis, Saomai, Xangsane, and Durian, with most of the damage being caused by Durian of November.
| Tropical cyclones in 2006 | |
|---|---|
 Year summary map | |
| Year boundaries | |
| First system | 07 |
| Formed | December 29, 2005 |
| Last system | Isobel |
| Dissipated | January 5, 2007 |
| Strongest system | |
| Name | Yagi & Glenda |
| Lowest pressure | 910 mbar/hPa; 26.87 inHg |
| Longest lasting system | |
| Name | Ioke |
| Duration | 18 days |
| Year statistics | |
| Total systems | 134, 6 unofficial |
| Named systems | 80 |
| Total fatalities | 4,597 |
| Total damage | $16 billion (2006 USD) |
Tropical cyclones are primarily monitored by a group of ten warning centres, which have been designated as a Regional Specialized Meteorological Center (RSMC) or a Tropical Cyclone Warning Center (TCWC) by the World Meteorological Organization. These are the United States National Hurricane Center (NHC) and Central Pacific Hurricane Center, the Japan Meteorological Agency (JMA), the Indian Meteorological Department (IMD), Météo-France, Indonesia's Badan Meteorologi, Klimatologi, dan Geofisika, the Australian Bureau of Meteorology (BOM), Papua New Guinea's National Weather Service, the Fiji Meteorological Service (FMS) as well as New Zealand's MetService. Other notable warning centres include the Philippine Atmospheric, Geophysical and Astronomical Services Administration (PAGASA), the United States Joint Typhoon Warning Center (JTWC), and the Brazilian Navy Hydrographic Center.
Global atmospheric and hydrological conditions
There is a strong El Nino in this year.
Summary

In the Northern Hemisphere, 10 tropical cyclones have developed or formed in the North Atlantic Ocean basin, 25 in the Eastern and Central Pacific (including one unofficial subtropical cyclone), 40 in the Western Pacific (including three unofficial tropical cyclones), and 12 in the North Indian (including one unofficial deep depression), totaling to 88 official and 6 unofficial tropical cyclones in the Northern Hemisphere, including one official and one unofficial tropical cyclones in the Mediterranean Sea.
In the Southern Hemisphere, 11 tropical cyclones have developed or formed in the South-West Indian Ocean basin, 19 in the South-Central Pacific/Fiji Region, 14 in the South-East Indian/Southwestern Pacific/Australian Region, and including 2 in the South Atlantic/Southeastern Pacific, thus totaling to 46 tropical cyclones in the Southern Hemisphere.
In the whole world combined, 134 tropical cyclones have developed throughout the whole world, including 6 unofficial systems, equaling 140 total tropical cyclones.
Systems
January
.jpg.webp)
During January 2006, a total of 12 tropical cyclones have developed in tropical cyclone basins. Of those, 7 were named, with 6 of those named systems having tropical storm-equivalent force winds, in ten or three-minute sustained wind speeds. Tropical Storm Zeta from the extremely hyperactive 2005 Atlantic hurricane season became only the second of two tropical storms in the Atlantic to have spanned two different calendar years, with the other being Hurricane Alice of 1954-55. Speaking, Cyclones Tam and Clare were the only tropical cyclones in January 2006 to have known damage totals, even though Boloetse was the most severe and deadliest in the month. Boloetse was also the strongest and most intense tropical cyclone of the month, peaking with 10-minute sustained winds of 100 mph and pressure dropping to 950 hPa/mbar.
| Storm name | Dates active | Max wind km/h (mph) |
Pressure (hPa) |
Areas affected | Damage (USD) |
Deaths | Refs |
|---|---|---|---|---|---|---|---|
| Tam | January 6–14 | 85 (50) | 987 | American Samoa, Rotuma Niue, Tonga, Futuna | $26,000 | None | |
| Clare | January 6–10 | 140 (85) | 960 | Western Australia | $2.3 million | None | |
| 05F | January 10–13 | 55 (35) | 996 | None | None | None | |
| ARB 01 | January 13–14 | 55 (35) | 1004 | Kerala, Lakshadweep | None | None | |
| Urmil | January 13–15 | 110 (70) | 975 | Tafahi, Niuatoputapu, Vavaʻu, Ha'apai | Minimal | None | |
| 07F | January 15–16 | 30 (15) | Unspecified | Fiji | None | None | |
| Daryl | January 18–22 | 100 (65) | 976 | Coast of Western Australia | None | None | |
| Agaton | January 20–27 | 55 (35) | 1000 | Philippines | None | None | |
| Boloetse | January 20 - February 5 | 155 (100) | 950 | Madagascar, coast of Mozambique | Catastrophic | 6 | |
| 07U | January 24 - February 1 | 55 (35) | 989 | Northern Territory (Australia), portions of Western Australia | Moderate | None | |
| Jim | January 25 - February 3 | 150 (90) | 955 | New Caledonia, southern Vanuatu | Minor | None | |
| 09F | January 30 - February 5 | Unspecified | 994 | None | None | None |
February
| Storm name | Dates active | Max wind km/h (mph) |
Pressure (hPa) |
Areas affected | Damage (USD) |
Deaths | Refs |
|---|---|---|---|---|---|---|---|
| 10F | February 2–4 | 55 (35) | 998 | Niue, Tongatapu | None | None | |
| 11F | February 8–10 | 35 (25) | Unspecified | None | None | None | |
| Vaianu | February 9–22 | 130 (80) | 965 | Tonga | None | None | |
| 09 | February 18–23 | 95 (60) | 992 | Mauritius, Réunion, Madagascar | Minimal | None | |
| 13F | February 19–26 | 35 (25) | Unspecified | None | None | None | |
| Kate | February 22–24 | 95 (60) | 985 | Papua New Guinea and Queensland, Australia | None | None | |
| 01Q | February 22–23 | 105 (65) | Unspecified | None | None | None | |
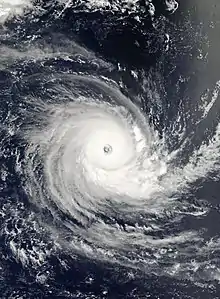
| Carina | February 22 - March 11 | 205 (125) | 915 | None | None | None | |
| Emma | February 25 - March 1 | 75 (45) | 988 | Western Australia | $706,000 | None | |
| TL | February 28 - March 6 | 55 (35) | 998 | Papua New Guinea, Indonesia | Unknown | None |
March
| Storm name | Dates active | Max wind km/h (mph) |
Pressure (hPa) |
Areas affected | Damage (USD) |
Deaths | Refs |
|---|---|---|---|---|---|---|---|
| Diwa | March 2–8 | 110 (70) | 980 | Réunion, St. Brandon, Mauritius | Major | 10 | |
| 01W (Basyang) | March 3–7 | 55 (35) | 1004 | Caroline Islands | None | None | [1] |
| 12 | March 4 | Unspecified | Unspecified | None | None | None | |
| TD | March 7–10 | Unspecified | 1004 | Philippines | None | None | |
| TD | March 11–12 | Unspecified | 1006 | Philippines, Vietnam | None | None | |
| 02Q | March 11–17 | Unspecified | Unspecified | None | None | None | |
| 14F | March 13–16 | Unspecified | Unspecified | None | None | None | |
| Wati | March 17–28 | 155 (100) | 950 | Vanuatu | Minor | None | |
| Larry | March 18–24 | 185 (115) | 940 | Queensland, Australia | $1.1 billion | 1 indirect | |
| Floyd | March 18–27 | 195 (120) | 916 | None | None | None | |
| Glenda | March 22–31 | 205 (125) | 910 | Australia | $965,000 | None | |
| TL | March 26–29 | 55 (35) | 994 | None | None | None |
April
April was relatively inactive in the year that 5 tropical cyclones formed throughout the month. 4 received names. Severe Tropical Cyclone Monica became the first Category 5-equivalent tropical cyclone in 2006, according to the Saffir-Simpson Hurricane Wind Scale (in 1-minute sustained winds). As being the strongest of the year 2006, it was the most intense of the month, peaking at 916 hPa/mbar. Extremely Severe Cyclonic Storm Mala was the strongest of the 2006 North Indian Ocean cyclone season, as well as the most serious. Moderate Tropical Storm/Tropical Cyclone Elia concluded the 2005-06 South-West Indian Ocean cyclone season when it dissipated on April 17. Monica was the last tropical cyclone in the Southern Hemisphere for the first half of 2006 (January–June).
| Storm name | Dates active | Max wind km/h (mph) |
Pressure (hPa) |
Areas affected | Damage (USD) |
Deaths | Refs |
|---|---|---|---|---|---|---|---|
| Hubert | April 5–7 | 95 (60) | 980 | Western Australia | None | None | |
| Elia | April 6–17 | 75 (45) | 990 | None | None | None | |
| Monica | April 16–28 | 250 (155) | 916 | Papua New Guinea, Australia | $5.1 million | None | |
| 17F | April 20–21 | Unspecified | Unspecified | None | None | None | |
| Mala | April 25–29 | 185 (115) | 954 | Andaman Islands, Myanmar, Northern Thailand | $6.7 million | 37 |
May
May was super inactive with only two tropical cyclones forming. Both received names. Typhoon Chanchu (Philippine name 'Caloy') was the stronger tropical cyclone of May 2006. Chanchu was the first tropical storm and typhoon of the 2006 Pacific typhoon season, and it was a very deadly and somewhat costly tropical cyclone. Tropical Storm Aletta started the 2006 Pacific hurricane season what it formed as Tropical Depression One-E on May 27.
| Storm name | Dates active | Max wind km/h (mph) |
Pressure (hPa) |
Areas affected | Damage (USD) |
Deaths | Refs |
|---|---|---|---|---|---|---|---|
| Chanchu (Caloy) | May 8–18 | 175 (110) | 930 | Caroline Islands, Philippines, China, Taiwan, Japan, Korea | $879 million | 309 | |
| Aletta | May 27–30 | 75 (45) | 1002 | None | Minimal | None |
June
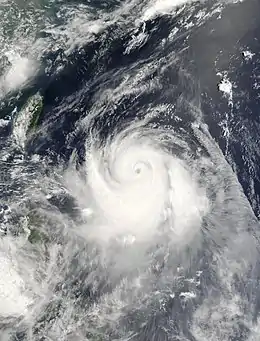
June was a very inactive month in the year when only four tropical cyclones formed within the northern hemisphere, three of them received names. Tropical Storm Alberto started the 2006 Atlantic hurricane season when it formed on June 10, preceding a below average season later in the year. When Tropical Depression Two-E dissipated on June 5, the 2006 Pacific hurricane season experienced a slightly long lull in activity, not seeing Hurricane Bud form until mid-July. Super Typhoon Ewiniar (Philippine name 'Ester') became the first super typhoon of the 2006 Pacific typhoon season, also causing heavy damage and 150+ fatalities.
| Storm name | Dates active | Max wind km/h (mph) |
Pressure (hPa) |
Areas affected | Damage (USD) |
Deaths | Refs |
|---|---|---|---|---|---|---|---|
| Two-E | June 3–5 | 55 (35) | 1005 | Southwestern Mexico, Western Mexico | None | None | |
| Alberto | June 10–14 | 110 (70) | 995 | Southeast United States, Atlantic Canada, Florida | $420 thousand | 2 | |
| Jelawat (Domeng) | June 24–29 | 75 (40) | 996 | Caroline Islands, Philippines, China | Unknown | 7 | |
| Ewiniar (Ester) | June 29 - July 10 | 185 (115) | 930 | Caroline Islands, Ryukyu Islands, Korea | $1.4 billion | 181 |
July
| Storm name | Dates active | Max wind km/h (mph) |
Pressure (hPa) |
Areas affected | Damage (USD) |
Deaths | Refs |
|---|---|---|---|---|---|---|---|
| BOB 02 | July 2–5 | 55 (35) | 982 | East India | Unknown | 123 | |
| Bilis (Florita) | July 8–16 | 110 (70) | 970 | Caroline Islands, Taiwan, China | $4.4 billion | 859 | |
| Bud | July 11–16 | 205 (125) | 953 | Hawaii | None | None | |
| Carlotta | July 12–16 | 140 (85) | 981 | None | None | None | |
| Daniel | July 16–26 | 240 (150) | 933 | Hawaii | None | None | |
| Kaemi (Glenda) | July 17–27 | 150 (90) | 950 | Caroline Islands, Mariana Islands, Taiwan, China | $450 million | 32 | |
| Unnamed | July 17–18 | 85 (50) | 998 | East Coast of the United States, Atlantic Canada | None | None | |
| Beryl | July 18–21 | 95 (60) | 1000 | Long Island, Massachusetts, Atlantic Canada | Minimal | None | |
| Emilia | July 21–28 | 100 (65) | 990 | Southwestern Mexico, Western Mexico, Baja California Peninsula, Southwestern United States | Minimal | None | |
| Prapiroon (Henry) | July 27– August 5 |
120 (75) | 970 | Caroline Islands, Mariana Islands, Taiwan, China | $984 million | 94 | |
| Fabio | July 31 – August 3 |
85 (50) | 1000 | None | None | None |
August
| Storm name | Dates active | Max wind km/h (mph) |
Pressure (hPa) |
Areas affected | Damage (USD) |
Deaths | Refs |
|---|---|---|---|---|---|---|---|
| Chris | August 1–4 | 100 (65) | 1001 | Leeward Islands, Puerto Rico, Turks & Caicos Islands, Hispaniola, Bahamas, Cuba | Minimal | None | |
| Gilma | August 1–3 | 65 (40) | 1004 | None | None | None | |
| BOB 03 | August 2–5 | 55 (35) | 986 | East India | Unknown | 251 | |
| Maria | August 3–10 | 130 (80) | 975 | Japan | None | 1 | |
| Saomai (Juan) | August 5–11 | 195 (120) | 925 | Caroline Islands, Mariana Islands, Ryukyu Islands, Taiwan, China | $2.5 billion | 458 | |
| Bopha (Inday) | August 5–10 | 100 (65) | 980 | Taiwan, China | None | 7 | |
| Wukong | August 12–21 | 95 (60) | 980 | Taiwan, China | None | 2 | |
| BOB 04 | August 12–13 | 45 (30) | 992 | East India | Unknown | 78 | |
| Sonamu | August 13–16 | 65 (40) | 992 | None | None | None | |
| Hector | August 15–23 | 175 (110) | 966 | None | None | None | |
| BOB 05 | August 16–18 | 45 (30) | 988 | East India | Unknown | 49 | |
| Ioke | August 20– September 7 |
260 (160) | 915 | Johnston Atoll, Wake Island, Minamitorishima, Alaska | $88 million | None | |
| Illeana | August 21–27 | 205 (125) | 951 | Socorro Island | Minimal | 1 | |
| Debby | August 21–26 | 85 (50) | 999 | Cape Verde | None | None | |
| 13W | August 23–25 | 55 (35) | 1000 | China | None | None | |
| Ernesto | August 24– September 1 |
120 (75) | 985 | Lesser Antilles, Puerto Rico, Hispaniola, Cuba, East Coast of the United States, Canada | $500 million | 11 | |
| John | August 28– September 4 |
215 (130) | 948 | Guerrero, Michoacán, Baja California Sur, Arizona, California, New Mexico, Texas | $60.9 million | 5 | |
| BOB 05 | August 29– September 1 |
45 (30) | 990 | East India | Unknown | 9 | |
| Kristy | August 30– September 8 |
130 (80) | 985 | None | None | None |
September
| Storm name | Dates active | Max wind km/h (mph) |
Pressure (hPa) |
Areas affected | Damage (USD) |
Deaths | Refs |
|---|---|---|---|---|---|---|---|
| Florence | September 3–13 | 150 (90) | 974 | Bermuda, Newfoundland, East Coast of the United States, Canada | $200 thousand | None | |
| BOB 07 | September 3–4 | 45 (30) | 992 | Odisha | Unknown | 78 | |
| Shanshan (Luis) | September 9–18 | 205 (125) | 919 | Philippines, Taiwan, China, Korea | $2.5 billion | 11 | |
| Gordon | September 10–20 | 195 (120) | 955 | Azores, Iberian Peninsula, British Isles | $3.8 million | None | |
| Helene | September 12–24 | 195 (120) | 955 | British Isles | None | None | |
| 15W | September 12–15 | 55 (35) | 1004 | China | None | None | |
| Lane | September 13–17 | 205 (125) | 952 | Mexico, Southwestern United States | $203 million | 4 | |
| Miriam | September 16–18 | 75 (45) | 999 | None | None | None | |
| Unnamed | September 16–18 | 95 (60) | Unspecified | None | None | None | |
| Yagi | September 16–25 | 195 (120) | 910 | Japan | None | None | |
| Two-C | September 19–20 | 55 (35) | 1007 | None | None | None | |
| LAND 01 | September 21–24 | 45 (30) | 996 | East India, Bangladesh | Unknown | 98 | |
| Mukda | September 21–24 | 100 (65) | 988 | Gujarat | Unknown | None | |
| 17W | September 22–25 | 55 (35) | 996 | Vietnam, Laos | None | None | |
| Querida | September 25–27 | Unspecified | 986 | Atlas Mountains, Salento, Apulia | None | None | |
| Xangsane (Milenyo) | September 25 – October 2 |
155 (100) | 940 | Philippines, Vietnam, Laos, Cambodia, Thailand | $750 million | 318 | |
| Three-C | September 26–27 | 65 (35) | 1008 | None | None | None | |
| Isaac | September 27 – October 2 |
140 (85) | 985 | Newfoundland | Minimal | None | |
| BOB 08 | September 28–30 | 45 (30) | 1002 | Odisha | Unknown | None | |
| Bebinca | September 28 – October 6 |
95 (60) | 980 | Mariana Islands | None | 33 | |
October
| Storm name | Dates active | Max wind km/h (mph) |
Pressure (hPa) |
Areas affected | Damage (USD) |
Deaths | Refs |
|---|---|---|---|---|---|---|---|
| Rumbia |
November
| Storm name | Dates active | Max wind km/h (mph) |
Pressure (hPa) |
Areas affected | Damage (USD) |
Deaths | Refs |
|---|---|---|---|---|---|---|---|
| 03F |
December
| Storm name | Dates active | Max wind km/h (mph) |
Pressure (hPa) |
Areas affected | Damage (USD) |
Deaths | Refs |
|---|---|---|---|---|---|---|---|
| Utor (Seniang) |
Global effects
| Season name | Areas affected | Systems formed | Named storms | Damage (USD) | Deaths |
|---|---|---|---|---|---|
| 2006 Atlantic hurricane season | 10 | 9 | |||
| 2006 Pacific hurricane season | 25 | ||||
| 2006 Pacific typhoon season | 40 | ||||
| 2006 North Indian Ocean cyclone season | 12 | 3 | |||
| 2005–06 Australian region cyclone season | 15 | ||||
| 2006–07 Australian region cyclone season | 1 | ||||
| 2005–06 South-West Indian Ocean cyclone season | 6 | ||||
| 2006–07 South-West Indian Ocean cyclone season | 5 | ||||
| 2005–06 South Pacific cyclone season | 12 | ||||
| 2006–07 South Pacific cyclone season | 6 | ||||
| Worldwide | (See above) | 132 | |||
Notes
1 Only systems that formed either on or after January 1, 2007 are counted in the seasonal totals.
2 Only systems that formed either before or on December 31, 2007 are counted in the seasonal totals.
3 The wind speeds for this tropical cyclone/basin are based on the IMD Scale which uses 3-minute sustained winds.
4 The wind speeds for this tropical cyclone/basin are based on the Saffir Simpson Scale which uses 1-minute sustained winds.
5The wind speeds for this tropical cyclone are based on Météo-France which uses gust winds.
References
- "Navy/NRL Tropical Cyclone Page". Nrlmry.navy.mil. September 23, 2010. Archived from the original on August 29, 2012. Retrieved October 19, 2010.
External links
| Tropical cyclone year articles (2000–2009) |
|---|
| 2000, 2001, 2002, 2003, 2004, 2005, 2006, 2007, 2008, 2009 |
Regional Specialized Meteorological Centers
- US National Hurricane Center – North Atlantic, Eastern Pacific
- Central Pacific Hurricane Center – Central Pacific
- Japan Meteorological Agency – NW Pacific
- India Meteorological Department – Bay of Bengal and the Arabian Sea
- Météo-France – La Reunion – South Indian Ocean from 30°E to 90°E
- Fiji Meteorological Service – South Pacific west of 160°E, north of 25° S
Tropical Cyclone Warning Centers
- Meteorology, Climatology, and Geophysical Agency of Indonesia – South Indian Ocean from 90°E to 141°E, generally north of 10°S
- Australian Bureau of Meteorology (TCWC's Perth, Darwin & Brisbane) – South Indian Ocean & South Pacific Ocean from 90°E to 160°E, generally south of 10°S
- Papua New Guinea National Weather Service – South Pacific Ocean from 141°E to 160°E, generally north of 10°S
- Meteorological Service of New Zealand Limited – South Pacific west of 160°E, south of 25°S
![]() This article incorporates public domain material from websites or documents of the National Weather Service.
This article incorporates public domain material from websites or documents of the National Weather Service.
