Tropical cyclones in 2005
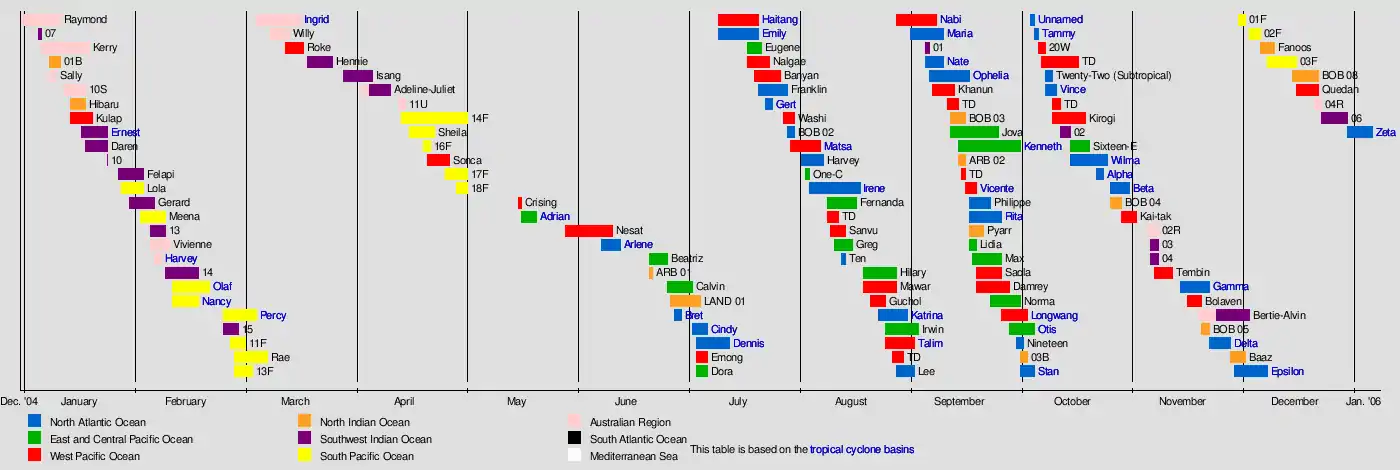
During 2005, tropical cyclones formed within seven different tropical cyclone basins, located within various parts of the Atlantic, Pacific and Indian Oceans. During the year, a total of 141 systems formed with 94 of these developing further and were named by the responsible warning centre. The strongest tropical cyclone of the year was Hurricane Wilma, which was estimated to have a minimum barometric pressure of 882 hPa (26.05 inHg).
| Tropical cyclones in 2005 | |
|---|---|
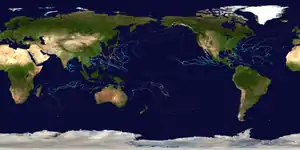 Year summary map | |
| Year boundaries | |
| First system | 07 |
| Formed | January 4, 2005 |
| Last system | Zeta |
| Dissipated | January 6, 2006 |
| Strongest system | |
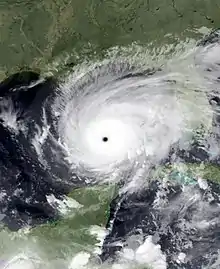
| Name | Wilma |
| Lowest pressure | 882 mbar/hPa; 26.05 inHg |
| Longest lasting system | |
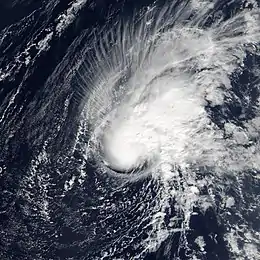
| Name | Kenneth |
| Duration | 16 days |
| Year statistics | |
| Total systems | 141 |
| Named systems | 94 |
| Total fatalities | 4,903 total |
| Total damage | $181.591 billion (2005 USD) |
The 2005 was above-average in terms of the number of storms. The most active basin in the year was the North Atlantic, which documented 28 named systems. The Western Pacific had an near-average season with 23 named storms. The Eastern Pacific hurricane season experienced an above average number of tropical storm intensity systems, numbering 15. Activity across the southern hemisphere's three basins - South-West Indian, Australian, and South Pacific - was fairly significant, with the regions recording 23 named storms altogether, with the most intense Southern Hemisphere cyclone of the year, Cyclone Percy from the South Pacific Ocean basin peaking at 145 mph (230 km/h) and 900 millibars.
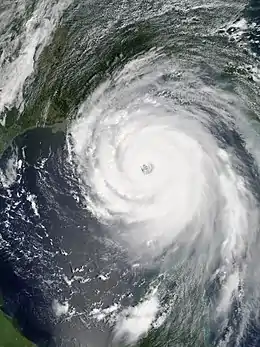
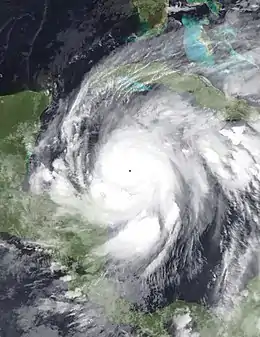
The deadliest and costliest tropical cyclone of the year was Hurricane Katrina in the North Atlantic Ocean, which killed at least 1,800 people in New Orleans and the surrounding areas; Katrina caused more than $125 billion in damage after striking United States, the costliest tropical cyclone on record, tying with Hurricane Harvey in 2017.
Summary
North Atlantic Ocean
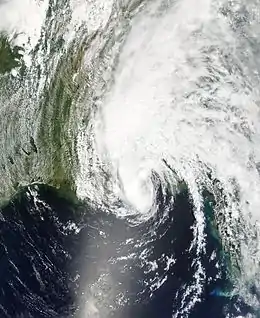
The activity was the most active Atlantic hurricane season in recorded history at the time, shattering numerous records, with 31 tropical or subtropical cyclones recorded. The United States National Hurricane Center[nb 1] named 27 storms, exhausting the annual pre-designated list and resulting in the usage of six Greek letter names. A record 15 storms attained hurricane status, with maximum sustained winds of at least 74 mph (119 km/h); of those, a record seven became major hurricanes, which are a Category 3 or higher on the Saffir-Simpson scale. The season's impact was widespread and catastrophic. Its storms caused an estimated 3,912 deaths and approximately $171.7 billion in damage. It was the costliest season on record at the time, until its record was surpassed 12 years later. It also produced the second-highest accumulated cyclone energy (ACE) in the Atlantic basin, surpassed only by the 1933 season. The season officially began on June 1, 2005, and the first storm – Arlene – developed on June 8. Hurricane Dennis in July inflicted heavy damage to Cuba. Hurricane Stan in October was part of a broader weather system that killed 1,668 people and caused $3.96 billion in damage to eastern Mexico and Central America, with Guatemala hit the hardest. The final storm – Zeta – formed in late December and lasted until January 6, 2006.
Eastern Pacific Ocean
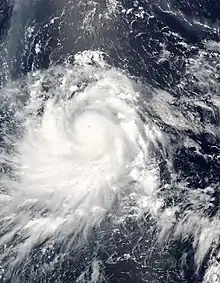
The activity continued the trend of generally below-average activity that began a decade prior. The season's first tropical cyclone, Adrian, developed on May 17 and reached its peak as a Category 1 hurricane. Named storms are infrequent in May, with one tropical storm every two years and a hurricane once every four years.[2] At the time, Adrian was the fourth earliest tropical cyclone to form in the eastern Pacific since reliable record-keeping began in 1971. Activity throughout the remainder of the season was far less notable, with 16 tropical cyclones, 15 named storms, 7 hurricanes, and 2 major hurricanes. The long-term 1971–2004 average suggests an average season to feature 15 named storms, 9 hurricanes, and 4 major hurricanes. October in particular was notably quiet, with the formation of only one tropical depression; only three other seasons, 1989, 1995, and 1996, ended the month without the designation of a named storm.[3]
Western Pacific Ocean
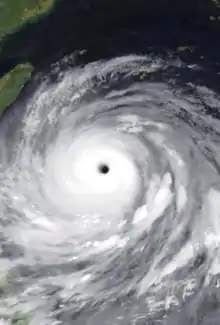
Although the season was quiet, some typhoons caused extensive damages in many places, especially in China where eight typhoons struck the country. First, Typhoon Haitang became the strongest storm in the basin this year and caused about $1.1 billion in damages in Taiwan and China in mid July. In August, Typhoon Matsa made landfall in Eastern China and caused about $2.23 billion in damages. Later that same month, two powerful typhoons made landfall, causing extreme damage and some casualties. Similar to Haitang, Typhoon Longwang made landfall in Taiwan and China at a strong intensity causing damages. The season also marked the first time the Atlantic hurricane season was more active than the Pacific typhoon season (the others being 2010 and 2020). However, the 2005 Atlantic hurricane season featured record high activity while the Pacific typhoon season featured near average activity.
North Indian Ocean
There were a total of 12 depressions during the year, three less than normal, although the highest since 1992. The IMD named four cyclonic storms, a process they initiated in 2004, which was also below normal. No systems strengthened beyond cyclonic storm status. The season was the sixth in a row with below normal activity, based on the seasonal accumulated cyclone energy. Storms generally develop when the monsoon trough is located over tropical waters, with a peak from May to June and another peak in November.[4] The monsoon developed 11 distinct low pressure areas by the end of September, including five monsoon depressions,[5] and the monsoon season was more active than usual.
Systems
January
| Storm name | Dates active | Max wind km/h (mph) |
Pressure (hPa) |
Areas affected | Damage (USD) |
Deaths | Refs |
|---|---|---|---|---|---|---|---|
| 07 | January 4–5 | Mozambique, Madagascar | None | None | |||
| Sally | January 7 – 9 | 95 (60) | 985 | None | None | None | |
| 01B | January 8 – 10 | 55 (35) | 1000 | None | None | None | |
| Kerry | January 8 – 14 | 140 (90) | 955 | None | None | None | |
| 10S | January 11 – 17 | 55 (35) | 998 | None | None | None | |
| Hibaru | January 13 – 17 | 65 (40) | 1000 | None | None | None | |
| Kulap | January 13 – 19 | 95 (50) | 985 | Caroline Islands | None | None | |
| Ernest | January 16 – 23 | 165 (105) | 950 | Madagascar | Minimal | 78 | |
| Daren | January 17 – 23 | 95 (60) | 986 | None | None | None | |
| Tim | January 23 – 25 | 85 (50) | 990 | None | None | None | |
| Felapi | January 26 – February 3 | 65 (40) | 995 | Madagascar | None | None | |
| Lola | January 27 – February 2 | 75 (45) | 990 | None | None | None | |
| Gerard | January 29 – February 5 | 115 (70) | 973 | None | None | None |
February
| Storm name | Dates active | Max wind km/h (mph) |
Pressure (hPa) |
Areas affected | Damage (USD) |
Deaths | Refs |
|---|---|---|---|---|---|---|---|
| Meena | February 1 – 8 | 215 (130) | 915 | Cook Islands | $20 million | None | |
| Harvey | February 3 – 8 | 140 (90) | 967 | Northern Territory, Queensland | $797 000 | None | |
| Vivienne | February 4 – 9 | 65 (40) | 990 | None | None | None | |
| Olaf | February 10 – 20 | 215 (130) | 915 | Samoan Islands, Cook Islands | $10 million | None | |
| Nancy | February 10 – 17 | 175 (110) | 935 | Samoan Islands, Cook Islands | None | None | |
| Percy | February 24 – March 5 | 230 (145) | 900 | Tokelau, Samoan Islands, Cook Islands | $25 million | None | |
| 11F | February 26 – 27 | 55 (35) | 998 | French Polynesia | None | None | |
| Rae | February 27 – March 6 | 75 (45) | 990 | None | None | None | |
| 13F | February 27 – March 4 | Not Specified | 1001 | None | None | None |
March
| Storm name | Dates active | Max wind km/h (mph) |
Pressure (hPa) |
Areas affected | Damage (USD) |
Deaths | Refs |
|---|---|---|---|---|---|---|---|
| Ingrid | March 4 – 16 | 230 (140) | 924 | Papua New Guinea, Northern Australia | $14.4 million | 5 | |
| Willy | March 8 – 14 | 140 (85) | 960 | None | None | None | |
| Roke (Auring) | March 13 – 19 | 100 (65) | 980 | Caroline Islands, Philippines | $166 thousand | 7 | |
| Hennie | March 19 – 26 | 100 (65) | 978 | Mauritius, Réunion | None | None | |
| Isang | March 29 – April 6 | 115 (75) | 970 | None | None | None |
April
| Storm name | Dates active | Max wind km/h (mph) |
Pressure (hPa) |
Areas affected | Damage (USD) |
Deaths | Refs |
|---|---|---|---|---|---|---|---|
| Adeline–Juliet | April 2 – 11 | 220 (140) | 905 | Cocos (Keeling) Islands | Minimal | None | |
| 11U | April 13 – 15 | Not Specified | 990 | Papua New Guinea | None | None | |
| 11F | April 14 – May 1 | 55 (35) | 1000 | None | None | None | |
| Sheila | April 20 – 22 | 75 (45) | 990 | None | None | None | |
| 16F | April 20 – 22 | Not specified | 1000 | Niue | None | None | |
| Sonca (Bising) | April 21 – 27 | 165 (105) | 935 | Caroline Islands | None | None | |
| 17F | April 26 – May 1 | Not specified | 1007 | None | None | None | |
| 18F | April 29 – May 1 | Not specified | 1006 | None | None |
May
| Storm name | Dates active | Max wind km/h (mph) |
Pressure (hPa) |
Areas affected | Damage (USD) |
Deaths | Refs |
|---|---|---|---|---|---|---|---|
| Crising | May 16 – 17 | Not Specified | 1008 | Philippines | None | None | |
| Adrian | May 17 – 21 | 130 (80) | 982 | Central America | $12 million | 5 | |
| Nesat (Dante) | May 29 – June 11 | 175 (110) | 930 | Caroline Islands | None | None |
June
| Storm name | Dates active | Max wind km/h (mph) |
Pressure (hPa) |
Areas affected | Damage (USD) |
Deaths | Refs |
|---|---|---|---|---|---|---|---|
| Arlene | June 8 – 13 | 110 (70) | 989 | Cayman Islands, Cuba, Florida | $11.8 million | 1 | |
| ARB 01 | June 21 – 22 | 45 (30) | 992 | Gujarat | None | None | |
| Beatriz | June 21 – 24 | 85 (50) | 1000 | None | None | None | |
| Calvin | June 26 – 29 | 85 (50) | 1000 | Mexico | Minimal | None | |
| LAND 01 | June 27 – July 5 | 45 (30) | 990 | India | Unknown | 26 | |
| Bret | June 28 – 30 | 65 (40) | 1002 | Mexico | $9.2 million | 2 |
July
| Storm name | Dates active | Max wind km/h (mph) |
Pressure (hPa) |
Areas affected | Damage (USD) |
Deaths | Refs |
|---|---|---|---|---|---|---|---|
| Cindy | July 3 – 7 | 120 (75) | 991 | Yucatán Peninsula, East Coast of the United States | $320 million | 3 | |
| Dora | July 4 – 6 | 75 (45) | 1002 | Mexico | Minimal | None | |
| Dennis | July 4 – 13 | 240 (150) | 930 | Windward Islands, Greater Antilles, Gulf Coast of the United States, Great Lakes region | $4.26 billion | 88 | |
| Emong | July 4 – 7 | Not Specified | 1004 | Philippines China | None | None | |
| Haitang (Feria) | July 10 – 21 | 195 (120) | 920 | Mariana Islands, Ryukyu Islands, Taiwan, China | $1.1 billion | 13 | |
| Emily | July 11 – 21 | 260 (160) | 929 | Lesser Antilles, Greater Antilles, South America, Yucatán Peninsula, Mexico, Texas | $1.01 billion | 17 | |
| Eugene | July 18 – 20 | 110 (70) | 989 | Baja California Peninsula | Minimal | 1 | |
| Nalgae | July 18 – 24 | 85 (50) | 990 | None | None | None | |
| Banyan | July 20 – 27 | 100 (65) | 975 | Japan | None | None | |
| Franklin | July 21 – 29 | 110 (70) | 997 | The Bahamas, Bermuda, Newfoundland and Labrador | None | None | |
| Gert | July 23 – 25 | 75 (45) | 1005 | Central America | $6 million | 1 | |
| Washi | July 28 – 31 | 85 (50) | 985 | China, Vietnam | None | None | |
| BOB 02 | July 29 – 31 | 55 (35) | 988 | India | Unknown | 1 | |
| Matsa (Gorio) | July 30 – August 8 | 150 (90) | 950 | Taiwan, China, Korea | $2.23 billion | 29 |
August
| Storm name | Dates active | Max wind km/h (mph) |
Pressure (hPa) |
Areas affected | Damage (USD) |
Deaths | Refs |
|---|---|---|---|---|---|---|---|
| Harvey | August 2 – 8 | 100 (65) | 994 | Bermuda | None | None | |
| One-C | August 3 – 4 | 45 (30) | 1008 | None | None | None | |
| Irene | August 4 – 18 | 165 (105) | 970 | East Coast of the United States | None | 1 | |
| TD | August 9 – 12 | Not specified | 996 | China, Vietnam, Laos | None | None | |
| Fernanda | August 9 – 16 | 140 (85) | 978 | None | None | None | |
| Sanvu (Huaning) | August 9 – 14 | 95 (60) | 985 | Philippines Taiwan, China | None | None | |
| Greg | August 11 – 15 | 85 (50) | 1000 | None | None | None | |
| Ten | August 13 – 14 | 55 (35) | 1008 | None | None | None | |
| Ghuchol | August 18 – 25 | 100 (65) | 980 | None | None | None | |
| Mawar | August 19 – 27 | 175 (110) | 930 | Japan | None | 2 | |
| Hilary | August 19 – 25 | 165 (105) | 970 | None | None | None | |
| Jose | August 22 – 23 | 95 (65) | 998 | Mexico | $45 million | 16 | |
| Katrina | August 23 – 30 | 280 (175) | 902 | The Bahamas, Florida, Gulf Coast of the United States | $125 billion | 1,836 | |
| Irwin | August 25 – 28 | 85 (50) | 1000 | Mexico | None | None | |
| Talim (Isang) | August 25 – September 2 | 175 (110) | 925 | Taiwan, China | $1.5 billion | 150 | |
| TD | August 27 – 31 | Not Specified | 1000 | China, Vietnam, Laos | None | None | |
| Lee | August 28 – September 3 | 65 (40) | 1006 | None | None | None | |
| Nabi (Jolina) | August 28 – September 8 | 175 (110) | 925 | Caroline Islands, Mariana Islands, Korea, Japan, Russia, Alaska | $972 million | 35 |
September
| Storm name | Dates active | Max wind km/h (mph) |
Pressure (hPa) |
Areas affected | Damage (USD) |
Deaths | Refs |
|---|---|---|---|---|---|---|---|
| Maria | September 1 – 10 | 185 (115) | 962 | Iceland, Scotland | $3.1 million | 3 | |
| Nate | September 5 – 10 | 150 (90) | 979 | Bermuda, Azores | None | 1 | |
| Ophelia | September 6 – 17 | 140 (85) | 976 | The Bahamas, Florida, East Coast of the United States, Atlantic Canada, Europe | $70 million | 3 | |
| Khanun (Kiko) | September 6 – 12 | 155 (100) | 945 | Caroline Islands, Taiwan, China, Korea | $849 million | 14 | |
| TD | September 11 – 14 | Not Specified | 998 | Vietnam, Cambodia, Thailand | None | None | |
| Jova | September 12 – 25 | 205 (125) | 951 | None | None | None | |
| BOB 03 | September 12 – 16 | 45 (30) | 992 | India | Unknown | 6 | |
| ARB 02 | September 14 – 16 | 45 (30) | 996 | Gujarat | Unknown | 13 | |
| Kenneth | September 14 – 30 | 215 (130) | 947 | Hawaii | None | None | |
| TD | September 15 – 16 | Not Specified | 1004 | Philippines | None | None | |
| Vicente | September 16 – 19 | 85 (50) | 985 | Philippines China, Vietnam, Laos, Thailand | $3.48 million | 22 | |
| Philippe | September 17 – 23 | 130 (80) | 986 | Bermuda | Minimal | None | |
| Lidia | September 17 – 19 | 65 (40) | 1005 | None | None | None | |
| Pyarr | September 17 – 21 | 65 (40) | 988 | India, Bangladesh | $11.4 million | 84 | |
| Max | September 18 – 22 | 140 (85) | 981 | None | None | None | |
| Rita | September 18 – 26 | 285 (180) | 895 | Hispaniola, The Bahamas, Cuba, Florida, Gulf Coast of the United States, Midwestern United States | $18.5 billion | 120 | |
| Saola | September 19 – 26 | 150 (90) | 950 | Japan | None | None | |
| Damrey (Labuyo) | September 19 – 28 | 150 (90) | 955 | Philippines Taiwan, China, Vietnam, Laos, Thailand | $750 million | 48 | |
| Norma | September 23 – 27 | 95 (60) | 997 | None | None | None | |
| Longwang (Maring) | September 25 – October 3 | 175 (110) | 930 | Ryukyu Islands, Taiwan, China | $971 million | 149 | |
| Otis | September 28 – October 3 | 165 (105) | 970 | Baja California Peninsula | Minimal | None | |
| Nineteen | September 30 – October 2 | 55 (35) | 1006 | None | None | None |
October
| Storm name | Dates active | Max wind km/h (mph) |
Pressure (hPa) |
Areas affected | Damage (USD) |
Deaths | Refs |
|---|---|---|---|---|---|---|---|
| Stan | October 1 – 5 | 130 (80) | 977 | Central America, Mexico | $2.70 billion | 1,669 | |
| 03B | October 1 – 3 | 75 (45) | 994 | India, Bangladesh | Unknown | 16 | |
| Unnamed | October 4 – 5 | 85 (50) | 997 | Azores | None | None | |
| Tammy | October 5 – 6 | 85 (50) | 1001 | The Bahamas, Florida | $30 million | 10 | |
| 20W | October 6–8 | Not specified | 1006 | Vietnam, Cambodia, Laos | None | None | |
| Twenty-Two | October 8 – 10 | 55 (35) | 1008 | Bermuda, New England | Minimal | None | |
| Vince | October 8 – 11 | 120 (75) | 988 | Madeira Island, Portugal, Spain | Minimal | None | |
| TD | October 7 – 17 | Not Specified | 1004 | None | None | None | |
| Kirogi (Nando) | October 9 – 19 | 185 (115) | 930 | None | None | None | |
| TD | October 10 – 12 | Not specified | 1004 | None | None | None | |
| Wilma | October 15 – 26 | 185 (295) | 882 | Jamaica, Central America, Yucatán Peninsula, Cuba, Florida, The Bahamas, Atlantic Canada | $20.3 billion | 48 | |
| Sixteen-E | October 15 – 20 | 55 (35) | 1005 | None | None | None | |
| Alpha | October 22 – 24 | 85 (50) | 998 | Hispaniola, The Bahamas | Unknown | 26 | |
| BOB 04 | October 26 – 29 | 55 (35) | 998 | India | Unknown | 105 | |
| Beta | October 26 – 31 | 185 (115) | 962 | Central America, Colombia | $15.5 million | 9 | |
| Kai-tak | October 28 – November 2 | 150 (90) | 950 | Vietnam, China | $11 million | 19 |
November

| Storm name | Dates active | Max wind km/h (mph) |
Pressure (hPa) |
Areas affected | Damage (USD) |
Deaths | Refs |
|---|---|---|---|---|---|---|---|
| 02R | November 5 – 8 | 55 (35) | 995 | None | None | None | |
| Tembin (Ondoy) | November 7 – 12 | 65 (40) | 1002 | Caroline Islands, Philippines | None | None | |
| Bolaven (Pepeng) | November 14 – 20 | 100 (65) | 985 | Philippines | None | None | |
| Gamma | November 14 – 21 | 85 (50) | 1002 | Lesser Antilles, Central America | $18 million | 39 | |
| BOB 05 | November 20 – 22 | 45 (30) | 1002 | Sri Lanka, India | None | None | |
| Delta | November 22 – 28 | 110 (70) | 980 | Canary Islands, North Africa | $362 million | 19 | |
| Bertie-Alvin | November 19 – December 3 | 185 (115) | 928 | None | None | None | |
| Baaz | November 28 – December 2 | 85 (50) | 998 | Thailand, India | $11 million | 22 | |
| Epsilon | November 29 – December 8 | 140 (85) | 981 | None | None | None | |
| 01F | November 30 – December 2 | Not Specified | 1004 | None | None | None |
December
| Storm name | Dates active | Max wind km/h (mph) |
Pressure (hPa) |
Areas affected | Damage (USD) |
Deaths | Refs |
|---|---|---|---|---|---|---|---|
| 02F | December 3 – 6 | Not Specified | 1002 | None | None | None | |
| Fanoos | December 6 – 10 | 85 (50) | 998 | India, Sri Lanka | Unknown | None | |
| BOB 08 | December 15 – 22 | 55 (36) | 1000 | India | None | None | |
| 25W (Quedan) | December 16 – 22 | 55 (35) | 1000 | Philippines Vietnam | None | None | |
| 04R | December 21 – 23 | 55 (35) | 998 | None | None | None | |
| Zeta | December 30 – January 6 | 100 (65) | 994 | None | None | None |
Global effects
- The sum of the number of systems and fatalities in each basin will not equal the number shown as the total. This is because when systems move between basins, it creates a discrepancy in the actual number of systems and fatalities.
Notes
- The United States National Hurricane Center is the official Regional Specialized Meteorological Center for the North Atlantic basin.[1]
1 Only systems that formed either on or after January 1, 2005 are counted in the seasonal totals.
2 Only systems that formed either before or on December 31, 2005 are counted in the seasonal totals.
3 The wind speeds for this tropical cyclone/basin are based on the IMD Scale which uses 3-minute sustained winds.
4 The wind speeds for this tropical cyclone/basin are based on the Saffir Simpson Scale which uses 1-minute sustained winds.
5The wind speeds for this tropical cyclone are based on Météo-France which uses gust winds.
References
- Worldwide Tropical Cyclone Centers (Report). National Hurricane Center. 2011-09-11. Archived from the original on March 21, 2015. Retrieved March 19, 2020.
- Richard D. Knabb; James L. Franklin (June 1, 2005). Monthly Tropical Weather Summary: May (Report). Miami, Florida: National Hurricane Center. Retrieved April 25, 2017.
- Stacy R. Stewart; John L. Beven II; James L. Franklin (November 1, 2005). Monthly Tropical Weather Summary: October (Report). National Hurricane Center. Retrieved April 27, 2017.
- H.J. Diamond; K.A. Shein (June 2006). "The Tropics" (PDF). Bureau of the American Meteorological Society. Retrieved 2015-06-30.
- Government of India (2005-10-05). "India Meteorological Department southwest monsoon 2005 end-of-season report". ReliefWeb. Retrieved 2015-06-30.
External links
| Tropical cyclone year articles (2000–2009) |
|---|
| 2000, 2001, 2002, 2003, 2004, 2005, 2006, 2007, 2008, 2009 |
Regional Specialized Meteorological Centers
- US National Hurricane Center – North Atlantic, Eastern Pacific
- Central Pacific Hurricane Center – Central Pacific
- Japan Meteorological Agency – NW Pacific
- India Meteorological Department – Bay of Bengal and the Arabian Sea
- Météo-France – La Reunion – South Indian Ocean from 30°E to 90°E
- Fiji Meteorological Service – South Pacific west of 160°E, north of 25° S
Tropical Cyclone Warning Centers
- Meteorology, Climatology, and Geophysical Agency of Indonesia – South Indian Ocean from 90°E to 141°E, generally north of 10°S
- Australian Bureau of Meteorology (TCWC's Perth, Darwin & Brisbane) – South Indian Ocean & South Pacific Ocean from 90°E to 160°E, generally south of 10°S
- Papua New Guinea National Weather Service – South Pacific Ocean from 141°E to 160°E, generally north of 10°S
- Meteorological Service of New Zealand Limited – South Pacific west of 160°E, south of 25°S
![]() This article incorporates public domain material from websites or documents of the National Weather Service.
This article incorporates public domain material from websites or documents of the National Weather Service.