Villa Altagracia
Villa Altagracia is a municipality (municipio) of the San Cristóbal province in the Dominican Republic. Within the municipality there are three municipal districts (distritos municipal): La Cuchilla, Medina and San José del Puerto.[3]
Villa Altagracia | |
|---|---|
 Seal | |
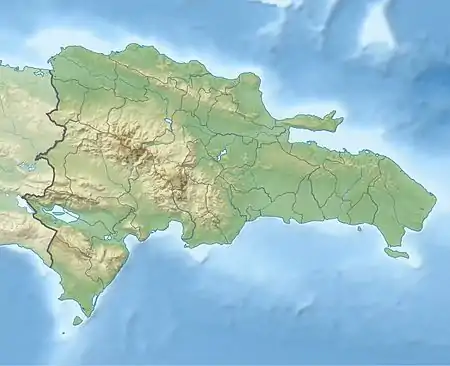 Villa Altagracia Villa Altagracia in the Dominican Republic | |
| Coordinates: 18°40′12″N 70°10′12″W | |
| Country | |
| Province | San Cristóbal |
| Area | |
| • Total | 482.05 km2 (186.12 sq mi) |
| Population (2012)[2] | |
| • Total | 169,655 |
| • Density | 350/km2 (910/sq mi) |
| Municipal Districts | 3 |
Climate
The climate is hot, oppressive and partly cloudy. The temperature over a year varies from 65° to 89° and rarely falls below 62° or above 92°.
Clouds
With temperature that remains consistent year round, the variant between seasons is the cloud coverage. The clearer part of the year spans from November to May followed by the cloudier season starting and May and into November.
Rain
A wet day in Villa Altagracia requires 0.04 inches of liquid in precipitation. The wetter season lasts from late April to November, with 15% or more chance of being a wet day.
Humidity
The muggier season lasts for nearly 10 months, from mid March to Mid January. The comfort level is muggy at least 79% of the time.
Wind
The windier season takes place from early November into Mid May. The average wind speed during this time is 6.9 mph.
| Climate data for Villa Altagracia (1961–1990) | |||||||||||||
|---|---|---|---|---|---|---|---|---|---|---|---|---|---|
| Month | Jan | Feb | Mar | Apr | May | Jun | Jul | Aug | Sep | Oct | Nov | Dec | Year |
| Record high °C (°F) | 34.4 (93.9) |
38.0 (100.4) |
35.0 (95.0) |
36.0 (96.8) |
38.0 (100.4) |
38.2 (100.8) |
38.0 (100.4) |
38.0 (100.4) |
38.0 (100.4) |
38.0 (100.4) |
35.3 (95.5) |
35.0 (95.0) |
38.2 (100.8) |
| Average high °C (°F) | 29.4 (84.9) |
29.6 (85.3) |
30.4 (86.7) |
30.8 (87.4) |
30.9 (87.6) |
31.1 (88.0) |
31.5 (88.7) |
31.5 (88.7) |
31.8 (89.2) |
31.5 (88.7) |
30.6 (87.1) |
29.5 (85.1) |
30.7 (87.3) |
| Average low °C (°F) | 19.2 (66.6) |
19.0 (66.2) |
19.1 (66.4) |
19.5 (67.1) |
20.1 (68.2) |
20.6 (69.1) |
20.7 (69.3) |
20.9 (69.6) |
20.7 (69.3) |
20.5 (68.9) |
20.3 (68.5) |
19.6 (67.3) |
20.0 (68.0) |
| Record low °C (°F) | 12.5 (54.5) |
12.0 (53.6) |
12.0 (53.6) |
12.5 (54.5) |
12.0 (53.6) |
17.0 (62.6) |
17.0 (62.6) |
17.0 (62.6) |
17.0 (62.6) |
15.5 (59.9) |
13.5 (56.3) |
6.8 (44.2) |
6.8 (44.2) |
| Average rainfall mm (inches) | 86.2 (3.39) |
91.3 (3.59) |
119.3 (4.70) |
156.8 (6.17) |
240.0 (9.45) |
239.8 (9.44) |
245.5 (9.67) |
291.1 (11.46) |
250.5 (9.86) |
270.4 (10.65) |
172.8 (6.80) |
105.8 (4.17) |
2,269.5 (89.35) |
| Average rainy days (≥ 1.0 mm) | 9.8 | 8.1 | 8.9 | 10.1 | 15.0 | 13.7 | 15.2 | 15.8 | 15.3 | 15.2 | 12.7 | 10.7 | 150.5 |
| Source: NOAA[5] | |||||||||||||
References
- Superficies a nivel de municipios, Oficina Nacional de Estadistica Archived April 17, 2009, at the Wayback Machine
- Censo 2012 de Población y Vivienda, Oficina Nacional de Estadistica
- Oficina Nacional de Estadistica, Departamento de Cartografia, Division de Limites y Linderos. "Listado de Codigos de Provincias, Municipio y Distritos Municipales, Actualizada a Junio 20 del 2006" (in Spanish). Archived from the original on August 3, 2007. Retrieved 2007-01-24.CS1 maint: multiple names: authors list (link)
- This data is based on a statistical analysis of historic data from January 1980 to December 2016.
- "V. Altagracia Climate Normals 1961-1990". National Oceanic and Atmospheric Administration. Retrieved September 21, 2016.
- News about Villa Altagracia Dominican Republic
- https://weatherspark.com/y/26718/Average-Weather-in-Villa-Altagracia-Dominican-Republic-Year-Round