1980 Portuguese legislative election
The Portuguese legislative election of 1980 took place on 5 October. The election renewed all 250 members of the Assembly of the Republic.
| |||||||||||||||||||||||||||||||||||||||||||||||||
250 seats to the Portuguese Assembly 125 seats needed for a majority | |||||||||||||||||||||||||||||||||||||||||||||||||
|---|---|---|---|---|---|---|---|---|---|---|---|---|---|---|---|---|---|---|---|---|---|---|---|---|---|---|---|---|---|---|---|---|---|---|---|---|---|---|---|---|---|---|---|---|---|---|---|---|---|
| Registered | 7,179,023 | ||||||||||||||||||||||||||||||||||||||||||||||||
| Turnout | 6,026,395 (83.9%) | ||||||||||||||||||||||||||||||||||||||||||||||||
| |||||||||||||||||||||||||||||||||||||||||||||||||
 Results by district or autonomous region PSD ran alone in the Azores and Madeira. PS ran alone in the Azores, Madeira, Europe and Rest of the World. | |||||||||||||||||||||||||||||||||||||||||||||||||
| |||||||||||||||||||||||||||||||||||||||||||||||||
.jpg.webp)
.jpg.webp)
.jpg.webp)
In January 1980, the Democratic Alliance, which had won the previous election, on 2 December 1979, entered office with Francisco Sá Carneiro leading the government. However, this election was an extraordinary election, and so, in 1980, another election was held.
Electoral system
The Assembly of the Republic has 250 members elected to four-year terms. Governments do not require absolute majority support of the Assembly to hold office, as even if the number of opposers of government is larger than that of the supporters, the number of opposers still needs to be equal or greater than 126 (absolute majority) for both the Government's Programme to be rejected or for a motion of no confidence to be approved.[3]
The number of seats assigned to each district depends on the district magnitude.[4] The use of the d'Hondt method makes for a higher effective threshold than certain other allocation methods such as the Hare quota or Sainte-Laguë method, which are more generous to small parties.[5]
For these elections, and compared with the 1979 elections, the MPs distributed by districts were the following:[6]
| District | Number of MPs |
|---|---|
| Lisbon | 56 |
| Porto | 38 |
| Setúbal | 17 |
| Braga | 15 |
| Aveiro | 15 |
| Coimbra | 12 |
| Santarém | 12 |
| Leiria | 11 |
| Viseu | 10 |
| Faro | 9 |
| Castelo Branco | 6 |
| Viana do Castelo | 6 |
| Vila Real | 6 |
| Madeira | 5 |
| Azores | 5 |
| Beja | 5 |
| Évora | 5 |
| Guarda | 5 |
| Bragança | 4 |
| Portalegre | 4 |
| Europe | 2 |
| Outside Europe | 2 |
Parties
The table below lists the parties represented in the Assembly of the Republic during the second half of the 1st legislature (1976-1980), as the 1979 election was a national by-election, and that also contested the elections:
| Name | Ideology | Political position | Leader | 1979 result[7] | |||
|---|---|---|---|---|---|---|---|
| Votes (%) | Seats | ||||||
| PPD/PSD | Social Democratic Party Partido Social Democrata |
Portuguese social democracy | Centre | Francisco Sá Carneiro | 45.3%[lower-alpha 3] | 80 / 250 | |
| CDS | Democratic and Social Center Centro Democrático e Social |
Christian democracy Neoliberalism |
Centre-right to right-wing |
Diogo Freitas do Amaral | 43 / 250 | ||
| PPM | People's Monarchist Party Partido Popular Monárquico |
Monarchism Green conservatism |
Right-wing | Gonçalo Ribeiro Telles | 5 / 250 | ||
| PS | Socialist Party Partido Socialista |
Social democracy | Centre-left | Mário Soares | 27.3%[lower-alpha 4] | 74 / 250 | |
| PCP | Portuguese Communist Party Partido Comunista Português |
Communism Marxism–Leninism |
Far-left | Álvaro Cunhal | 18.8%[lower-alpha 5] | 44 / 250 | |
| MDP/CDE | Portuguese Democratic Movement Movimento Democrático Português |
Left-wing nationalism Democratic socialism |
Left-wing | José Manuel Tengarrinha | 3 / 250 | ||
| UDP | Popular Democratic Union União Democrática Popular |
Marxism Socialism |
Left-wing | Mário Tomé | 2.2% | 1 / 250 | |
Campaign period
Party slogans
| Party or alliance | Original slogan | English translation | Refs | |
|---|---|---|---|---|
| AD | « Garantir o progresso. » | "Ensure progress." | [8] | |
| FRS | « Um governo para todos. A sua segurança. » | "A government for all. Your safety." | [9] | |
| APU | « Vota APU, para a vitória de Abril » | "Vote APU, for the victory of April" | [10] | |
| UDP | « Abril de novo pela força do povo » | "April again by the strength of the people" | [11] | |
National summary of votes and seats
 | |||||||||||
| Parties | Votes | % | ± | Seats | MPs %/ votes % | ||||||
|---|---|---|---|---|---|---|---|---|---|---|---|
| 1979 | 1980 | ± | % | ± | |||||||
| Democratic Alliance[A] | 2,706,667 | 44.91 | 121 | 126 | 50.40 | 1.12 | |||||
| Social Democratic[B] | 147,644 | 2.45 | 7 | 8 | 3.20 | 1.31 | |||||
| Democratic and Social Centre[B] | 13,765 | 0.23 | 0 | 0 | 0.00 | 0.0 | |||||
| Total Democratic Alliance | 2,868,076 | 47.59 | 128 | 134 | 53.60 | 1.13 | |||||
| Republican and Socialist Front[C] | 1,606,198 | 26.65 | N/A | N/A | 71 | N/A | 28.40 | N/A | 1.07 | ||
| Socialist[D] | 67,081 | 1.11 | N/A | 74 | 3 | N/A | 1.20 | N/A | 1.08 | ||
| Total Republican and Socialist Front | 1,673,279 | 27.76 | 741 | 74 | 29.60 | 1.07 | |||||
| United People Alliance[E] | 1,009,505 | 16.75 | 47 | 41 | 16.40 | 0.98 | |||||
| People's Democratic Union | 83,204 | 1.38 | 1 | 1 | 0.40 | 0.29 | |||||
| Workers Party of Socialist Unity | 83,095 | 1.38 | 0 | 0 | 0.00 | 0.0 | |||||
| Revolutionary Socialist | 60,496 | 1.00 | 0 | 0 | 0.00 | 0.0 | |||||
| Labour | 39,408 | 0.65 | N/A | N/A | 0 | N/A | 0.00 | N/A | 0.0 | ||
| Workers' Communist Party | 35,409 | 0.59 | 0 | 0 | 0.00 | 0.0 | |||||
| PDC / MIRN/PDP / FN | 23,819 | 0.40 | N/A | N/A | 0 | N/A | 0.00 | N/A | 0.0 | ||
| Democratic Party of the Atlantic | 8,529 | 0.14 | N/A | N/A | 0 | N/A | 0.00 | N/A | 0.0 | ||
| OCMLP | 3,913 | 0.06 | 0 | 0 | 0.00 | 0.0 | |||||
| Total valid | 5,888,733 | 97.72 | 250 | 250 | 100.00 | — | |||||
| Blank ballots | 34,552 | 0.57 | |||||||||
| Invalid ballots | 103,140 | 1.71 | |||||||||
| Total | 6,026,395 | 100.00 | |||||||||
| Registered voters/turnout | 7,179,023 | 83.94 | |||||||||
| A Alliance formed by the Social Democratic Party (74 seats), the Democratic and Social Centre (46 seats) and the People's Monarchist Party (6 seats). B Social Democratic Party and Democratic and Social Centre electoral list only in Azores and Madeira. C Alliance formed by the Socialist Party (63 seats), the Leftwing Union for the Socialist Democracy (4 seats) and the Independent Social-Democratic Action (4 seats). D Socialist Party electoral list only in Azores and Madeira. E Portuguese Communist Party (39 MPs) and Portuguese Democratic Movement (2 MPs) ran in coalition.[12] | |||||||||||
| Source: Comissão Nacional de Eleições | |||||||||||
1 Republican and Socialist Front results are compared to the combined totals of the Socialist Party in the 1979 election.
Distribution by constituency
| Constituency | % | S | % | S | % | S | % | S | % | S | % | S | Total S |
|---|---|---|---|---|---|---|---|---|---|---|---|---|---|
| AD | FRS | APU | PSD | PS | UDP | ||||||||
| Azores | 3.1 | - | 57.0 | 4 | 27.3 | 1 | 1.3 | - | 5 | ||||
| Aveiro | 58.8 | 10 | 27.1 | 4 | 6.8 | 1 | 15 | ||||||
| Beja | 22.4 | 1 | 21.1 | 1 | 47.1 | 3 | 1.3 | - | 5 | ||||
| Braga | 54.9 | 9 | 29.3 | 5 | 8.4 | 1 | 0.9 | - | 15 | ||||
| Bragança | 65.3 | 3 | 21.3 | 1 | 4.8 | - | 1.0 | - | 4 | ||||
| Castelo Branco | 51.0 | 4 | 30.3 | 2 | 10.5 | - | 0.7 | - | 6 | ||||
| Coimbra | 46.1 | 6 | 35.9 | 5 | 9.9 | 1 | 0.8 | - | 12 | ||||
| Évora | 29.2 | 1 | 18.7 | 1 | 45.7 | 3 | 0.9 | - | 5 | ||||
| Faro | 37.2 | 4 | 34.7 | 4 | 16.7 | 1 | 1.9 | - | 9 | ||||
| Guarda | 60.6 | 4 | 26.3 | 1 | 5.0 | - | 0.7 | - | 5 | ||||
| Leiria | 59.8 | 7 | 22.7 | 3 | 9.7 | 1 | 1.0 | - | 11 | ||||
| Lisbon | 41.6 | 25 | 28.1 | 17 | 23.1 | 13 | 1.7 | 1 | 56 | ||||
| Madeira | 2.9 | - | 63.6 | 4 | 16.5 | 1 | 4.5 | - | 5 | ||||
| Portalegre | 33.4 | 2 | 32.4 | 1 | 26.1 | 1 | 0.7 | - | 4 | ||||
| Porto | 46.6 | 19 | 34.3 | 14 | 11.9 | 5 | 1.4 | - | 38 | ||||
| Santarém | 42.1 | 6 | 30.4 | 4 | 19.0 | 2 | 1.2 | - | 12 | ||||
| Setúbal | 24.1 | 4 | 23.5 | 4 | 44.0 | 9 | 2.8 | - | 17 | ||||
| Viana do Castelo | 59.2 | 5 | 22.8 | 1 | 10.0 | - | 0.7 | - | 6 | ||||
| Vila Real | 62.1 | 5 | 22.8 | 1 | 5.1 | - | 0.8 | - | 6 | ||||
| Viseu | 66.8 | 8 | 20.9 | 2 | 5.0 | - | 0.6 | - | 10 | ||||
| Europe | 49.6 | 1 | 15.2 | - | 25.4 | 1 | 1.4 | - | 2 | ||||
| Rest of the World | 85.5 | 2 | 2.6 | - | 4.0 | - | 0.4 | - | 2 | ||||
| Total | 44.9 | 126 | 26.7 | 71 | 16.8 | 41 | 2.5 | 8 | 1.1 | 3 | 1.4 | 1 | 250 |
| Source: Comissão Nacional de Eleições | |||||||||||||
Maps
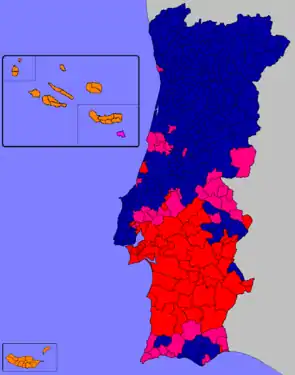 Most voted political force by municipality.
Notes
- As leader of the Social Democratic Party (PSD).
- As leader of the Socialist Party (PS).
- The Social Democratic Party (PSD), the Democratic Social Center (CDS) and the People's Monarchist Party (PPM) contested the 1979 election in a coalition called Democratic Alliance (AD) and won a combined 45.3% of the vote and elected 128 MP's to parliament.
- The Socialist Party (PS), Left-wing Union for the Socialist Democracy (UEDS) and the Independent Social-Democratic Action (ASDI) would contest the 1980 election in a coalition called Republican and Socialist Front (FRS).
- The Portuguese Communist Party (PCP) and the Portuguese Democratic Movement (MDP/CDE) contested the 1979 election in a coalition called United People Alliance (APU) and won a combined 18.8% of the vote and elected 47 MPs to parliament.
References
- Diário da Républica, 3 de Novembro de 1980 - Lista de candidatos eleitos
- Fundação Mário Soares
- "Constitution of the Portuguese Republic" (PDF). Archived from the original (PDF) on 2016-03-03. Retrieved 2019-12-29.
- "Effective threshold in electoral systems". Trinity College, Dublin. Retrieved 2015-10-21.
- Gallaher, Michael (1992). "Comparing Proportional Representation Electoral Systems: Quotas, Thresholds, Paradoxes and Majorities"
- "Eleição da Assembleia da República de 5 de Outubro de 1980". CNE - Comissão Nacional de Eleições - Eleição da Assembleia da República de 5 de Outubro de 1980. Retrieved 3 December 2020.
- Composição dos Grupos Parlamentares/Partidos
- "Comunicação Política em eleições legislativas em Portugal: uma análise a partir dos cartazes eleitorais (1975-2009)" (PDF). Francisco Teixeira (in Portuguese). Retrieved 12 May 2020.
- "ELEIÇÕES LEGISLATIVAS DE 1980 – FRENTE REPUBLICANA E SOCIALISTA (PS + ASDI + UEDS)". EPHEMERA (in Portuguese). Retrieved 12 May 2020.
- "ELEIÇÕES LEGISLATIVAS DE 1980 – APU". EPHEMERA (in Portuguese). Retrieved 12 May 2020.
- "UDP – 1980". EPHEMERA (in Portuguese). Retrieved 12 May 2020.
- "Electoral results - Assembly of the Republic". Archived from the original on 2012-07-16. Retrieved 2012-09-02.
See also
| Presidential elections | |
|---|---|
| Parliamentary elections |
|
| Local elections | |
| European elections | |
| Referendums | |
| |