1999 Portuguese legislative election
The Portuguese legislative election of 1999 took place on 10 October. The election renewed all 230 members of the Assembly of the Republic.
| ||||||||||||||||||||||||||||||||||||||||||||||||||||||||||||||||||||||||||||||||||||||
230 seats to the Portuguese Assembly 116 seats needed for a majority | ||||||||||||||||||||||||||||||||||||||||||||||||||||||||||||||||||||||||||||||||||||||
|---|---|---|---|---|---|---|---|---|---|---|---|---|---|---|---|---|---|---|---|---|---|---|---|---|---|---|---|---|---|---|---|---|---|---|---|---|---|---|---|---|---|---|---|---|---|---|---|---|---|---|---|---|---|---|---|---|---|---|---|---|---|---|---|---|---|---|---|---|---|---|---|---|---|---|---|---|---|---|---|---|---|---|---|---|---|---|
| Registered | 8,864,604 | |||||||||||||||||||||||||||||||||||||||||||||||||||||||||||||||||||||||||||||||||||||
| Turnout | 5,415,102 (61.1%) | |||||||||||||||||||||||||||||||||||||||||||||||||||||||||||||||||||||||||||||||||||||
| ||||||||||||||||||||||||||||||||||||||||||||||||||||||||||||||||||||||||||||||||||||||
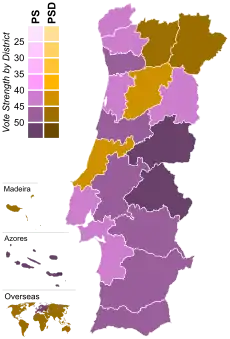 Results by district or autonomous region. | ||||||||||||||||||||||||||||||||||||||||||||||||||||||||||||||||||||||||||||||||||||||
| ||||||||||||||||||||||||||||||||||||||||||||||||||||||||||||||||||||||||||||||||||||||
_(cropped).jpg.webp)
.jpg.webp)

.jpg.webp)
.jpg.webp)
The Socialist Party was aiming a second term under the lead of António Guterres, incumbent Prime Minister, as a good economy and Portugal's growing prestige, following the Expo 1998 and the support for the East-Timor cause, were strengthening the PS position.[6] Polls leading up to the election predicted a comfortable PS majority government. Adding to this, the main opposition party, the Social Democratic Party (PSD), was exiting an internal crisis after former leader Marcelo Rebelo de Sousa resigned in March 1999 amid disagreaments with the CDS-People's Party leader, Paulo Portas, regarding a future PSD/CDS alliance for these elections.[7] The party elected, in a snap party congress in May 1999, José Manuel Durão Barroso as new leader.
Despite opinion polls predictions, the election results were labeled as a disappointment for the Socialists as the party failed to win a historical absolute majority by just one MP and barely improved their 1995 score, just 0.3%.[8] The disappointing PS score would create instability in Guterres second government in the years to follow.[9] The Social Democratic Party was still away from the preferences of the majority of the Portuguese people, after the ten years cycle under the lead of Cavaco Silva that had terminated four years before, and lost 7 MPs, compared with 1995, and gathered 32% of the votes. The Democratic Unity Coalition achieved an important climb in the scorecard, against those who predicted its irreversible decline after the end of the Socialist Bloc in the early 1990s. The CDS-People's Party was able to hold on to its 15 MPs after tensions with the PSD earlier that year. For the first time, the Left Bloc, formed after the merger of several minor left-wing parties became represented in the parliament after electing two MPs.
Turnout in this election was very low, only being surpassed in 2009 and 2011 when turnout was just less than 60%. Overall, voter turnout reached only 61% of voters, one of the lowest ever recorded.
Electoral system
The Assembly of the Republic has 230 members elected to four-year terms. Governments do not require absolute majority support of the Assembly to hold office, as even if the number of opposers of government is larger than that of the supporters, the number of opposers still needs to be equal or greater than 116 (absolute majority) for both the Government's Programme to be rejected or for a motion of no confidence to be approved.[10]
The number of seats assigned to each district depends on the district magnitude.[11] The use of the d'Hondt method makes for a higher effective threshold than certain other allocation methods such as the Hare quota or Sainte-Laguë method, which are more generous to small parties.[12]
For these elections, and compared with the 1995 elections, the MPs distributed by districts were the following:[13]
| District | Number of MPs |
|---|---|
| Lisbon | 49 (-1) |
| Porto | 37 |
| Braga | 17 (+1) |
| Setúbal | 17 |
| Aveiro | 14 (+1) |
| Leiria | 10 |
| Santarém | 10 |
| Coimbra | 10 |
| Viseu | 9 |
| Faro | 8 |
| Viana do Castelo | 6 |
| Madeira | 5 |
| Azores | 5 |
| Vila Real | 5 |
| Castelo Branco | 5 |
| Guarda | 4 |
| Bragança | 4 |
| Évora | 4 |
| Beja | 3 (-1) |
| Portalegre | 3 |
| Europe | 2 |
| Outside Europe | 2 |
Parties
The table below lists the parties represented in the Assembly of the Republic during the 7th legislature (1995-1999) and that also partook in the election:
| Name | Ideology | Political position | Leader | 1995 result | |||
|---|---|---|---|---|---|---|---|
| Votes (%) | Seats | ||||||
| PS | Socialist Party Partido Socialista |
Social democracy | Centre-left | António Guterres | 43.8% | 112 / 230 | |
| PPD/PSD | Social Democratic Party Partido Social Democrata |
Liberal conservatism Classical liberalism |
Centre-right | José Manuel Durão Barroso | 34.1% | 88 / 230 | |
| CDS-PP | CDS – People's Party Centro Democrático e Social – Partido Popular |
Christian democracy Conservatism |
Centre-right to right-wing |
Paulo Portas | 9.1% | 15 / 230 | |
| PCP | Portuguese Communist Party Partido Comunista Português |
Communism Marxism–Leninism |
Far-left | Carlos Carvalhas | 8.6% [lower-alpha 1] |
13 / 230 | |
| PEV | Ecologist Party "The Greens" Partido Ecologista "Os Verdes" |
Eco-socialism Green politics |
Left-wing | Isabel Castro | 2 / 230 | ||
Campaign period
Party slogans
| Party or alliance | Original slogan | English translation | Refs | |
|---|---|---|---|---|
| PS | « Portugal em boas mãos » | "Portugal in good hands" | [14] | |
| PSD | « Vamos cumprir » | "We will deliver" | [15] | |
| CDS–PP | « Alternativa'99 » | "Alternative'99" | [16] | |
| CDU | « Para que não fique tudo na mesma » | "So that everything will not stay the same" | [17] | |
| BE | « É tempo de ser exigente » | "It's time to be demanding" | [18] | |
Candidates' debates
| 1999 Portuguese legislative election debates | ||||||||||||||||||||
|---|---|---|---|---|---|---|---|---|---|---|---|---|---|---|---|---|---|---|---|---|
| Date | Organisers | Moderator(s) | P Present A Absent invitee N Non-invitee | |||||||||||||||||
| PS Guterres |
PSD Barroso |
CDU Carvalhas |
CDS–PP Portas |
Refs | ||||||||||||||||
| 16 Sep | SIC | José Alberto Carvalho | P | P | N | N | [19] | |||||||||||||
| 17 Sep | SIC | José Alberto Carvalho | N | N | P | P | [19] | |||||||||||||
| 19 Sep | SIC | José Alberto Carvalho | N | P | N | P | [19] | |||||||||||||
| 20 Sep | SIC | José Alberto Carvalho | P | N | P | N | [19] | |||||||||||||
| 21 Sep | SIC | José Alberto Carvalho | P | N | N | P | [19] | |||||||||||||
| 22 Sep | SIC | José Alberto Carvalho | N | P | P | N | [19] | |||||||||||||
| 23 Sep | RTP1 | Judite de Sousa | P | P | P | P | [20] | |||||||||||||
| Candidate viewed as "most convincing" in each debate | ||||||||||||||||||||
| Date | Organisers | Polling firm/Link | ||||||||||||||||||
| PS | PSD | CDU | CDS–PP | Notes | ||||||||||||||||
| 16 Sep | SIC | SIC | 57 | 25 | N/A | N/A | 18% Neither | |||||||||||||
Opinion polling
The following table shows the opinion polls of voting intention of the Portuguese voters before the election. Those parties that are listed were represented in parliament (1995-1999). Included is also the result of the Portuguese general elections in 1995 and 1999 for reference.
Note, until 2000, the publication of opinion polls in the last week of the campaign was forbidden.
| Date Released | Polling Firm | PS | PSD | CDU | CDS-PP | BE | Others | Lead | |
|---|---|---|---|---|---|---|---|---|---|
| 10 Oct 1999 | Leg. Election | 44.1 115 seats |
32.3 81 seats |
9.0 17 seats |
8.3 15 seats |
2.4 2 seats |
3.9 0 seats |
11.8 | |
| 10 Oct | RTP/Universidade Católica | 46.0 | 30.3 | 8.5 | 7.5 | 2.5 | 5.2 | 15.7 | |
| 10 Oct | SIC/Seeds | 46.3 | 31.5 | 9.8 | 8.0 | 2.8 | 1.6 | 14.8 | |
| 10 Oct | TVI/Intercampus | 46.3 | 28.6 | 9.5 | 8.3 | 3.2 | 4.1 | 17.7 | |
| Exit polls | |||||||||
| 2 Oct | Euroexpansão | 50.0 | 32.0 | 6.0 | 8.0 | 2.0 | 2.0 | 18.0 | |
| 1 Oct | Seeds | 47.0 | 32.0 | 8.0 | 7.0 | 1.0 | 5.0 | 15.0 | |
| 1 Oct | Metris | 48.0 | 31.0 | 7.0 | 7.0 | 1.0 | 6.0 | 17.0 | |
| 1 Oct | Universidade Católica | 47.2 | 30.0 | 7.9 | 7.2 | 2.8 | 4.9 | 17.2 | |
| 30 Sep | Marktest | 46.2 | 30.7 | 10.6 | 4.2 | 2.8 | 5.5 | 15.5 | |
| 30 Sep | Aximage | 49.0 | 33.0 | 7.0 | 6.0 | 1.0 | 4.0 | 16.0 | |
| 29 Jul | Universidade Católica | 52.0 | 31.6 | 6.9 | 6.2 | 1.9 | 1.4 | 20.4 | |
| 1999 | |||||||||
| 1 Oct 1995 | Leg. Election | 43.8 112 seats |
34.1 88 seats |
8.6 15 seats |
9.1 15 seats |
Did not exist | 4.4 0 seats |
9.7 | |
National summary of votes and seats
 | ||||||||||
| Parties | Votes | % | ± | MPs | MPs %/ votes % | |||||
|---|---|---|---|---|---|---|---|---|---|---|
| 1995 | 1999 | ± | % | ± | ||||||
| Socialist | 2,385,922 | 44.06 | 112 | 115 | 50.00 | 1.13 | ||||
| Social Democratic | 1,750,158 | 32.32 | 88 | 81 | 35.22 | 1.09 | ||||
| Unitary Democratic Coalition[A] | 487,058 | 8.99 | 15 | 17 | 7.39 | 0.82 | ||||
| People's | 451,643 | 8.34 | 15 | 15 | 6.52 | 0.78 | ||||
| Left Bloc | 132,333 | 2.44 | N/A | N/A | 2 | N/A | 0.87 | N/A | 0.36 | |
| Portuguese Workers' Communist | 40,006 | 0.74 | 0 | 0 | 0.00 | 0.0 | ||||
| Earth | 19,938 | 0.37 | 0 | 0 | 0.00 | 0.0 | ||||
| People's Monarchist | 16,522 | 0.31 | N/A | N/A | 0 | N/A | 0.00 | N/A | 0.0 | |
| National Solidarity | 11,488 | 0.21 | 0 | 0 | 0.00 | 0.0 | ||||
| Humanist | 7,346 | 0.14 | N/A | N/A | 0 | N/A | 0.00 | N/A | 0.0 | |
| Workers Party of Socialist Unity | 4,104 | 0.08 | 0 | 0 | 0.00 | 0.0 | ||||
| Democratic Party of the Atlantic[B] | 438 | 0.01 | 0 | 0 | 0.00 | 0.0 | ||||
| Total valid | 5,306,956 | 98.00 | 230 | 230 | 100.00 | — | ||||
| Blank ballots | 56,964 | 1.05 | ||||||||
| Invalid ballots | 51,230 | 0.95 | ||||||||
| Total | 5,415,102 | 100.00 | ||||||||
| Registered voters/turnout | 8,864,604 | 61.09 | ||||||||
| A Portuguese Communist Party (15 MPs) and "The Greens" (2 MPs) ran in coalition.[21] B Democratic Party of the Atlantic electoral list only in Azores. | ||||||||||
| Source: Comissão Nacional de Eleições | ||||||||||
Distribution by constituency
| Constituency | % | S | % | S | % | S | % | S | % | S | Total S |
|---|---|---|---|---|---|---|---|---|---|---|---|
| PS | PSD | CDU | CDS–PP | BE | |||||||
| Azores | 53.3 | 3 | 35.8 | 2 | 1.7 | - | 5.6 | - | 1.1 | - | 5 |
| Aveiro | 40.2 | 7 | 38.3 | 6 | 3.5 | - | 13.6 | 2 | 1.3 | - | 15 |
| Beja | 46.7 | 2 | 14.5 | - | 28.3 | 1 | 3.9 | - | 1.6 | - | 3 |
| Braga | 44.3 | 8 | 36.7 | 7 | 5.4 | 1 | 8.9 | 1 | 1.2 | - | 17 |
| Bragança | 39.7 | 2 | 45.1 | 2 | 2.6 | - | 8.7 | - | 0.8 | - | 4 |
| Castelo Branco | 51.6 | 3 | 32.0 | 2 | 5.3 | - | 6.3 | - | 1.2 | - | 5 |
| Coimbra | 47.2 | 6 | 35.2 | 4 | 6.1 | - | 6.0 | - | 2.0 | - | 10 |
| Évora | 45.7 | 2 | 18.7 | 1 | 24.6 | 1 | 5.1 | - | 1.5 | - | 4 |
| Faro | 48.4 | 5 | 29.5 | 3 | 8.3 | - | 7.3 | - | 2.3 | - | 8 |
| Guarda | 43.4 | 2 | 39.2 | 2 | 3.2 | - | 9.8 | - | 1.1 | - | 4 |
| Leiria | 36.8 | 4 | 42.6 | 5 | 5.3 | - | 9.9 | 1 | 1.7 | - | 10 |
| Lisbon | 42.7 | 23 | 27.3 | 14 | 12.3 | 6 | 8.5 | 4 | 4.9 | 2 | 49 |
| Madeira | 35.1 | 2 | 46.2 | 3 | 2.8 | - | 10.9 | - | 1.2 | - | 5 |
| Portalegre | 51.2 | 2 | 22.5 | 1 | 15.0 | - | 5.9 | - | 1.2 | - | 3 |
| Porto | 48.0 | 19 | 32.7 | 13 | 6.2 | 2 | 7.5 | 3 | 2.3 | - | 37 |
| Santarém | 45.5 | 5 | 30.2 | 3 | 10.1 | 1 | 8.1 | 1 | 2.0 | - | 10 |
| Setúbal | 43.7 | 8 | 18.0 | 3 | 24.8 | 5 | 5.6 | 1 | 3.5 | - | 17 |
| Viana do Castelo | 40.2 | 3 | 35.8 | 2 | 5.0 | - | 14.0 | 1 | 1.2 | - | 6 |
| Vila Real | 40.8 | 2 | 45.5 | 3 | 2.4 | - | 6.8 | - | 0.8 | - | 5 |
| Viseu | 38.1 | 4 | 44.3 | 4 | 2.2 | - | 10.5 | 1 | 1.2 | - | 9 |
| Europe | 55.4 | 2 | 24.7 | - | 5.3 | - | 3.2 | - | 0.6 | - | 2 |
| Rest of the World | 39.8 | 1 | 49.5 | 1 | 1.7 | - | 3.5 | - | 0.4 | - | 2 |
| Total | 44.1 | 115 | 32.3 | 81 | 9.0 | 17 | 8.3 | 15 | 2.4 | 2 | 230 |
| Source: Comissão Nacional de Eleições | |||||||||||
Maps
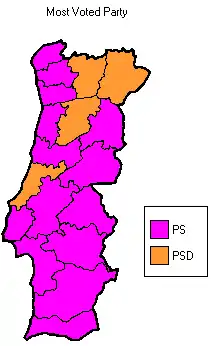 Most voted political force by district. (Madeira and Azores not shown)
.png.webp) Most voted political force by municipality.
Most voted political force by municipality.
Notes
- The Portuguese Communist Party (PCP) and the Ecologist Party "The Greens" (PEV) contested the 1999 election in a coalition called Unitary Democratic Coalition (CDU) and won a combined 8.6% of the vote and elected 15 MPs to parliament.
References
- Assembleia da República - Deputados e Grupos Parlamentares
- Assembleia da República - Deputados e Grupos Parlamentares
- Assembleia da República - Deputados e Grupos Parlamentares
- Assembleia da República - Deputados e Grupos Parlamentares
- Assembleia da República - Deputados e Grupos Parlamentares
- "World: Europe Portugal goes to the polls", BBC News, 10 October 1999. Retrieved 6 September 2020.
- "PSD. O dia em que Marcelo desistiu de ser primeiro-ministro", Jornal i, 26 March 2019. Retrieved 6 September 2020.
- "A noite que mudou a vida de Guterres ", Expresso, 16 October 2016. Retrieved 6 September 2020.
- "Os orçamentos do PS e Daniel Campelo ", RTP, 8 September 2015. Retrieved 6 September 2020.
- "Constitution of the Portuguese Republic" (PDF). Archived from the original (PDF) on 2016-03-03. Retrieved 2019-12-29.
- "Effective threshold in electoral systems". Trinity College, Dublin. Retrieved 2015-10-21.
- Gallaher, Michael (1992). "Comparing Proportional Representation Electoral Systems: Quotas, Thresholds, Paradoxes and Majorities"
- "Eleição da Assembleia da República de 10 de Outubro de 1999". CNE - Comissão Nacional de Eleições - Eleição da Assembleia da República de 10 de Outubro de 1999. Retrieved 3 December 2020.
- "ELEIÇÕES LEGISLATIVAS DE 1999 – EVORA – PS". EPHEMERA (in Portuguese). Retrieved 11 May 2020.
- "ELEIÇÕES LEGISLATIVAS DE 1999 – PSD – DURÃO BARROSO". EPHEMERA (in Portuguese). Retrieved 11 May 2020.
- "ELEIÇÕES LEGISLATIVAS DE 1999 – CDS-PP". EPHEMERA (in Portuguese). Retrieved 11 May 2020.
- "PCP Legislativas 1999". PCP (in Portuguese). Retrieved 11 May 2020.
- "Programa Legislativas 1999". BE (in Portuguese). Retrieved 11 May 2020.
- "Como Guterres mudou os debates para sempre e as arrobas chegaram ao estrelato". Expresso (in Portuguese). 9 September 2015. Retrieved 11 May 2020.
- "Operação Legislativas no ar". Público (in Portuguese). 8 September 1999. Retrieved 11 May 2020.
- "Electoral results - Assembly of the Republic". Archived from the original on 2012-07-16. Retrieved 2012-09-02.
External links
See also
| Presidential elections | |
|---|---|
| Parliamentary elections |
|
| Local elections | |
| European elections | |
| Referendums | |
| |