1994 European Parliament election in Portugal
The European Parliament election of 1994 in Portugal was the election of MEP representing Portugal constituency for the 1994-1999 term of the European Parliament. It was part of the wider 1994 European election. In Portugal the election was held on 12 June.
| |||||||||||||||||||||||||||||||||||||||||||||||||||||||||||||||||
25 seats to the European Parliament | |||||||||||||||||||||||||||||||||||||||||||||||||||||||||||||||||
|---|---|---|---|---|---|---|---|---|---|---|---|---|---|---|---|---|---|---|---|---|---|---|---|---|---|---|---|---|---|---|---|---|---|---|---|---|---|---|---|---|---|---|---|---|---|---|---|---|---|---|---|---|---|---|---|---|---|---|---|---|---|---|---|---|---|
| Turnout | 35.5% | ||||||||||||||||||||||||||||||||||||||||||||||||||||||||||||||||
| |||||||||||||||||||||||||||||||||||||||||||||||||||||||||||||||||


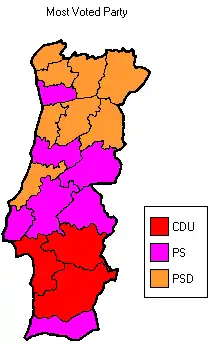
In the closest nationwide election in Portuguese history, the Socialist Party (PS) polled just 0.5% ahead of the Social Democrats (PSD). Nonetheless, it was a very strong performance from the Socialists, as they gained 6% more than in 1989, and also won 2 more MEP. It was also the first nationwide election victory for the PS since the 1983 general elections. At that time, the PSD was in government for almost 9 years, but the party suffered little wear. The Social Democrats won 34.4% of the votes, a gain of more than 1.5% compared with 1989, and were able to hold on to the 9 seats they won in 1989.
The People's Party (CDS–PP), although losing some ground, was able to win back 3rd place with a very nationalist and anti-Europe speech. The CDS–PP won 12.5% of the votes, a drop of almost 2%, but maintained their 3 seats. The Democratic Unity Coalition (CDU) had a very poor performance, falling to 4th place, and losing both share of vote and seats. The Communist/Green alliance won just 11% of the votes, a drop of 3%, and lost one seat from the Ecologist Party "The Greens".
Turnout fell to all-time low levels, with just 35.5% of voters casting a ballot.
Electoral System
The voting method used, for the election of European members of parliament, is by proportional representation using the d'Hondt method, which is known to benefit leading parties. In the 1994 EU elections, Portugal had 25 seats to be filled. Deputies are elected in a single constituency, corresponding to the entire national territory.
Parties and candidates
The major parties that partook in the election, and their EP list leaders, were:[1]
- Democratic Unity Coalition (CDU), Luis Manuel de Sá
- Socialist Party (PS), António Vitorino
- Social Democratic Party (PSD), Eurico de Melo
- People's Party (CDS–PP), Manuel Monteiro
Opinion Polling
The following table shows the opinion polls of voting intention of the Portuguese voters before the election. Those parties that are listed were represented in the EU parliament (1989-1994). Included is also the result of the Portuguese EP elections in 1989 and 1994 for reference.
Note, until 2000, the publication of opinion polls in the last week of the campaign was forbidden.
| Date Released | Polling Firm | PSD | PS | CDU | CDS-PP | Others | Lead |
|---|---|---|---|---|---|---|---|
| 12 Jun 1994 | 1994 EP Election | 34.4 9 seats |
34.9 10 seats |
11.2 3 seats |
12.5 3 seats |
7.1 0 seats |
0.5 |
| 6 Jun 1994 | Euroteste | 31.0 | 32.4 | 11.2 | 10.3 | 15.1 | 1.4 |
| 6 Jun 1994 | Norma | 28.6 | 33.0 | 10.1 | 10.6 | 17.7 | 4.4 |
| 6 Jun 1994 | Euroexpansão | 28.2 | 39.5 | 7.2 | 7.8 | 17.3 | 11.3 |
| 18 Jun 1989 | 1989 EP Election | 32.8 9 seats |
28.5 8 seats |
14.4 4 seats |
14.2 3 seats |
10.1 0 seats |
4.3 |
National summary of votes and seats
| ← 1989 • 1994 • 1999 → | ||||||||||
| National party | European party | Main candidate | Votes | % | +/– | Seats | +/– | |||
|---|---|---|---|---|---|---|---|---|---|---|
| Socialist Party (PS) | PES | António Vitorino | 1,061,560 | 34.87 | 6.33 |
10 | 2 | |||
| Social Democratic Party (PSD) | EPP | Eurico de Melo | 1,046,918 | 34.39 | 1.64 |
9 | 0 | |||
| People's Party (CDS–PP) | EDA | Manuel Monteiro | 379,044 | 12.45 | 1.71 |
3 | 0 | |||
| Democratic Unitarian Coalition (CDU) • Communist Party (PCP) • Ecologist Party (PEV) |
GUE/NGL | Luis Manuel de Sá | 340,725 | 11.19 | 3.21 |
3 3 0 |
0 1 | |||
| Others (parties or candidates that won less than 1% of the vote and no seats) | 121,518 | 4.00 | — | 0 | 0 | |||||
| Valid votes | 2,949,765 | 96.90 | ||||||||
| Blank and invalid votes | 94,236 | 3.10 | ||||||||
| Totals | 3,044,001 | 100.00 | — | 25 | 1 | |||||
| Electorate (eligible voters) and voter turnout | 8,565,822 | 35.54 | 15.56 |
|||||||
| Source: Comissão Nacional de Eleições | ||||||||||
Distribution by European group
| Groups | Parties | Seats | Total | % | |
|---|---|---|---|---|---|
| Party of European Socialists (PES) |
|
10 | 10 | 40.00 | |
| European People's Party (EPP) |
|
9 | 9 | 36.00 | |
| European United Left (EUL) | 3 | 3 | 12.00 | ||
| European Democratic Alliance (EDA) |
|
3 | 3 | 12.00 | |
| Total | 25 | 25 | 100.00 | ||
References
- Comissão Nacional de Eleições - Deputados
- "Elecciones al Parlamento Europeo: Resultados por países 1979 - 2014". historiaelectoral.com (in Spanish). Retrieved 28 November 2017.
See also
- Politics of Portugal
- List of political parties in Portugal
- Elections in Portugal
- European Parliament
| Presidential elections | |
|---|---|
| Parliamentary elections |
|
| Local elections | |
| European elections | |
| Referendums | |
| |