2002 Pacific typhoon season
The 2002 Pacific typhoon season was an slighty above average Pacific typhoon season, producing twenty-six named storms, fifteen becoming typhoons, and eight super typhoons. It was an event in the annual cycle of tropical cyclone formation, in which tropical cyclones form in the western Pacific Ocean. The season ran throughout 2002, though most tropical cyclones typically develop between May and October. The season's first named storm, Tapah, developed on January 11, while the season's last named storm, Bolaven, dissipated on December 11. The season's first typhoon, Mitag, reached typhoon status on March 1, and became the first super typhoon of the year four days later.
| 2002 Pacific typhoon season | |
|---|---|
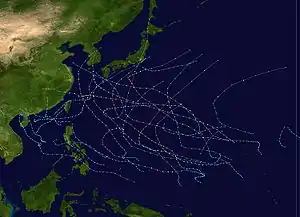 Season summary map | |
| Seasonal boundaries | |
| First system formed | January 9, 2002 |
| Last system dissipated | December 11, 2002 |
| Strongest storm | |
| Name | Fengshen |
| • Maximum winds | 185 km/h (115 mph) (10-minute sustained) |
| • Lowest pressure | 920 hPa (mbar) |
| Seasonal statistics | |
| Total depressions | 43, 1 unofficial |
| Total storms | 26 |
| Typhoons | 15 |
| Super typhoons | 8 (unofficial) [nb 1] |
| Total fatalities | 725 total |
| Total damage | $9.537 billion (2002 USD) |
| Related articles | |
The scope of this article is limited to the Pacific Ocean, to the north of the equator between 100°E and the 180th meridian. Within the northwestern Pacific Ocean, there are two separate agencies that assign names to tropical cyclones, which can often result in a cyclone having two names, one from the JMA and one from PAGASA. The Japan Meteorological Agency (JMA) will name a tropical cyclone should it be judged to have 10-minute sustained wind speeds of at least 65 km/h (40 mph) anywhere in the basin, while the Philippine Atmospheric, Geophysical and Astronomical Services Administration (PAGASA) assigns names to tropical cyclones which move into or form as a tropical depression in their area of responsibility located between 135°E and 115°E and between 5°N–25°N regardless of whether or not a tropical cyclone has already been given a name by the JMA. Tropical depressions that are monitored by the United States' Joint Typhoon Warning Center (JTWC) are given a number with a "W" suffix.
Seasonal forecasts
| TSR forecasts Date | Tropical storms | Total Typhoons | Intense TCs | Ref |
|---|---|---|---|---|
| Average (1972–2001) | 26.3 | 16.4 | 7.9 | [1] |
| March 6, 2002 | 28.6 | 18.7 | 9.6 | [1] |
| April 5, 2002 | 29.6 | 19.8 | 9.8 | [1] |
| May 7, 2002 | 30.5 | 20.9 | 10.3 | [1] |
| June 7, 2002 | 30.8 | 21.1 | 10.5 | [1] |
| July 11, 2002 | 28.6 | 19.2 | 11.8 | [1] |
| August 6, 2002 | 28.4 | 19.0 | 11.5 | [1] |
| Other forecasts Date | Forecast Center | Tropical storms | Typhoons | Ref |
| May 7, 2002 | Chan | 27 | 17 | [1] |
| June 28, 2002 | Chan | 27 | 18 | [1] |
| 2002 season | Forecast Center | Tropical cyclones | Tropical storms | Typhoons |
| Actual activity: | JMA | 43 | 26 | 15 |
| Actual activity: | JTWC | 33 | 26 | 17 |
| Actual activity: | PAGASA | 13 | 10 | 5 |
On March 6, meteorologists from University College London at TropicalStormRisk.com issued a forecast for the season for above average activity, since sea surface temperatures were expected to be slightly warmer than usual; the group used data by the Joint Typhoon Warning Center (JTWC), and compared the potential 28.6 storms to the 30-year average of 26.3.[2] The group raised the number of predicted storms in April to 29.6, and again in early May to 30.5.[3][4] They ultimately overestimated the number of storms that would form.[5] The Laboratory for Atmospheric Research at the City University of Hong Kong also issued a season forecast in April 2002, predicting 27 storms with a margin of error of 3, of which 11 would become typhoons, with a margin of error of 2. The agency noted a stronger than normal subtropical ridge over the open Pacific Ocean, as well as ongoing El Niño conditions that favored development, but expected below-normal development in the South China Sea.[6] These predictions proved to be largely accurate.[7]
During the year, the Japan Meteorological Agency (JMA) issued advisories on tropical cyclones west of the International Date Line to the Malay Peninsula, and north of the equator, in its role as the official Regional Specialized Meteorological Center, as designated by the World Meteorological Organization in 1989. The JMA issued forecasts and analyses every six hours starting at midnight UTC using numerical weather prediction (NWP) and a climatological tropical cyclone forecast model. They used the Dvorak technique and NWP to estimate 10-minute sustained winds and barometric pressure.[8] The JTWC also issued warnings on storms within the basin, operating from Pearl Harbor in Hawaii and supplying forecasts to the United States Armed Forces in the Indian and Pacific Oceans. The agency moved their backup facility from Yokosuka, Kanagawa in Japan to Monterey, California in 2002. Several meteorologists left the agency near the beginning of the year, although the new forecasters compensated for their inexperience by relying on the consensus of various forecast models. In 2002, the JTWC began experimenting with five-day forecasts.[9]
Season summary

The activity was an active season, with many tropical cyclones affecting Japan and China. Every month had tropical activity, with most storms forming from July through October. Overall, there were 44 tropical depressions declared officially or unofficially, of which 26 became named storms; of those, there were 15 typhoons, which is the equivalent of a minimal hurricane, while 8 of the 15 typhoon intensified into super typhoons unofficially by the JTWC. The season began early with the first storm, Tapah, developing on January 10, east of the Philippines. Two months later, Typhoon Mitag became the first super typhoon [nb 1] ever to be recorded in March. In June, Typhoon Chataan dropped heavy rainfall in the Federated States of Micronesia, killing 48 people and becoming the deadliest natural disaster in the state of Chuuk. Chataan later left heavy damage in Guam before striking Japan. In August, Typhoon Rusa became the deadliest typhoon in South Korea in 43 years, causing 238 deaths and $4.2 billion in damage.[nb 2] Typhoon Higos in October was the fifth strongest typhoon to strike Tokyo since World War II. The final typhoon of the season was Typhoon Pongsona, which was one of the costliest storms on record in Guam; it did damage worth $700 million on the island before dissipating on December 11.
The season began early, but did not become active until June, when six storms passed near or over Japan after a ridge weakened.[8] Nine storms developed in July, many of which influenced the monsoon trough over the Philippines to produce heavy rainfall and deadly flooding.[11] The flooding was worst in Luzon, where 85 people were killed. The series of storms caused the widespread closure of schools and offices. Many roads were damaged, and the floods left about $1.8 million (₱94.2 million PHP)[nb 3] in crop damage, largely to rice and corn.[12] Overall damage from the series of storms was estimated at $10.3 million (₱522 million PHP).[13][nb 3] From June to September, heavy rainfall affected large portions of China, resulting in devastating flooding that killed over 1,500 people and left $8.2 billion (¥68 billion CNY) in damage.[14][nb 4] During this time, Tropical Storm Kammuri struck southern China with a large area of rainfall that damaged or destroyed 245,000 houses. There were 153 deaths related to the storm, mostly inland in Hunan,[16] and damage totaled $322 million (¥2.665 billion CNY).[17][nb 4] Activity shifted farther to the east after September, with Typhoon Higos striking Japan in October and Typhoon Pongsona hitting Guam in December.[8]
During most of the year, sea surface temperatures were above normal near the equator, and were highest around 160° E from January to July, and in November. Areas of convection developed farther east than usual, causing many storms to develop east of 150° E. The average point of formation was 145.9° E, the easternmost point since 1951. Partially as a result, no tropical storms made landfall in the Philippines for the first time since 1951, according to the JMA. Two storms – Ele and Huko – entered the basin from the Central Pacific, east of the International Date Line. Overall, there were 26 named storms in the basin in 2002, which was slightly below the norm of 26.7. A total of 15 of the 26 storms became typhoons, a slightly higher than normal proportion.[8]
Systems
Tropical Storm Tapah (Agaton)
| Tropical storm (JMA) | |
| Tropical storm (SSHWS) | |
  | |
| Duration | January 9 – January 14 |
|---|---|
| Peak intensity | 75 km/h (45 mph) (10-min) 996 hPa (mbar) |
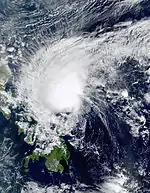
The first storm of the season was Tropical Storm Tapah, which formed on January 9 near Palau.[8] It developed from the monsoon trough and was first observed by the JTWC two days before its formation.[9] The system initially consisted of an area of convection with a weak circulation, located in an area of weak wind shear.[18] On January 10, the JMA classified the system as a tropical depression,[8] the same day that the JTWC initiated advisories on Tropical Depression 01W and PAGASA classified it as "Agaton". The storm moved west-northwestward due to a ridge to the north, and the system gradually became better organized.[18] On January 12, the JMA upgraded the depression to Tropical Storm Tapah, and later that day estimated peak winds of 75 km/h (45 mph).[8] Around that time, Tapah developed an eye feature beneath its convection, prompting both the JTWC and PAGASA to estimate peak winds of 95 km/h (60 mph).[18] An approaching trough weakened the ridge, which turned the storm to the northwest. Due to increasing wind shear,[9] convection gradually weakened, and the JMA downgraded Tapah to a tropical depression on January 13; however, other agencies maintained the system as a tropical storm. The next day, Tapah dissipated along the eastern coast of Luzon in the Philippines.[8][18]
Typhoon Mitag (Basyang)
| Typhoon (JMA) | |
| Category 5 super typhoon (SSHWS) | |
  | |
| Duration | February 26 – March 9 |
|---|---|
| Peak intensity | 175 km/h (110 mph) (10-min) 930 hPa (mbar) |
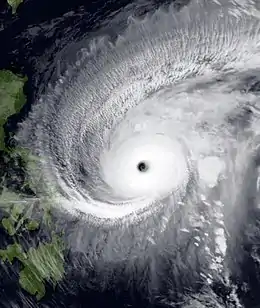
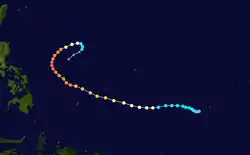
Typhoon Mitag developed from a trough near the equator on February 25 near the Federated States of Micronesia (FSM). It moved westward through the archipelago and intensified into a typhoon, before passing near Yap on March 2.[19] High winds and heavy rainfall affected the state, causing an islandwide power outage and destroying hundreds of houses. Mitag severely damaged crops, resulting in food shortages. The rainfall and storm surge flooded much of the coastline as well as Yap's capital, Colonia. Damage totaled $150 million, mostly to crops. There was one death related to the storm's aftermath.[20]
After affecting Yap, Mitag turned to the northwest and later to the north due to an approaching trough.[9] It passed to the north of Palau, contributing to one death there. Despite predictions of weakening,[19] the typhoon continued to intensify, reaching peak 10-minute winds of 175 km/h (110 mph) on March 5.[8] The JTWC estimated peak 1-minute winds of 260 km/h (160 mph) when the storm was about 610 km (380 mi) east of Catanduanes in the Philippines; this made Mitag a super typhoon, the first one on record in the month of March. The combination of cooler air and interaction with the westerlies caused Mitag to weaken significantly. Only four days after reaching peak winds, the storm had dissipated well to the east of the Philippines.[19]
Tropical Depression 03W (Caloy)
| Tropical depression (JMA) | |
| Tropical depression (SSHWS) | |
.png.webp)  | |
| Duration | March 19 – March 25 |
|---|---|
| Peak intensity | 55 km/h (35 mph) (10-min) 1000 hPa (mbar) |
On March 15, the JTWC began monitoring a tropical disturbance, and four days later upgraded it to a tropical depression near Palau.[9][19] The next day, both the JMA and PAGASA classified the system as a depression, and PAGASA named it "Caloy".[21] Moving west-northwestward due to a ridge to the north,[9] the depression moved across the Philippine island of Mindanao on March 21 and continued through the archipelago.[19] Owing to strong wind shear, the system never intensified,[9] and the JMA discontinued advisories on March 23 after the system reached the South China Sea.[21] The JTWC maintained the system as a tropical depression until March 25, when a mid-latitude trough absorbed the system off the east coast of Vietnam.[9]
Heavy rains from the depression affected the southern Philippines, causing flash flooding and landslides.[19] The storm damaged 2,703 homes, including 215 that were destroyed. Damage totaled about $2.4 million (₱124 million PHP).[nb 3] There were 35 deaths in the Philippines, mostly in Surigao del Sur in Mindanao from drownings.[19][22]
Typhoon Hagibis
| Typhoon (JMA) | |
| Category 5 super typhoon (SSHWS) | |
  | |
| Duration | May 14 – May 21 |
|---|---|
| Peak intensity | 175 km/h (110 mph) (10-min) 935 hPa (mbar) |
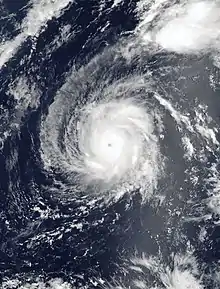
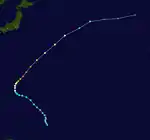
The monsoon trough spawned a tropical disturbance near the Caroline Islands in the middle of May.[9] By that time, the system was an area of convection with a weak circulation, although the system organized as outflow improved. It tracked northwestward within the monsoon trough,[23] steered by a mid-level ridge.[9] The system developed into a tropical depression on May 14 about 500 km (310 mi) southwest of Chuuk Lagoon,[8] and early the next day the JTWC initiated advisories.[9] For several days the depression remained weak, until it intensified into Tropical Storm Hagibis on May 16 about 200 km (120 mi) southwest of Guam.[8] The developing storm dropped rainfall on Guam that ended the island's wildfire season.[24] The storm quickly intensified, developing an eye feature later that day.[23] Early on May 18, the JMA upgraded Hagibis to a typhoon,[8] and around that time, an approaching trough turned the storm to the northeast.[23]
While accelerating northeastward, Hagibis developed a well-defined eye and underwent a period of rapid deepening.[23] On May 19, the JMA estimated peak 10-minute winds of 175 km/h (110 mph),[8] and the JTWC estimated 1-minute winds of 260 km/h (160 mph);[9] this made Hagibis a super typhoon, the second of the year. At the time of its peak, the typhoon was located about 305 km (190 mi) west-southwest of the northernmost Northern Marianas Islands.[23] Hagibis only maintained its peak for about 12 hours,[8] after which the eye began weakening.[23] The trough that caused the typhoon's acceleration also caused the storm to lose tropical characteristics, and dry air gradually became entrained in the circulation.[23] On May 21, Hagibis became extratropical to the east of Japan after having weakened below typhoon intensity. The remnants continued to the northeast and dissipated south of the Aleutian Islands on May 22.[8]
Severe Tropical Storm Noguri (Espada)
| Severe tropical storm (JMA) | |
| Category 2 typhoon (SSHWS) | |
  | |
| Duration | June 4 – June 11 |
|---|---|
| Peak intensity | 110 km/h (70 mph) (10-min) 975 hPa (mbar) |
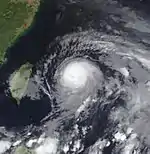
In early June, a disturbance within the monsoon trough persisted in the South China Sea to the east of Vietnam.[25] On June 4, a tropical depression developed just off the east coast of Hainan,[8] with a broad circulation and scattered convection. The system tracked slowly eastward due to a ridge to the north, and conditions favored intensification, including favorable outflow and minimal wind shear.[25] The JTWC initiated advisories on June 6,[9] and despite the favorable conditions, the depression remained weak. On June 7, the system briefly entered the area of responsibility of PAGASA, and the agency named it Espada. Later that day, the JTWC upgraded the depression to a tropical storm,[25] and on June 8 the JMA upgraded the depression to Tropical Storm Noguri halfway between Taiwan and Luzon.[8] Increased outflow from an approaching trough allowed the storm to quickly intensify. The JTWC upgraded Noguri to a typhoon late on June 8,[9] after an eye developed. By that time, the storm was moving to the northeast due to a building ridge to the southeast.[25] The JMA only estimated peak 10-minute winds of 110 km/h (70 mph), making it a severe tropical storm.[8] However, the JTWC estimated peak winds of 160 km/h (100 mph),[9] after the eye became well-organized. Increasing wind shear weakened Noguri, and the storm passed just west of the Miyako-jima on June 9. The convection diminished, and the JTWC declared Noguri extratropical while the storm was approaching Japan.[25] The JMA continued tracking the storm until it dissipated over the Kii Peninsula on June 11.[8]
While the storm passed south of Taiwan, it dropped heavy rainfall peaking at 320 mm (13 in) in Pingtung County.[25] Rainfall in Japan peaked at 123 mm (4.8 in) at a station in Kagoshima Prefecture.[26] The threat of the storm prompted school closures and 20 airline flight cancellations.[27] Noguri injured one person, damaged one house, and caused about $4 million (¥504 million JPY) in agricultural damage.[nb 5][28]
Typhoon Rammasun (Florita)
| Typhoon (JMA) | |
| Category 3 typhoon (SSHWS) | |
  | |
| Duration | June 28 – July 6 |
|---|---|
| Peak intensity | 155 km/h (100 mph) (10-min) 945 hPa (mbar) |
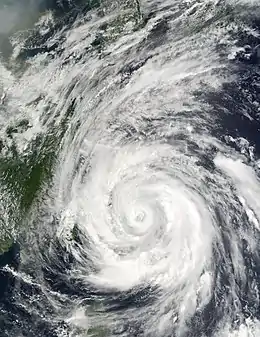
Typhoon Rammasun was the first of four typhoons to contribute to heavy rainfall and deadly flooding in the Philippines in July 2002; there were 85 deaths related to the four storms,[13] with 2,463 homes damaged or destroyed.[22] Rammasun developed around the same time as Typhoon Chataan, but farther to the west. The storm tracked northwestward toward Taiwan, and on July 2 it attained its peak intensity with winds of 160 km/h (100 mph). Rammasun turned northward, passing east of Taiwan and China.[11] In Taiwan, the outer rainbands dropped rainfall that alleviated drought conditions.[29] In contrast, rainfall in China followed previously wet conditions, resulting in additional flooding,[30] although less damage than expected; there was about $85 million in crop and fishery damage in Zhejiang.[31][nb 4]
After affecting Taiwan and China, Rammasun began weakening due to an approaching trough, which turned the typhoon northeastward. It passed over the Japanese island of Miyako-jima and also produced strong winds in Okinawa.[11] About 10,000 houses lost power on the island,[32] and high surf killed two sailors.[9] On the Japanese mainland, there was light crop damage and one serious injury.[33][34] After weakening to a tropical storm, Rammasun passed just west of the South Korean island of Jejudo,[9] where high waves killed one person.[35] The storm crossed the country, killing three others and leaving $9.5 million in damage.[9] High rains also affected North Korea and Primorsky Krai in the Russian Far East.[36][37]
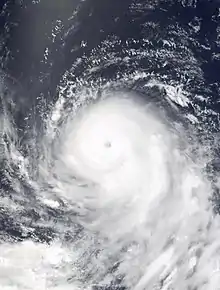
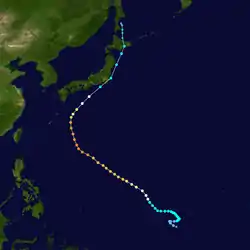
Typhoon Chataan (Gloria)
| Typhoon (JMA) | |
| Category 4 super typhoon (SSHWS) | |
  | |
| Duration | June 28 – July 11 |
|---|---|
| Peak intensity | 175 km/h (110 mph) (10-min) 930 hPa (mbar) |
Typhoon Chataan formed on June 28, 2002, near the FSM,[8] and for several days it meandered while producing heavy rainfall across the region. In Chuuk, a state in the FSM, the highest 24-hour precipitation total was 506 mm (19.9 in),[38] which was greater than the average monthly total.[39] The rain produced floods up to 1.5 m (4.9 ft) deep,[40] causing deadly landslides across the island that killed 47 people; this made Chataan the deadliest natural disaster in the island's history. There was also one death on nearby Pohnpei, and damage in the FSM totaled over $100 million.[41]
After affecting the FSM, Chataan began a northwest track as an intensifying typhoon. Its eye passed just north of Guam on July 4, though the eyewall moved across the island and dropped heavy rainfall. Totals were highest in southern Guam, peaking at 536 mm (21.1 in). Flooding and landslides from the storm severely damaged or destroyed 1,994 houses.[38][42] Damage on the island totaled $60.5 million, and there were 23 injuries. The typhoon also affected Rota in the Northern Mariana Islands with gusty winds and light rainfall.[41] Typhoon Chataan attained its peak intensity of 175 km/h (110 mph) on July 8. It weakened while turning to the north, and after diminishing to a tropical storm, Chataan struck eastern Japan on July 10.[8] High rainfall, peaking at 509 mm (20.0 in), flooded 10,270 houses. Damage in Japan totaled about $500 million (¥59 billion JPY).[43][nb 5]
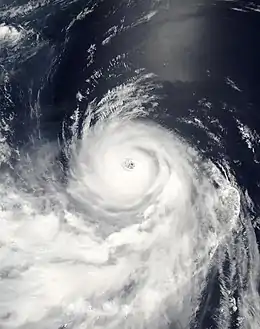
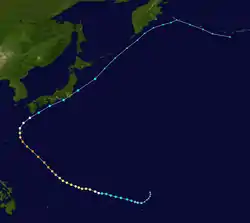
Typhoon Halong (Inday)
| Typhoon (JMA) | |
| Category 4 super typhoon (SSHWS) | |
  | |
| Duration | July 6 – July 16 |
|---|---|
| Peak intensity | 155 km/h (100 mph) (10-min) 945 hPa (mbar) |
The monsoon trough spawned a tropical depression on July 5 near the Marshall Islands, near where Chataan originated.[8][11] For much of its duration, Halong moved toward the northwest, gradually intensifying into a tropical storm. Early on July 10, Halong passed just south of Guam as a tropical storm, according to the JMA, although the JTWC assessed it as a typhoon near the island. It had threatened to strike the island less than a week after Chataan's damaging landfall, and although Halong remained south of Guam, it produced high waves and gusty winds on the island.[11] The storm disrupted relief efforts following Chataan, causing additional power outages but little damage.[44]
After affecting Guam, Halong quickly strengthened into a typhoon and reached its peak winds on July 12.[8] The JTWC estimated peak 1-minute winds of 250 km/h (155 mph),[9] while the JMA estimated 10-minute winds of 155 km/h (100 mph).[8] The typhoon weakened greatly while curving to the northeast,[11] although its winds caused widespread power outages on Okinawa.[45] Halong struck southeastern Japan, dropping heavy rainfall and producing strong winds that left $89.8 million (¥10.3 billion JPY) in damage.[46][47][48][49][50][51][52][nb 5] There was one death in the country and nine injuries.[47][53] Halong became extratropical on July 16 and dissipated the next day.[8]
Severe Tropical Storm Nakri (Hambalos)
| Severe tropical storm (JMA) | |
| Tropical storm (SSHWS) | |
  | |
| Duration | July 7 – July 13 |
|---|---|
| Peak intensity | 95 km/h (60 mph) (10-min) 983 hPa (mbar) |
A circulation formed on July 7 in the South China Sea, with associated convection located to the south. Outflow increased as the system became better organized,[11] and late on July 7 a tropical depression formed to the southwest of Taiwan.[8] A ridge located over the Philippines caused the system to track northeastward.[11] Early on July 9, the JMA upgraded the depression to Tropical Storm Nakri near western Taiwan.[8] It was a small storm, and while moving along the northern portion of the island, Nakri weakened as its convection diminished.[11] However, it intensified while moving away from Taiwan, reaching peak winds of 95 km/h (60 mph) on July 10.[8] The monsoon trough turned Nakri to the east for two days, until a weakening ridge turned it to the north on July 12.[9] That day, the storm passed just west of Okinawa, and shortly thereafter Nakri weakened to a tropical depression,[8] after experiencing cooler waters and increasing shear.[9] On July 13, Nakri dissipated west of Kyushu.[8]
While passing over Taiwan, Nakri dropped heavy rainfall that reached 647 mm (25.5 in) at Pengjia Islet.[11] A total of 170 mm (6.7 in) fell in one day at the Feitsui Dam, representing the highest daily total at that point in the year. Taiwan had experienced drought conditions prior to earlier Typhoon Rammasun, and additional rainfall from Nakri eliminated all remaining water restrictions.[54] Airline flights were canceled throughout the region due to the storm, and some schools and offices were closed.[55] Nakri killed one fisherman and a shipworker during its passage.[56] High rains also affected southeastern China,[11] and later Okinawa.[57] The storm induced heavy rainfall in the Philippines,[11] as well as in Japan, where landslides and flooding were reported along a cold front.[58]
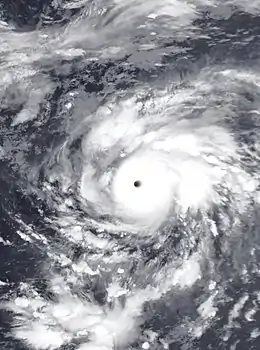
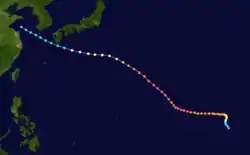
Typhoon Fengshen
| Typhoon (JMA) | |
| Category 5 super typhoon (SSHWS) | |
  | |
| Duration | July 13 – July 28 |
|---|---|
| Peak intensity | 185 km/h (115 mph) (10-min) 920 hPa (mbar) |
The monsoon trough spawned a tropical depression on July 13, which quickly intensified due to its small size. By July 15, Fengshen attained typhoon status, and after initially moving to the north, it began a movement toward the northwest. On July 18, the typhoon reached peak 10-minute winds of 185 km/h (115 mph), according to the JMA, making it the strongest storm of the season. The JTWC estimated peak 1-minute winds of 270 km/h (165 mph), and the agency estimated that Fengshen was a super typhoon for five days.[8][9] This broke the record for longest duration at that intensity, previously set by Typhoon Joan in 1997,[11] and later tied by Typhoon Ioke in 2006.[59]
While near peak intensity, Typhoon Fengshen underwent the Fujiwhara effect with Typhoon Fung-wong, causing the latter storm to loop to its south.[11] Fengshen gradually weakened while approaching Japan, and it crossed over the country's Ōsumi Islands on July 25 as a severe tropical storm.[8] When the typhoon washed a freighter ashore, four people drowned and the remaining fifteen were rescued.[60][61] In the country, Fengshen dropped heavy rainfall and produced heavy rains,[62] causing mudslides, $4 million (¥475 million JPY) in crop damage,[63][nb 5] and one death.[62] After affecting Japan, Fengshen weakened in the Yellow Sea to a tropical depression, before moving across China's Shandong Peninsula and dissipating on July 28.[8]
Tropical Depression 13W (Juan)
| Tropical depression (PAGASA) | |
| Tropical storm (SSHWS) | |
  | |
| Duration | July 18 – July 23 |
|---|---|
| Peak intensity | 55 km/h (35 mph) (10-min) 997 hPa (mbar) |
On July 16, an area of convection increased northwest of Palau with a weak circulation. Moderate shear dispersed the thunderstorms, although the system gradually organized.[11] It tracked northwestward due to a ridge to the north,[9] becoming a tropical depression on July 18. PAGASA gave the system the local name "Juan", and the JTWC classified it as Tropical Depression 13W, although the JMA did not classify it as a tropical storm. Early on July 19, the depression struck Samar Island in the Philippines, and continued northwestward through the archipelago. An increase in convection the next day prompted the JTWC to upgrade the system to a tropical storm before it moved over Luzon and the Metro Manila area.[11] Increasing shear and disrupted outflow due to land interaction weakened the system, and the JTWC discontinued advisories on July 22.[9] PAGASA continued tracking the system until the following day.[22]
The depression dropped heavy rainfall in the Philippines during its passage,[9] only weeks after several consecutive tropical systems caused deadly flooding in the country. The rains forced 2,400 people to evacuate. Storm-related tornadoes and landslides killed at least three people.[11] Three people were electrocuted, and flash flooding killed at least two people.[64] In all, Tropical Depression Juan killed 14 people and injured two others. There were 583 houses that were damaged or destroyed, and damage totaled about $240,000 (₱12.1 million PHP),[22][nb 3] mostly on Luzon.[11]
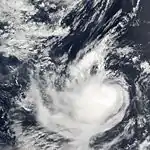
Typhoon Fung-wong (Kaka)
| Typhoon (JMA) | |
| Category 1 typhoon (SSHWS) | |
  | |
| Duration | July 18 – July 27 |
|---|---|
| Peak intensity | 130 km/h (80 mph) (10-min) 960 hPa (mbar) |
A small circulation formed northeast of the Northern Marianas Islands on July 18.[11] Later that day, the JMA classified the system as a tropical depression.[8] Convection and outflow increased the next day, and the system moved slowly westward due to a ridge over Japan. After further organization, the JTWC initiated advisories on July 20 while the depression was just southwest of Iwo Jima.[11] Shortly thereafter, the JMA upgraded it to Tropical Storm Fung-Wong.[8] On July 22, the storm began undergoing the Fujiwhara effect with the larger Typhoon Fengshen to the east, causing Fung-wong to turn southwestward. Around that time, the storm entered PAGASA's region, earning it the local name "Kaka". Fung-wong quickly intensified after developing a small eye, becoming a typhoon on July 23,[11] with peak winds of 130 km/h (80 mph).[8] It turned to the south and later southeast while interacting with the larger Fengshen, which passed north of it.[11] On July 25, the typhoon weakened to a severe tropical storm while at the southernmost point of its track.[8] The storm turned to the north and completed a large loop between the Ryukyu and Northern Marianas Islands that day.[11] The combination of cooler waters, wind shear, and dry air caused weakening,[9] and the storm deteriorated into a tropical depression on July 27. Passing a short distance south of Kyushu, Fung-wong dissipated later that day.[11]
The storm dropped heavy rainfall in Japan, reaching 717 mm (28.2 in) at a station in Miyazaki Prefecture.[65] The rains caused two landslides and resulted in delays to bus and train systems, as well as cancellations to ferry and airline routes. There was also minor crop damage.[66]
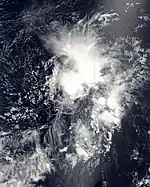
Tropical Storm Kalmaegi
| Tropical storm (JMA) | |
| Tropical depression (SSHWS) | |
  | |
| Duration | July 20 (entered basin) – July 21 |
|---|---|
| Peak intensity | 65 km/h (40 mph) (10-min) 1002 hPa (mbar) |
A tropical disturbance developed on July 17 in the Central Pacific Ocean, near the International Date Line.[9] Deep convection with outflow persisted around a circulation,[11] and at 06:00 UTC on July 20 the JMA classified the system as a tropical depression, just east of the date line and about 980 km (610 mi) west-southwest of Johnston Atoll. The system crossed the line shortly thereafter and quickly intensified into Tropical Storm Kalmaegi.[8] The JMA classified the system as a tropical storm, although the JTWC maintained it as a tropical depression.[11] Kalmaegi moved northwestward due to a ridge to the north, and initially a tropical upper tropospheric trough provided favorable conditions. However, the trough soon increased wind shear and restricted outflow, which caused quick weakening.[9] The thunderstorms diminished from the circulation,[11] and around 12:00 UTC on July 22, Kalmaegi dissipated about 30 hours after forming.[8]
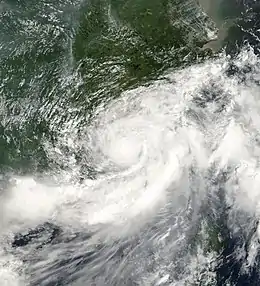
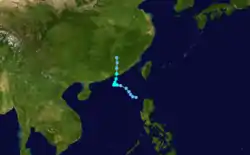
Severe Tropical Storm Kammuri (Lagalag)
| Severe tropical storm (JMA) | |
| Tropical storm (SSHWS) | |
  | |
| Duration | August 2 – August 7 |
|---|---|
| Peak intensity | 100 km/h (65 mph) (10-min) 980 hPa (mbar) |
A large monsoonal system persisted toward the end of July 2002 near the Philippines. On August 2, a tropical depression formed off the northwest coast of Luzon and moved west-northwestward. Late on August 3, it intensified into Tropical Storm Kammuri off the coast of Hong Kong. A weakening ridge turned the storm northward toward the coast of China. Tropical Storm Kammuri made landfall late on August 4, after reaching peak winds of 100 km/h (65 mph). The system dissipated over the mountainous coastline of eastern China and merged with a cold front on August 7.[17]
High rainfall from Kammuri affected large portions of China, particularly in Guangdong province where it moved ashore.[17] In Hong Kong, the rains caused a landslide and damaged a road.[67] Two dams were destroyed in Guangdong by the flooding,[68] and 10 people were killed by a landslide.[17] Throughout the province, over 100,000 people had to evacuate due to flooding, and after 6,810 houses were destroyed.[17][69] The floods damaged roads, railroads, and tunnels, and left power and water outages across the region.[17] Rainfall was beneficial in alleviating drought conditions in Guangdong,[70] although further inland the rains occurred after months of deadly flooding.[71] In Hunan Province, the storm's remnants merged with a cold front and destroyed 12,400 houses.[17] Across its path, the floods damaged or destroyed 245,000 houses, and destroyed about 60 hectares (150 acres) of crop fields. Kammuri and its remnants killed 153 people,[16] and damage was estimated at $509 million (¥4.219 billion CNY).[17][nb 4]
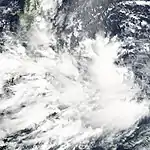
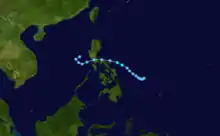
Tropical Depression 18W (Milenyo)
| Tropical depression (JMA) | |
| Tropical storm (SSHWS) | |
  | |
| Duration | August 11 – August 14 |
|---|---|
| Peak intensity | 55 km/h (35 mph) (10-min) 998 hPa (mbar) |
A tropical depression developed on August 10 east of the Philippines. Initially it was disorganized due to hostile conditions, and it failed to intensify significantly before crossing the Philippine island of Luzon.[17] There, flooding forced 3,500 people to evacuate their homes.[72] In the Philippines, the storm killed 35 people and caused $3.3 million in damage, with 13,178 houses damaged or destroyed. It was the final storm named by PAGASA during the season.[22]
After affecting the Philippines, the tropical depression moved into the South China Sea and dissipated on August 14. During the next day, despite separate systems, the remnants of 18W formed another system which would later intensify into Tropical Storm Vongfong.[17]
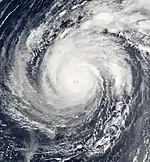
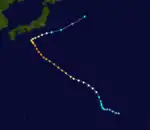
Typhoon Phanfone
| Typhoon (JMA) | |
| Category 4 super typhoon (SSHWS) | |
  | |
| Duration | August 11 – August 20 |
|---|---|
| Peak intensity | 155 km/h (100 mph) (10-min) 940 hPa (mbar) |
The monsoon trough spawned a tropical depression on August 11, just west of Ujelang Atoll.[8][9] It moved generally northwestward due to a ridge to the north,[17] quickly intensifying into Tropical Storm Phanfone by August 12.[8] With good outflow and developing rainbands, the storm continued to strengthen,[17] becoming a typhoon on August 14.[8] Phanfone developed a well-defined eye, surrounded by deep convection.[17] On August 15, the JMA estimated 10-minute winds of 155 km/h (100 mph),[8] and the JTWC estimated 1-minute winds of 250 km/h (155 mph), making it a super typhoon.[9] Diminished outflow and an eyewall replacement cycle caused weakening,[17] and it passed near Iwo Jima on August 16.[8] Phanfone turned to the northeast two days later due to a weakening ridge, and dry air caused rapid deterioration. Passing southeast of Japan, it fell to tropical storm status on August 19 before becoming extratropical the next day;[17] the remnants continued to the northeast and crossed the International Date Line on August 25.[8]
Wind gusts on Iwo Jima reached 168 km/h (105 mph).[17] Rainfall in mainland Japan peaked at 416 mm (16.4 in) near Tokyo, and the typhoon flooded 43 houses.[73] High rains caused road damage and landslides, as well as some aquaculture damage.[74] The storm caused 22 ferry routes and 10 flights to be canceled,[75] and temporarily shut down refineries near Tokyo.[76] On the offshore island of Hachijō-jima, high winds caused a temporary power outage.[77]
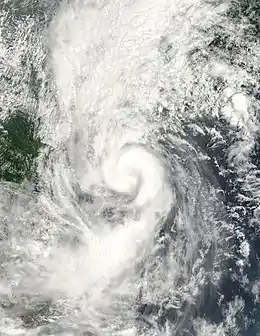
Tropical Storm Vongfong
| Tropical storm (JMA) | |
| Tropical storm (SSHWS) | |
  | |
| Duration | August 15 – August 20 |
|---|---|
| Peak intensity | 75 km/h (45 mph) (10-min) 985 hPa (mbar) |
A tropical depression formed in the South China Sea during August 15 from the remnants of 18W. It moved northwestward, strengthening into Tropical Storm Vongfong on August 18. It brushed eastern Hainan before making landfall on August 19 in southern China near Wuchuan, Guangdong.[8] Soon after the circulation dissipated, it dropped heavy rainfall across the region.[17] One person died in a traffic accident in Hong Kong, and landslides killed twelve people.[17][78] The storm destroyed 6,000 houses, mostly in Guangdong, and damage in the country totaled at least $86 million.[17][nb 4]
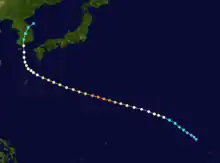
Typhoon Rusa
| Typhoon (JMA) | |
| Category 4 typhoon (SSHWS) | |
  | |
| Duration | August 22 – September 1 |
|---|---|
| Peak intensity | 150 km/h (90 mph) (10-min) 950 hPa (mbar) |
Typhoon Rusa developed on August 22 from the monsoon trough in the open Pacific Ocean, well to the southeast of Japan. For several days, Rusa moved to the northwest, eventually intensifying into a powerful typhoon.[9] The JMA estimated peak 10-minute winds of 150 km/h (90 mph),[8] and the JTWC estimated peak 1-minute winds of 215 km/h (135 mph).[9] On August 26, the storm moved across the Amami Islands of Japan,[8] where Rusa left 20,000 people without power and caused two fatalities.[79][80] Across Japan, the typhoon dropped torrential rainfall peaking at 902 mm (35.5 in) in Tokushima Prefecture.[81]
After weakening slightly, Rusa made landfall on Goheung, South Korea with 10-minute winds of 140 km/h (85 mph). It was able to maintain much of its intensity due to warm air and instability from a nearby cold front.[8][82] Rusa weakened while moving through the country, dropping heavy rainfall that peaked at 897.5 mm (35.33 in) in Gangneung. A 24-hour total of 880 mm (35 in) in the city broke the record for the highest daily precipitation in the country; however, the heaviest rainfall was localized.[82] Over 17,000 houses were damaged, and large areas of crop fields were flooded.[83] In South Korea, Rusa killed at least 233 people,[84] making it the deadliest typhoon in over 43 years,[85] and caused $4.2 billion in damage.[84] The typhoon also dropped heavy rainfall in neighboring North Korea, leaving 26,000 people homeless and killing three.[86] Rusa also destroyed large areas of crops in the country, which was already affected by ongoing famine conditions.[87] The typhoon became extratropical over eastern Russia on September 1, dissipating three days later.[8]
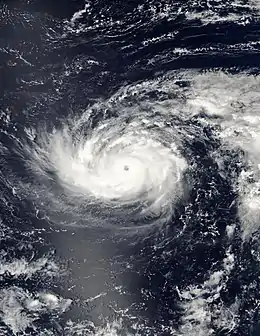
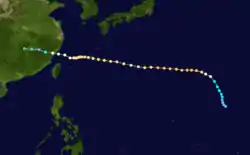
Typhoon Sinlaku
| Typhoon (JMA) | |
| Category 3 typhoon (SSHWS) | |
  | |
| Duration | August 27 – September 9 |
|---|---|
| Peak intensity | 150 km/h (90 mph) (10-min) 950 hPa (mbar) |
Sinlaku formed on August 27 northeast of the Northern Marianas Islands. After initially moving to the north, it began a generally westward motion that it maintained for the rest of its duration. Sinlaku strengthened into a typhoon and attained its peak winds on August 31. Over the next few days, it fluctuated slightly in intensity while moving over or near several Japanese islands.[8] On September 4, the typhoon's eye crossed over Okinawa.[9] It dropped heavy rainfall and produced strong winds that left over 100,000 people without power.[88] Damage on the island was estimated at $14.3 million,[89][nb 5] including $3.6 million in damage to Kadena Air Base.[9]
After affecting Okinawa, Sinlaku threatened northern Taiwan, which had been affected by two deadly typhoons in the previous year.[90] Damage ended up being minimal on the island,[91] although two people were killed.[84] Sinlaku weakened slightly before making its final landfall in eastern China near Wenzhou on September 7.[8] The storm produced a record wind gust there of 204 km/h (127 mph),[17] and just south of the city, high waves destroyed several piers and a large boat.[92] High rainfall and winds from Sinlaku wrecked 58,000 houses, and large areas of crops were destroyed. Damage in China was estimated at $709 million,[17][nb 4] and there were 28 deaths there.[84]
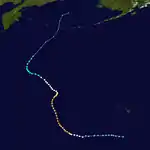
Typhoon Ele
| Typhoon (JMA) | |
| Category 4 typhoon (SSHWS) | |
  | |
| Duration | August 30 (entered basin) – September 10 |
|---|---|
| Peak intensity | 165 km/h (105 mph) (10-min) 940 hPa (mbar) |
An eastern extension of the monsoon trough southwest of Hawaii organized into Tropical Depression Two-C on August 27 and strengthened into Tropical Storm Ele six hours later. Despite the nearby presence of Alika, Ele developed rapidly and strengthened into a hurricane on August 28. After contributing to the demise of Alika, Ele intensified to winds of 205 km/h (125 mph) before crossing the International Date Line on August 30.[93]
Reclassified as a typhoon,[8] Ele moved north-northwestward due to a weakness in the ridge to the north. Early on August 31, the JTWC estimated the storm's peak 1-minute winds at 165 km/h (105 mph).[17] On September 2, the JMA estimated peak 10-minute winds of 165 km/h (105 mph) while Ele was northeast of Wake Atoll.[8] The typhoon turned to the northeast due to an approaching trough,[9] although Ele resumed its previous north-northwest motion after a ridge built behind the trough.[17] It gradually weakened due to cooler waters and increasing wind shear,[9] and on September 6 Ele deteriorated below typhoon status.[8] The thunderstorms became detached from the circulation,[9] causing Ele to weaken to a tropical depression late on September 9. By that time, it began moving to the northeast, and on September 10 it transitioned into an extratropical storm. The remnants of Ele continued to the northeast until moving back into the central Pacific as an extratropical storm on September 11 and dissipating on September 13.[8]
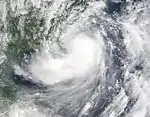
Tropical Storm Hagupit
| Tropical storm (JMA) | |
| Tropical storm (SSHWS) | |
  | |
| Duration | September 9 – September 16 |
|---|---|
| Peak intensity | 85 km/h (50 mph) (10-min) 990 hPa (mbar) |
An area of convection developed on September 8 to the northeast of Luzon.[94] Moving to the west due to a ridge to the north,[9] it slowly organized,[94] forming into a tropical depression on September 9 in the South China Sea. As it approached southeastern China, the depression intensified into Tropical Storm Hagupit and reached peak winds of 85 km/h (50 mph). At around 19:00 UTC on September 11, the storm made landfall west of Macau and quickly weakened into a tropical depression.[8] The JTWC promptly discontinued advisories,[9] although the JMA continued tracking Hagupit over land. The remnants executed a loop over Guangdong before moving offshore and dissipating on September 16 near Hong Kong.[8]
Hagupit dropped heavy rainfall along the coast of China for several days, peaking at 344 mm (13.5 in) in Zhanjiang City. The rains flooded widespread areas of crop fields and resulted in landslides. In Guangdong, 330 houses were destroyed, and damage was estimated at $32.5 million.[94][nb 4] In Hong Kong, 32 people were injured due to the storm,[95] and 41 flights were canceled.[9] In Fuzhou in Fujian Province, thunderstorms related to Hagupit flooded hundreds of houses. Further west in Jiangxi, floods from the storm destroyed 3,800 houses, ruined 180 bridges, and killed 25.[94] Offshore, a helicopter rescued the crew of 25 from a sunken boat during the storm.[9][95]
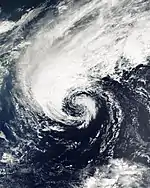
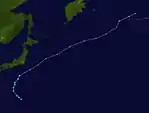
Tropical Storm Changmi
| Tropical storm (JMA) | |
  | |
| Duration | September 20 – September 22 |
|---|---|
| Peak intensity | 85 km/h (50 mph) (10-min) 985 hPa (mbar) |
An area of thunderstorms increased near the FSM on September 15 within the monsoon trough. Located within an area of moderate wind shear, its convection was intermittent around a weak circulation. On September 18, the JTWC issued a Tropical Cyclone Formation Alert (TCFA), and the JMA classified the system as a tropical depression; however, the two warning agencies were tracking different circulations within the same system, and by September 19 the circulation JMA was tracking became the dominant system. Shortly thereafter, the agency downgraded the system to a low pressure area after it weakened.[94] The next day, JMA again upgraded the system to a tropical depression,[8] and the JTWC issued a second TCFA when the system had a partially exposed circulation near an area of increasing convection.[94] Late on September 21, the JMA upgraded the depression to Tropical Storm Changmi to the south of Japan. The next day, Changmi attained peak winds of 85 km/h (50 mph).[8] However, the JTWC noted that the system was absorbing dry air and becoming extratropical, and thus did not issue warnings on the storm.[94] Moving northeastward, Changmi became an extratropical cyclone on September 22, and gradually became more intense until crossing the International Date Line early on September 25.[8]
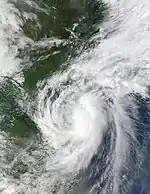
Tropical Storm Mekkhala
| Tropical storm (JMA) | |
| Tropical storm (SSHWS) | |
  | |
| Duration | September 22 – September 28 |
|---|---|
| Peak intensity | 85 km/h (50 mph) (10-min) 990 hPa (mbar) |
An elongated trough with associated convection developed in the South China Sea by September 21. Light shear and increasing outflow allowed the system to become better organized,[94] and it formed into a tropical depression on September 22 between Vietnam and Luzon.[8] A ridge to the northeast allowed the system to track northwestward.[9] For several days the depression failed to organize further, despite favorable conditions; however, late on September 24 the circulation developed rainbands and a weak eye feature.[94] Early the next day, the JMA upgraded it to Tropical Storm Mekkhala, which quickly intensified to a peak intensity of 85 km/h (50 mph).[8] At around 12:00 UTC on September 25, Mekkhala made landfall on western Hainan near peak intensity. Soon after, it moved into the Gulf of Tonkin and weakened due to land interaction and increasing shear.[9] Mekkhala remained a weak tropical storm until September 28, when it weakened to a tropical depression and dissipated soon after in the extreme northern portion of the Gulf of Tonkin.[8]
Mekkhala dropped heavy rainfall along its path, peaking at 479 mm (18.9 in) in Sanya, Hainan.[94] Along the island, high winds washed ashore or sank 20 boats,[96] and 84 fishermen were rescued. Throughout Hainan, the high rains wrecked 2,500 houses and left $80.5 million in damage.[nb 4] High rains spread into southwestern China, particularly in Guangxi. In Beihai, the storm destroyed 335 houses, resulting in $22 million in damage.[94][nb 4]
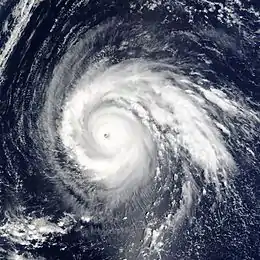
Typhoon Higos
| Typhoon (JMA) | |
| Category 4 super typhoon (SSHWS) | |
  | |
| Duration | September 26 – October 2 |
|---|---|
| Peak intensity | 175 km/h (110 mph) (10-min) 930 hPa (mbar) |
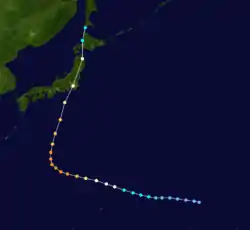
Typhoon Higos developed on September 25 east of the Northern Marianas Islands. It tracked west-northwestward for its first few days, steadily intensifying into a powerful typhoon by September 29. Higos weakened and turned to the north-northeast toward Japan, making landfall in that country's Kanagawa Prefecture on October 1.[8] Shortly thereafter, it crossed over Tokyo, becoming the third strongest typhoon to do so since World War II.[9] It weakened while crossing Honshu, and shortly after striking Hokkaidō on October 2, Higos became extratropical. The remnants passed over Sakhalin and dissipated on October 4.[8]
Before striking Japan, Higos produced strong winds in the Northern Marianas Islands while passing to their north. These winds damaged the food supply on two islands.[97] Later, Higos moved across Japan with wind gusts as strong as 161 km/h (100 mph),[98] including record gusts at several locations.[99] A total of 608,130 buildings in the country were left without power,[98] and two people were electrocuted in the storm's aftermath.[94] The typhoon also dropped heavy rainfall that peaked at 346 mm (13.6 in).[98] The rains flooded houses across the country and caused mudslides.[100] High waves washed 25 boats ashore and killed one person along the coast.[98][100] Damage in the country totaled $2.14 billion (¥261 billion JPY),[nb 5] and there were five deaths.[98] Later, the remnants of Higos affected the Russian Far East, killing seven people in two shipwrecks near Primorsky Krai.[101]
Severe Tropical Storm Bavi
| Severe tropical storm (JMA) | |
| Category 1 typhoon (SSHWS) | |
  | |
| Duration | October 8 – October 13 |
|---|---|
| Peak intensity | 100 km/h (65 mph) (10-min) 985 hPa (mbar) |
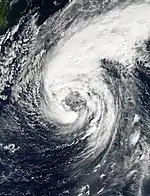
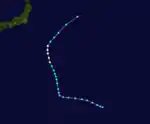
A tropical disturbance organized within the monsoon trough in early October near the FSM. The convection gradually consolidated around a single circulation,[102] developing into a tropical depression on October 8.[8] Wind shear was weak and outflow was good, which allowed for slow strengthening; however, the system was elongated, with a separate circulation to the west. Around this time, the system produced gale-force winds on Kosrae in the FSM.[102] Late on October 9, the JMA upgraded the depression to Tropical Storm Bavi to the east of Guam,[8] although it was still a broad system at the time. After becoming a tropical storm, Bavi moved generally northward due to a ridge retreating to the northeast. By October 11, winds were fairly weak near the center and were stronger in outer rainbands.[102] That day, the JMA estimated peak winds of 100 km/h (65 mph).[8] Despite the broad structure,[102] with an exposed circulation at the peak, the JTWC estimated winds as high as 130 km/h (80 mph), making Bavi a typhoon. Shortly after reaching peak winds, the storm turned to the northeast and entered the westerlies.[9] Increasing shear weakened the convection,[102] and Bavi became extratropical on October 13. It continued to the northeast and crossed into the Central Pacific on October 16.[8]
Severe Tropical Storm Maysak
| Severe tropical storm (JMA) | |
| Category 1 typhoon (SSHWS) | |
  | |
| Duration | October 26 – October 30 (Exited basin) |
|---|---|
| Peak intensity | 100 km/h (65 mph) (10-min) 980 hPa (mbar) |
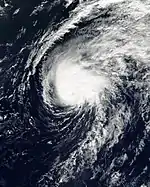
On October 25, an organized area of convection persisted southeast of Wake Island. With minimal wind shear, it quickly developed a circulation,[102] becoming a tropical depression on October 26.[8] Due to a ridge to the east, it moved generally northwestward and slowly intensified.[102] Late on October 27, it strengthened into Tropical Storm Maysak.[8] Initially, the system absorbed nearby dry air, although the storm was able to continue developing deep convection.[102] An approaching trough turned Maysak to the northeast,[9] and on October 29 it reached peak winds of 100 km/h (65 mph), according to the JMA.[8] On two occasions, the JTWC assessed Maysak as briefly intensifying into a typhoon,[103] based on an eye feature, although increased shear later caused weakening.[102] Continuing to the northeast, Maysak moved into the central Pacific Ocean on October 30,[8] by which time it had become extratropical.[102]
Typhoon Huko
| Typhoon (JMA) | |
| Category 1 typhoon (SSHWS) | |
  | |
| Duration | November 3 (Entered basin) – November 7 |
|---|---|
| Peak intensity | 140 km/h (85 mph) (10-min) 985 hPa (mbar) |
In the central Pacific Ocean, a tropical depression developed in the monsoon trough on October 24 to the south of Hawaii. It moved generally west-northwestward, intensifying into Tropical Storm Huko on October 26. It became a hurricane two days later, and briefly weakened back to tropical storm status before becoming a hurricane again on October 31. On November 3, Huko crossed the International Date Line into the western Pacific.[93] Despite favorable inflow patterns and warm sea surface temperatures,[102] Huko only strengthened to reach peak winds of 140 km/h (85 mph).[8] It moved quickly to the west-northwest due to a strong ridge to its north. Dry air caused Huko to weaken slightly, and on November 4 the typhoon passed about 95 km (60 mi) northeast of Wake Island.[102] The typhoon brought heavy rains and winds gusts of 40–45 mph (64–72 km/h) to the island.[104] Huko moved through a weakness in the ridge, resulting in a turn to the north and northeast.[102] Late on November 5, Huko weakened below typhoon status,[8] and increasing shear caused further weakening.[102] On November 7, Huko became extratropical, and later that day its remnants crossed back into the central Pacific.[8] Several days later, the remnants affected northern California.[102]
Typhoon Haishen
| Typhoon (JMA) | |
| Category 2 typhoon (SSHWS) | |
  | |
| Duration | November 20 – November 25 |
|---|---|
| Peak intensity | 155 km/h (100 mph) (10-min) 955 hPa (mbar) |
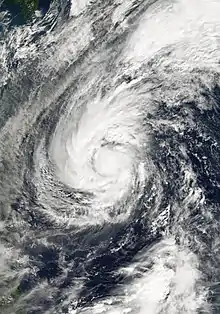
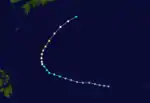
In the middle of November, an area of thunderstorms developed southwest of Chuuk in the FSM within the monsoon trough. With weak shear and good outflow, it slowly organized,[105] becoming a tropical depression on November 20.[8] It moved quickly to the west-northwest,[105] intensifying into Tropical Storm Haishen late on November 20 to the southeast of Guam.[8] While passing south of the island, Haishen produced gale-force winds. The convection organized into a central dense overcast and developed an eye feature.[105] Early on November 23, Haishen intensified into a typhoon;[8] around that time, it began moving to the north due to an approaching trough.[105] The typhoon quickly intensified to peak winds of 155 km/h (100 mph).[8] Soon after, Haishen began weakening due to increasing shear, and the eye quickly dissipated.[105] Late on November 24, it weakened below typhoon status, and early on November 25 Haishen became extratropical. The remnants continued to the northeast, dissipating on November 26.[8]
Typhoon Pongsona
| Typhoon (JMA) | |
| Category 4 super typhoon (SSHWS) | |
.JPG.webp)  | |
| Duration | December 2 – December 11 |
|---|---|
| Peak intensity | 165 km/h (105 mph) (10-min) 940 hPa (mbar) |
Typhoon Pongsona was the last typhoon of the season, and was the second costliest disaster in 2002 in the United States and its territories.[106] It formed on December 2,[8] having originated as an area of convection to the east-southeast of Pohnpei in late November. With a ridge to the north, the depression tracked generally westward for several days,[107] intensifying into Tropical Storm Pongsona on December 3.[8] After an eye developed on December 5,[107] the storm attained typhoon status to the north of Chuuk.[8] Steady intensification continued, until it became more rapid on December 8 while approaching Guam.[107] That day, the JMA estimated peak winds of 165 km/h (105 mph),[8] and the JTWC estimated peak winds of 240 km/h (150 mph), making Pongsona a super typhoon.[9] Around its peak intensity, the eye of the typhoon moved over Guam and Rota.[9] After striking Guam, Pongsona began moving to the north and later to the northeast, quickly weakening due to the presence of dry air and interaction with an approaching mid-latitude storm. After the convection diminished over the center,[107] Pongsona became extratropical early on December 11. Early the next day, it dissipated east of Japan.[8]
On Guam, Pongsona was the third most intense typhoon on record to strike the island, with wind gusts reaching 278 km/h (173 mph). Damage totaled $700 million, making it one of the five costliest storms on Guam. The typhoon injured 193 people and killed one person. In addition to its strong winds, Pongsona dropped torrential rainfall that peaked at 650.5 mm (25.61 in).[108] A total of 1,751 houses were destroyed on Guam, and another 6,740 were damaged to some degree. Widespread areas lost water, and the road system was heavily damaged. On neighboring Rota, Pongsona damaged 460 houses and destroyed 114, causing an additional $30 million in damage.[109] Both Guam and the Northern Marianas Islands were declared federal disaster areas, which made federal funding available for repairing storm damage. In Guam, the federal government provided about $125 million in funding for individuals and other programs.[110][111]
Other systems
On February 15, a weak tropical depression developed east of Mindanao, according to the JMA; by the next day, the system dissipated.[112] In the beginning of April, a tropical disturbance developed along the southern end of a stationary cold front west of Enewetak Atoll.[9] While gradually organizing, the system produced gale-force wind gusts in the FSM.[113] On April 5, the JTWC initiated advisories on Tropical Depression 04W. The system moved northwestward due to a nearby extratropical storm, which later caused the depression to also become extratropical about 650 km (405 mi) west-southwest of Wake Atoll.[9] The JMA issued its last advisory on April 8.[9]
A tropical depression formed in the South China Sea on May 28,[9] given the name "Dagul" by PAGASA.[23] The JTWC never anticipated significant strengthening,[114] and the system largely consisted of convection displaced to the southeast of a broad circulation.[23] A ridge to the southeast steered the depression to the northeast, and on May 30 the depression made landfall in southwestern Taiwan. The combination of land interaction and wind shear caused dissipation that day.[9]
The JMA monitored a tropical depression east of Iwo Jima on July 25, although by the next day the agency was no longer tracking the system.[11] On August 3, a small circulation was located just off the southeast coast of Japan, which later developed an area of convection over it. The JTWC initiated advisories on Tropical Depression 17W at 06:00 UTC on August 5,[17] describing the system as a "midget cyclone". A mid-level ridge to the southeast steered the depression eastward away from Japan. Unfavorable conditions caused weakening, and the JTWC discontinued advisories six hours after its first warning.[9] Another tropical depression formed on September 21 to the northeast of the Marshall Islands, but dissipated by the next day.[94]
Three non-developing depressions formed in October. The first was classified as a depression by the JMA on October 12 in the South China Sea. It quickly dissipated, although the system dropped heavy rainfall reaching 108 mm (4.3 in) at a station in the Paracel Islands.[102] The second, classified as Tropical Depression 27W by the JTWC, formed on October 17 about 1,220 km (760 mi) east-northeast of Saipan. It moved westward due to a ridge to the north, and failed to intensify due to weak outflow and dry air. It dissipated on October 19.[9] The day before, another depression formed near the International Date Line.[102] Classified as Tropical Depression 28W by the JTWC, it moved generally northward due to a break in the ridge. Wind shear dissipated the depression on October 20.[102]
Storm names
Within the western Pacific Ocean, both the JMA and PAGASA assign names to tropical cyclones that develop in the basin, which can result in a tropical cyclone having two names.[115] As part of its duty as a Regional Specialized Meteorological Center (RSMC), the JMA's Typhoon Center in Tokyo assigns international names to tropical cyclones on behalf of the World Meteorological Organization's Typhoon Committee, should they be judged to have 10-minute sustained winds of 65 km/h (40 mph).[116] The PAGASA assigns names to all tropical cyclones that move into or form as a tropical depression in their area of responsibility, located between 135°E and 115°E and between 5°N-25°N, even if the cyclone has had an international name assigned to it.[115] The names of significant tropical cyclones are retired, by both PAGASA and the Typhoon Committee.[116] PAGASA also has an auxiliary naming list, of which the first ten are published, should their list of names be exhausted.
International names
During the season 24 named tropical cyclones developed in the Western Pacific and were named by the Japan Meteorological Agency, when it was determined that they had become tropical storms. These names were contributed to a list of a 140 names submitted by the fourteen members nations and territories of the ESCAP/WMO Typhoon Committee. All of the names on the list were used for the first time. This is the only time the names Noguri, Changmi, Chataan, Rusa, and Pongsona were used. The former two had their spellings changed while the latter three were retired.
| Tapah | Mitag | Hagibis | Noguri | Rammasun | Chataan | Halong | Nakri | Fengshen | Kalmaegi | Fung-wong | Kammuri |
| Phanfone | Vongfong | Rusa | Sinlaku | Hagupit | Changmi | Mekkhala | Higos | Bavi | Maysak | Haishen | Pongsona |
Two central pacific storms, Hurricane Ele 02C and Hurricane Huko 03C, crossed into this basin. They became Typhoon Ele and Typhoon Huko, keeping their original name and "C" suffix in their warnings by JTWC.[9]
Philippines
| Agaton | Basyang | Caloy | Dagul | Espada |
| Florita | Gloria | Hambalos | Inday | Juan |
| Kaka | Lagalag | Milenyo | Neneng (unused) | Ompong (unused) |
| Paloma (unused) | Quadro (unused) | Rapido (unused) | Sibasib (unused) | Tagbanwa (unused) |
| Usman (unused) | Venus (unused) | Wisik (unused) | Yayang (unused) | Zeny (unused) |
| Auxiliary list | ||||
|---|---|---|---|---|
| Agila (unused) | Bagwis (unused) | Ciriaco (unused) | Diego (unused) | Elena (unused) |
| Forte (unused) | Gunding (unused) | Hunyango (unused) | Itoy (unused) | Jessa (unused) |
The Philippine Atmospheric, Geophysical and Astronomical Services Administration uses its own naming scheme for tropical cyclones in their area of responsibility. PAGASA assigns names to tropical depressions that form within their area of responsibility and any tropical cyclone that might move into their area of responsibility,[18] and the lists are reused every four years.[117] Names that were not assigned are marked in gray.
Retirement
The names Chataan, Rusa, and Pongsona were retired by the WMO's Typhoon Committee. The names Matmo, Nuri, and Noul were chosen to replace Chataan, Rusa and Pongsona respectively.[118]
Season effects
The following table does not include unnamed storms, and PAGASA names are in parenthesis. Storms entering from the Central Pacific only include their information while in the western Pacific, and are noted with an asterisk *.
| Name | Dates active | Peak classification | Sustained wind speeds |
Pressure | Areas affected | Damage (USD) |
Deaths | Refs |
|---|---|---|---|---|---|---|---|---|
| Tapah (Agaton) | January 10 – 13 | Tropical storm | 75 km/h (45 mph) | 996 hPa (29.42 inHg) | Philippines | None | None | [119] |
| TD | February 15 | Tropical Depression | 55 km/h (35 mph) | 1006 hPa (29.71 inHg) | None | None | None | |
| Mitag (Basyang) | February 27 – March 9 | Typhoon | 175 km/h (110 mph) | 930 hPa (27.46 inHg) | Federated States of Micronesia, Palau | $150 million | 2 | [20] |
| 03W (Caloy) | March 21 – 23 | Tropical Depression | 55 km/h (35 mph) | 1004 hPa (29.65 inHg) | Philippines | $2.4 million | 35 | [22] |
| 04W | April 6 – 8 | Tropical Depression | 55 km/h (35 mph) | 1004 hPa (29.65 inHg) | None | None | None | |
| Hagibis | May 15 – 21 | Typhoon | 175 km/h (110 mph) | 935 hPa (27.61 inHg) | Caroline Islands, Mariana Islands | None | None | [24] |
| 06W (Dagul) | May 26 – 30 | Tropical Depression | 55 km/h (35 mph) | 1002 hPa (29.59 inHg) | Philippines, Taiwan | None | None | [22] |
| TD | May 27 – 29 | Tropical Depression | Not specified | 1008 hPa (29.77 inHg) | None | None | None | |
| TD | June 3 – 5 | Tropical Depression | Not specified | 1004 hPa (29.65 inHg) | Ryukyu Islands | None | None | |
| Noguri (Espada) | June 4 – 10 | Severe tropical storm | 110 km/h (75 mph) | 975 hPa (28.79 inHg) | Japan, Taiwan | $4 million | None | [28] |
| Rammasun (Florita) | June 28 – July 6 | Typhoon | 155 km/h (100 mph) | 945 hPa (27.91 inHg) | China, Korean Peninsula, Ryukyu Islands, Taiwan | $100 million | 97 | [9][13][31][35] |
| Chataan (Gloria) | June 28 – July 11 | Typhoon | 175 km/h (110 mph) | 930 hPa (27.46 inHg) | Chuuk, Guam, Japan | $660 million | 54 | [41][43] |
| Halong (Inday) | July 6 – July 16 | Typhoon | 155 km/h (100 mph) | 945 hPa (27.91 inHg) | Guam, Philippines, Japan | $89.8 million | 10 | [46][47][48][49][50][51][52] |
| Nakri (Hambalos) | July 7 – 13 | Severe tropical storm | 95 km/h (60 mph) | 983 hPa (29.03 inHg) | Philippines, China, Taiwan, Japan | None | 2 | [56] |
| Fengshen | July 13 – 28 | Typhoon | 185 km/h (115 mph) | 920 hPa (27.17 inHg) | Japan, China | $4 million | 5 | [60][62][63] |
| 13W (Juan) | July 18 – 23 | Tropical depression | 55 km/h (35 mph) | 1002 hPa (29.59 inHg) | Philippines | $240 thousand | 14 | [11][22] |
| Fung-wong (Kaka) | July 18 – 27 | Typhoon | 130 km/h (80 mph) | 960 hPa (28.35 inHg) | Japan | None | None | [65] |
| Kalmaegi | July 20 – 21 | Tropical storm | 65 km/h (40 mph) | 1003 hPa (29.62 inHg) | None | None | None | [8] |
| TD | July 25 – 26 | Tropical Depression | Not specified | 1004 hPa (29.65 inHg) | None | None | None | |
| TD | July 29 – 30 | Tropical Depression | Not specified | 998 hPa (29.47 inHg) | South China | None | None | |
| Kammuri (Lagalag) | August 2 – 7 | Severe tropical storm | 100 km/h (65 mph) | 980 hPa (28.94 inHg) | China | $509 million | 153 | [16][17] |
| 17W | August 5 – 6 | Tropical depression | 55 km/h (35 mph) | 998 hPa (29.47 inHg) | None | None | None | |
| 18W (Milenyo) | August 11 – 14 | Tropical depression | 55 km/h (35 mph) | 998 hPa (29.47 inHg) | Philippines | $3.3 million | 35 | [11][22] |
| Phanfone | August 11 – 20 | Typhoon | 155 km/h (100 mph) | 940 hPa (27.76 inHg) | Japan | None | None | [17] |
| Vongfong | August 15 – 20 | Tropical storm | 75 km/h (45 mph) | 985 hPa (29.09 inHg) | China | $86 million | 9 | [17][22][78] |
| Rusa | August 22 - September 1 | Typhoon | 150 km/h (90 mph) | 950 hPa (28.05 inHg) | Japan, South Korea, North Korea | $4.2 billion | 238 | [79][80][84][86] |
| Sinlaku | August 27 – September 9 | Typhoon | 150 km/h (90 mph) | 950 hPa (28.05 inHg) | Japan, China | $723 million | 30 | [17][84][89] |
| Ele | August 30 – September 10 | Typhoon | 165 km/h (105 mph) | 940 hPa (27.76 inHg) | None | None | None | [8] |
| Hagupit | September 9 – 15 | Tropical storm | 85 km/h (50 mph) | 990 hPa (29.23 inHg) | China | $32.5 million | 25 | [94] |
| TD | September 18 – 19 | Tropical Depression | Not specified | 1002 hPa (29.59 inHg) | Mariana Islands | None | None | |
| Changmi | September 20 – 22 | Tropical storm | 85 km/h (50 mph) | 985 hPa (29.09 inHg) | None | None | None | [8] |
| TD | September 21 – 22 | Tropical Depression | Not specified | 1008 hPa (29.77 inHg) | None | None | None | |
| Mekkhala | September 22 – 28 | Tropical storm | 85 km/h (50 mph) | 990 hPa (29.23 inHg) | China | $103 million | None | [94] |
| Higos | September 26 – October 2 | Typhoon | 175 km/h (110 mph) | 930 hPa (27.47 inHg) | Japan, Primorsky Krai | $2.14 billion | 12 | [98][101] |
| Bavi | October 8 – 13 | Severe tropical storm | 100 km/h (65 mph) | 985 hPa (29.09 inHg) | None | None | None | [8] |
| TD | October 12 | Tropical Depression | Not specified | 1004 hPa (29.65 inHg) | None | None | None | |
| 27W | October 15 – 18 | Tropical depression | 55 km/h (35 mph) | 1004 hPa (29.65 inHg) | None | None | None | |
| 28W | October 18 – 19 | Tropical depression | 55 km/h (35 mph) | 1008 hPa (29.77 inHg) | None | None | None | |
| TD | October 23 – 24 | Tropical Depression | Not specified | 1010 hPa (29.83 inHg) | Taiwan | None | None | |
| Maysak | October 26 – 30 | Severe tropical storm | 100 km/h (65 mph) | 980 hPa (28.94 inHg) | None | None | None | [8] |
| Huko | November 3 – 7 | Typhoon | 140 km/h (85 mph) | 985 hPa (29.09 inHg) | None | None | None | [8] |
| Haishen | November 20 – 24 | Typhoon | 155 km/h (100 mph) | 955 hPa (28.20 inHg) | None | None | None | [8] |
| TD | November 27 | Tropical Depression | Not specified | 1008 hPa (29.77 inHg) | None | None | None | |
| Pongsona | December 2 – 11 | Typhoon | 140 km/h (85 mph) | 940 hPa (27.76 inHg) | Guam, Northern Marianas Islands | $730 million | 1 | [108][109] |
| Season aggregates | ||||||||
| 44 systems | January 10 – December 11 | 185 km/h (115 mph) | 920 hPa (27.17 inHg) | >9.54 billion | 725 | |||
See also
- List of Pacific typhoon seasons
- 2002 Pacific hurricane season
- 2002 Atlantic hurricane season
- 2002 North Indian Ocean cyclone season
- South-West Indian Ocean cyclone seasons: 2001–02, 2002–03
- Australian region cyclone seasons: 2001–02, 2002–03
- South Pacific cyclone seasons: 2001–02, 2002–03
Notes
- A super typhoon is an unofficial category used by the Joint Typhoon Warning Center (JTWC) for a typhoon with winds of at least 240 km/h (150 mph).[10]
- All damage totals are valued as of 2002 and in United States dollars, unless otherwise noted.
- The total was originally reported in Philippine pesos. Total converted via the Oanda Corporation website.[15]
- The total was originally reported in Chinese renminbi. Total converted via the Oanda Corporation website.[15]
- The total was originally reported in Japanese yen. Total converted via the Oanda Corporation website.[15]
References
- Paul Rockett; Mark Saunders (January 17, 2003). "Summary of 2002 NW Pacific Typhoon Season and Verification of Authors' Seasonal Forecasts" (PDF). TropicalStormRisk.com. Archived (PDF) from the original on January 4, 2012. Retrieved January 17, 2003.
- Paul Rockett; Mark Saunders (2002-03-06). "Extended Range Forecast for Northwest Pacific Typhoon Activity in 2002" (PDF). TropicalStormRisk.com. Archived (PDF) from the original on 2012-01-04. Retrieved 2012-10-27.
- Paul Rockett; Mark Saunders (2002-04-05). "Extended Range Forecast for Northwest Pacific Typhoon Activity in 2002" (PDF). TropicalStormRisk.com. Archived (PDF) from the original on 2012-01-04. Retrieved 2012-10-27.
- Paul Rockett; Mark Saunders (2002-05-07). "Extended Range Forecast for Northwest Pacific Typhoon Activity in 2002" (PDF). TropicalStormRisk.com. Archived (PDF) from the original on 2012-01-04. Retrieved 2012-10-27.
- Paul Rockett; Adam Lea (2003-01-17). "Summary of 2002 NW Pacific Typhoon Season and Verification of Authors' Seasonal Forecasts" (PDF). TropicalStormRisk.com. Archived (PDF) from the original on 2012-01-04. Retrieved 2012-10-27.
- 2002 Prediction of Seasonal Tropical Cyclone Activity over the Western North Pacific and the South China Sea, and the Number of Landfalling Tropical Cyclones over South China (Report). Laboratory for Atmospheric Research at the City University of Hong Kong. 2002-05-07. Archived from the original on May 30, 2009. Retrieved 2012-10-28.
- "Verification of Forecasts of Tropical Cyclone Activity over the Western North Pacific in 2002". Laboratory for Atmospheric Research at the City University of Hong Kong. 2003-01-15. Archived from the original on May 30, 2009. Retrieved 2012-10-28.
- Annual Report on Activities of the RSMC Tokyo – Typhoon Center 2002 (PDF) (Report). Japan Meteorological Agency. 8. Archived from the original (PDF) on 2013-10-14. Retrieved 2012-07-24.
- Joint Typhoon Warning Center. Annual Tropical Cyclone Report (PDF) (Report). United States Navy. Archived (PDF) from the original on 2013-02-21. Retrieved 2012-07-25.
- Frequently Asked Questions (Report). Joint Typhoon Warning Center. 2012-08-13. Archived from the original on 2013-10-04. Retrieved 2012-09-22.
- Gary Padgett (2002). "Monthly Global Tropical Cyclone Summary July 2002". Archived from the original on 2015-02-21. Retrieved 2012-10-02.
- Danielito T. Franco. Philippine Water Resource Systems and Water Related Disasters (PDF) (Report). Agricultural and Forestry Research Center, University of Tsukuba. pp. 58–59. Archived (PDF) from the original on 2004-03-22. Retrieved 2012-10-12.
- Climatology and Agrometeorology Branch (2006-11-11). "Tropical Cyclone Track: Typhoon Florita". Philippine Atmospheric, Geophysical and Astronomical Services Administration. Archived from the original on 2003-08-27. Retrieved 2012-10-28.
- China: Flash Floods Appeal No. 16/02 Operations Update No. 5 (Report). ReliefWeb. International Federation of Red Cross and Red Crescent Societies. 2002-12-31. Archived from the original on 2014-08-08. Retrieved 2012-10-15.
- "Historical Exchange Rates". Oanda Corporation. 2012. Archived from the original on 2013-10-04. Retrieved 2012-09-24.
- International Federation of Red Cross and Red Crescent Societies (2002-09-03). China: Flash Floods Appeal No. 16/02 Operations Update No. 4 (Report). ReliefWeb. Archived from the original on 2014-08-08. Retrieved 2012-10-15.
- Gary Padgett (2002). "Monthly Global Tropical Cyclone Summary August 2002". Archived from the original on 2011-09-27. Retrieved 2012-09-01.
- Gary Padgett (2002). "Monthly Global Tropical Cyclone Summary January 2002". Archived from the original on 2014-02-23. Retrieved 2012-09-23.
- Gary Padgett (2002). "Monthly Global Tropical Cyclone Summary, March 2002". Archived from the original on 2011-09-01. Retrieved 2012-08-06.
- "Storm Data and Unusual Weather Phenomena with Late Reports and Corrections" (PDF). Storm Data. National Oceanic and Atmospheric Administration. 44 (3): 134–136. March 2002. Archived from the original (PDF) on 2014-07-30. Retrieved 2012-08-07.
- Gary Padgett (2001). "Monthly Global Tropical Cyclone Tracks March 2002". Archived from the original on 2014-08-11. Retrieved 2012-09-24.
- National Disaster Coordinating Council Office of Civil Defense Operations Center. "Destructive Typhoons 1970–2003". Archived from the original on 2004-11-09. Retrieved 2014-07-30.
- Gary Padgett (2002). "Monthly Global Tropical Cyclone Summary May 2002". Archived from the original on 2014-01-07. Retrieved 2012-09-28.
- Rebecca Schneider. Pacific ENSO Update 3rd Quarter 2002-Vol. 8 No. 3. National Oceanic and Atmospheric Administration Office of Global Program (Report). Pacific Climate Information System. Archived from the original on 2014-08-11. Retrieved 2012-09-28.
- Gary Padgett (2002). "Monthly Global Tropical Cyclone Summary June 2002". Archived from the original on 2008-05-17. Retrieved 2012-10-01.
- Typhoon 200204 (Noguri) – Disaster Information (Report). Digital Typhoon. Archived from the original on 2018-09-21. Retrieved 2012-10-01.
- Weather Disaster Report (2002-936-02) (Report) (in Japanese). Digital Typhoon. Archived from the original on 2018-09-21. Retrieved 2012-10-01.
- Weather Disaster Report (2002-927-02) (Report). Digital Typhoon. Archived from the original on 2018-09-21. Retrieved 2012-10-12.
- Duncan Innes-Ker (2002-07-05). "Water Crisis Eases After Downpour". World Markets Analysis – via Lexis Nexis.
- "China warned to prepare for even worse flooding". Agence France-Presse. 2002-07-03 – via Lexis Nexis.
- "Typhoon hits China's Zhejiang province, inflicts limited damage". Channel NewsAsia. 2002-07-05 – via Lexis Nexis.
- "Typhoon Rammasun hits Japanese island". Channel NewsAsia. 2002-07-04 – via Lexis Nexis.
- Weather Disaster Report (2002-936-04) (Report). Digital Typhoon. Retrieved 2012-10-04.
- Weather Disaster Report (2002-927-03) (Report). Digital Typhoon. Archived from the original on 2018-09-21. Retrieved 2012-10-04.
- Ted Anthony (2002-07-05). "Storm sweeps China's east coast, killing five people in migrant-worker village". Associated Press – via Lexis Nexis.
- "Table tennis ball-sized hails hit North Korea: report". Agence France-Presse. 2002-07-09 – via Lexis Nexis.
- "Chataan Typhoon is Heading for Sakhalin and the Kurils". RIA Novosti. 2002-07-11 – via Lexis Nexis.
- Charles Guard; Mark A. Lander; Bill Ward (2007). A Preliminary Assessment of the Landfall of Typhoon Chataan on Chuuk, Guam, and Rota (Report). World Meteorological Organization. Archived from the original on 2015-03-31. Retrieved 2012-06-20. Alt URL
- International Red Cross and Red Crescent Movement (2002-07-04). Hundreds feared dead in Micronesia mudslides (Report). ReliefWeb. Retrieved 2012-06-27.
- International Red Cross and Red Crescent Movement (2002-07-04). Federated States of Micronesia: Typhoon Chataan Information Bulletin No.01/2002 (Report). ReliefWeb. Retrieved 2012-06-27.
- Angel, William; Hinson, Stuart; Mooring, Rhonda (November 2002). Storm Data and Unusual Weather Phenomena with Late Reports and Corrections (PDF). Storm Data (Report). 44. National Climatic Data Center. pp. 142, 145–149. Archived from the original (PDF) on 2012-08-12.
- Richard A. Fontaine (2004-01-21). Flooding Associated with Typhoon Chata’an, July 5, 2002, Guam (PDF) (Report). United States Geological Survey. Archived (PDF) from the original on February 28, 2013. Retrieved 2012-06-24.
- Typhoon 200206 (Chataan) – Disaster Information (Report) (in Japanese). Digital Typhoon. Archived from the original on 2012-12-18. Retrieved 2012-06-25.
- Theresa Merto (2002-07-12). "Guam Power Authority Lines up Priorities, Crews Work to Connect Shelters, 911 Center". ReliefWeb. Pacific Daily News. Archived from the original on 2012-10-12. Retrieved 2012-10-09.
- "Second typhoon threatens Japan". CNN.com. 2002-07-15 – via Lexis Nexis.
- Weather Disaster Report (2002-582-01) (Report). Digital Typhoon. Archived from the original on 2018-09-21. Retrieved 2012-10-09.
- Weather Disaster Report (2002-590-06) (Report). Digital Typhoon. Archived from the original on 2018-09-21. Retrieved 2012-10-09.
- Weather Disaster Report (2002-604-16) (Report). Digital Typhoon. Archived from the original on 2018-09-21. Retrieved 2012-10-09.
- Weather Disaster Report (2002-616-14) (Report). Digital Typhoon. Archived from the original on 2018-09-21. Retrieved 2012-10-09.
- Weather Disaster Report (2002-936-06) (Report). Digital Typhoon. Archived from the original on 2018-09-21. Retrieved 2012-10-09.
- Weather Disaster Report (2002-827-06) (Report). Digital Typhoon. Archived from the original on 2018-09-21. Retrieved 2012-10-09.
- Weather Disaster Report (2002-893-06) (Report). Digital Typhoon. Archived from the original on 2018-09-21. Retrieved 2012-10-09.
- Digital Typhoon. Typhoon 200207 (Halong) – Disaster Information (Report). Archived from the original on 2018-09-21. Retrieved 2012-10-09.
- Victor Lai (2002-07-09). "Taipei City to Lift Water Restrictions" – via Lexis Nexis.
- "Tropical storm Nakri threatens Taiwan, canceling flights and closing schools". Associated Press. 2002-07-09 – via Lexis Nexis.
- "Storm leaves two dead, one missing in Taiwan". Agence France-Presse. 2002-07-10 – via Lexis Nexis.
- Typhoon 200208 (Nakri) – Disaster Information (Report). Digital Typhoon. Retrieved 2012-10-12.
- Weather Disaster Report (2002-605-15) (Report). Digital Typhoon. Archived from the original on 2018-09-21. Retrieved 2012-10-12.
- Gary Padgett (2006). "Tropical Cyclone Summary for August 2006". Archived from the original on 2012-02-19. Retrieved 2012-09-18.
- "Japanese workers die extracting oil from stranded freighter". Agence France-Presse. 2002-08-26 – via Lexis Nexis.
- "Four die as ship founders". The Daily Telegraph. 2002-07-29 – via Lexis Nexis.
- Typhoon 200209 (Fengshen) – Disaster Information (Report). Digital Typhoon. Archived from the original on 2018-09-21. Retrieved 2012-09-18.
- Weather Disaster Report (2002-827-08) (Report) (in Japanese). Digital Typhoon. Archived from the original on 2018-09-21. Retrieved 2012-09-18.
- Felix De Los Santos (2002-07-23). "Typhoon 'Kaka' Approaches as 'Juan' Lingers". Philippine Headline News Online. Archived from the original on 2005-02-20. Retrieved 2012-10-12.
- Typhoon 200211 (Fung-Wong) – Disaster Information (Report). Digital Typhoon. Retrieved 2012-10-15.
- Weather Disaster Report (2002-815-05) (Report). Digital Typhoon. Archived from the original on 2018-09-21. Retrieved 2012-10-15.
- Damage Caused by Tropical Cyclones in Hong Kong in 2002 (Report). Hong Kong Observatory. Archived from the original on 2014-08-10. Retrieved 2012-10-14.
- "Tropical storm kills 9, injures 12". Xinhua. 2002-08-06 – via Lexis Nexis.
- Peter Harmsen (2002-08-11). "Dozens killed as freak weather wreaks havoc in China". Agence France-Presse – via Lexis Nexis.
- "Deadly storm rips through coastal China". CNN.com. 2002-08-05.
- Ted Anthony (2002-08-06). "Storm hits southern China coast; at least 10 dead, scores of houses damaged". Associated Press – via Lexis Nexis.
- "Tropical depression drifts away from Philippine territory after killing at least 16 people". Associated Press. 2002-08-13 – via Lexis Nexis.
- Typhoon 200213 (Phanfone) – Disaster Information (Report). Digital Typhoon. Archived from the original on 2018-09-21. Retrieved 2012-10-15.
- Weather Disaster Report (2002-409-08) (Report). Digital Typhoon. Archived from the original on 2018-09-21. Retrieved 2012-10-15.
- Jason Gutierrez (2002-08-19). "Storm-induced floods, landslides ravage large swathes of Asia". Agence France-Presse – via Lexis Nexis.
- "Earthweek: A Diary of the Planet". Vancouver Sun. 2002-08-24 – via Lexis Nexis.
- "Typhoon Phanfone skirts Japanese coast, forces people to flee their homes". Associated Press. 2002-08-19 – via Lexis Nexis.
- Clifford Lo (2002-08-20). "Motorcycle rider killed as storm skirts SAR". South China Morning Post (Hong Kong) – via Lexis Nexis.
- "Typhoon Rusa flattens homes in southwestern Japan". Associated Press. 2002-08-29 – via Lexis Nexis.
- "Rusa batters South Korea". Times Colonialist. Associated Press. 2002-09-01 – via Lexis Nexis.
- Typhoon 200215 (RUSA) – Disaster Information (Report) (in Japanese). Digital Typhoon. Archived from the original on 2018-09-21. Retrieved 2012-07-25.
- N. W. Kim; Y. S. Won; I. M. Chung (2006-10-09). "The scale of typhoon Rusa" (PDF). Hydrology and Earth System Sciences Discussions. 3 (5): 3148–3157. Bibcode:2006HESSD...3.3147K. Archived (PDF) from the original on 2013-09-27. Retrieved 2012-07-24.
- "Typhoon Rusa (South Korea) situation report 04 Sept 2002". ReliefWeb. Church World Service. 2002-09-04. Archived from the original on 2014-08-08. Retrieved 2012-07-31.
- Guy Carpenter (2003-01-30). Tropical Cyclone Review 2002 (PDF) (Report). Marsh & McLennan Companies. p. 21. Archived from the original (PDF) on 2012-02-06. Retrieved 2012-07-25.
- International Federation of Red Cross and Red Crescent Societies (2002-09-09). DPR Korea: Typhoon Rusa Information Bulletin No. 2/2002 (Report). ReliefWeb. Archived from the original on 2014-08-08. Retrieved 2012-07-31.
- DPR Korea: Flash Floods/Typhoon Appeal No. 22/02 Final Report (Report). ReliefWeb. International Federation of Red Cross and Red Crescent Societies. 2004-01-08. Archived from the original on 2014-08-08. Retrieved 2012-07-27.
- "Thousands homeless in North Korea from typhoon: aid agencies". ReliefWeb. Agence France-Presse. 2002-09-04. Archived from the original on 2014-08-08. Retrieved 2012-07-31.
- "Philippine seamen rescued as typhoon batters Okinawa". Agence France-Presse. 2002-09-06 – via Lexis Nexis.
- Typhoon 200216 (Sinlaku) – Disaster Information (Report). Digital Typhoon. Archived from the original on 2018-09-21. Retrieved 2012-08-31.
- "Taiwan weathermen, media rapped over Typhoon Sinlaku forecast". Agence France-Presse. 2002-09-08 – via Lexis Nexis.
- William Ide (2002-09-07). "Typhoon Sinlaku soaks Taiwan as it passes over the island". Associated Press – via Lexis Nexis.
- Martin Fackler (2002-09-09). "Typhoon Batters Southeastern China". Associated Press – via Lexis Nexis.
- 2002 Central North Pacific Tropical Cyclones (Report). Central Pacific Hurricane Center. May 2003. Archived from the original on 2008-09-28. Retrieved 2012-10-23.
- Gary Padgett (2002). "Monthly Global Tropical Cyclone Summary September 2002". Archived from the original on 2014-05-03. Retrieved 2012-09-07.
- 3.3 Severe Tropical Storm Hagupit (0218): 10–13 September 2002 (Report). Hong Kong Observatory. Archived from the original on 10 February 2015. Retrieved 2012-10-24.
- 2.1 Review of tropical cyclones in 2002 (Report). Hong Kong Observatory. Archived from the original on 2015-05-21. Retrieved 2012-10-24.
- "Food Supplies Run Out". Saipan Tribune. 2002-10-01. Retrieved 2012-09-07.
- Typhoon 200221 (Higos) – Disaster Information (Report). Digital Typhoon. Archived from the original on 2018-09-21. Retrieved 2012-09-07.
- "Four Dead, Scores Injured as Typhoon Higos Wrecks Havoc in Japan". Channel News Asia. 2002-10-02 – via Lexis Nexis.
- Mari Yamaguchi (2002-10-01). "Tokyo Hunkers Down as Powerful Typhoon Sideswipes City". Associated Press – via Lexis Nexis.
- "Seven dead, eight missing after two shipwrecks caused by typhoon in Russia's Far East". Associated Press. 2002-10-03 – via Lexis Nexis.
- Gary Padgett (2002). "Monthly Global Tropical Cyclone Summary October 2002". Archived from the original on 2017-05-18. Retrieved 2012-10-26.
- Typhoon Maysak Best Track (TXT) (Report). Joint Typhoon Warning Center. 2012-01-19. Archived from the original on 2013-10-05. Retrieved 2012-10-27.
- National Oceanic and Atmospheric Administration (2002). "Global Hazards and Significant Events: November 2002". National Climatic Data Center. Archived from the original on 2017-12-01. Retrieved 2016-05-04.
- Gary Padgett (2002). "Monthly Global Tropical Cyclone Summary November 2002". Archived from the original on 2013-10-21. Retrieved 2012-10-27.
- Federal Emergency Management Agency (2003). "Super Typhoon Pongsona: The First 100 Days Over $300 Million In Disaster Relief And Assistance". Archived from the original on 2013-10-20. Retrieved 2007-07-27.
- Gary Padgett (2003). "Monthly Global Tropical Cyclone Summary December 2002". Archived from the original on 2013-10-22. Retrieved 2012-10-27.
- John J. Kelly Jr. (2003). Super Typhoon Pongsona Service Assessment (PDF) (Report). United States Department of Commerce. Archived from the original (PDF) on 2006-09-27. Retrieved 2012-10-27.
- "Storm Data and Unusual Weather Phenomena with Late Reports" (PDF). Storm Data. National Oceanic and Atmospheric Administration. 44 (12): 119–121. Archived from the original (PDF) on 2014-07-30. Retrieved 2012-10-27.
- Guam Super Typhoon Pongsona (DR-1446) (Report). Federal Emergency Management Agency. Archived from the original on 2014-08-08. Retrieved 2012-10-27.
- Commonwealth of the Northern Mariana Islands Super Typhoon Pongsona (DR-1447) (Report). Federal Emergency Management Agency. Archived from the original on 2014-10-12. Retrieved 2012-10-27.
- Gary Padgett (2002). "Monthly Global Tropical Cyclone Summary February 2002". Archived (PDF) from the original on 2014-11-14. Retrieved 2012-10-27.
- Gary Padgett (2002). "Monthly Global Tropical Cyclone Summary April 2002". Archived from the original on 2013-12-03. Retrieved 2012-09-27.
- Tropical Depression 06W Warning NR 001 (Report). Joint Typhoon Warning Center. Archived from the original on 2018-09-21. Retrieved 2012-09-28.
- Padgett, Gary. "Monthly Tropical Cyclone summary December 1999". Australian Severe Weather. Archived from the original on 2012-02-11. Retrieved 2012-08-28.
- the Typhoon Committee (2012-02-21). "Typhoon Committee Operational Manual 2012" (PDF). World Meteorological Organization. pp. 37–38. Archived (PDF) from the original on 2013-08-01.
- Rio Rose Ribaya (2013-08-01). "How Pagasa names storms". Yahoo! Philippines. Archived from the original on 2013-08-16. Retrieved 2014-09-16.
- Typhoon Committee Operational Manual 2012 Edition (PDF) (Report). World Meteorological Organization. pp. 31–32. Archived (PDF) from the original on 2012-08-28. Retrieved 2012-08-02.
- Climatology and Agrometeorology Branch (2006-11-11). "Tropical Cyclone Track: Tropical Storm Agaton". Philippine Atmospheric, Geophysical and Astronomical Services Administration. Archived from the original on 2003-08-27. Retrieved 2012-10-28.