Bivariate analysis
Bivariate analysis is one of the simplest forms of quantitative (statistical) analysis.[1] It involves the analysis of two variables (often denoted as X, Y), for the purpose of determining the empirical relationship between them.[1]
Bivariate analysis can be helpful in testing simple hypotheses of association. Bivariate analysis can help determine to what extent it becomes easier to know and predict a value for one variable (possibly a dependent variable) if we know the value of the other variable (possibly the independent variable) (see also correlation and simple linear regression).[2]
Bivariate analysis can be contrasted with univariate analysis in which only one variable is analysed.[1] Like univariate analysis, bivariate analysis can be descriptive or inferential. It is the analysis of the relationship between the two variables.[1] Bivariate analysis is a simple (two variable) special case of multivariate analysis (where multiple relations between multiple variables are examined simultaneously).[1]
When there is a dependent variable
If the dependent variable—the one whose value is determined to some extent by the other, independent variable— is a categorical variable, such as the preferred brand of cereal, then probit or logit regression (or multinomial probit or multinomial logit) can be used. If both variables are ordinal, meaning they are ranked in a sequence as first, second, etc., then a rank correlation coefficient can be computed. If just the dependent variable is ordinal, ordered probit or ordered logit can be used. If the dependent variable is continuous—either interval level or ratio level, such as a temperature scale or an income scale—then simple regression can be used.
If both variables are time series, a particular type of causality known as Granger causality can be tested for, and vector autoregression can be performed to examine the intertemporal linkages between the variables.
When there is not a dependent variable
When neither variable can be regarded as dependent on the other, regression is not appropriate but some form of correlation analysis may be. [3]
Graphical methods
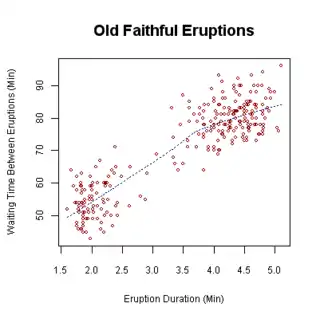
Graphs that are appropriate for bivariate analysis depend on the type of variable. For two continuous variables, a scatterplot is a common graph. When one variable is categorical and the other continuous, a box plot is common and when both are categorical a mosaic plot is common. These graphs are part of descriptive statistics.
External links
- Discriminant correlation analysis (DCA)[4]
References
- Earl R. Babbie, The Practice of Social Research, 12th edition, Wadsworth Publishing, 2009, ISBN 0-495-59841-0, pp. 436–440
- Bivariate Analysis, Sociology Index>
- Chatterjee, Samprit (2012). Regression analysis by example. Hoboken, New Jersey: Wiley. ISBN 978-0470905845.
- M. Haghighat, M. Abdel-Mottaleb, & W. Alhalabi (2016). Discriminant Correlation Analysis: Real-Time Feature Level Fusion for Multimodal Biometric Recognition. IEEE Transactions on Information Forensics and Security, 11(9), 1984-1996.