Denmark (European Parliament constituency)
Denmark is one single European Parliament constituency. Since 1 February 2020, it has been represented by fourteen members of the European Parliament, following a redistribution of seats after the withdrawal of the United Kingdom from the European Union on 31 January 2020.[1] It covers the EU member state of Denmark, but not the Faroe Islands or Greenland, which are not part of the EU.
| Denmark | |
|---|---|
| European Parliament constituency | |
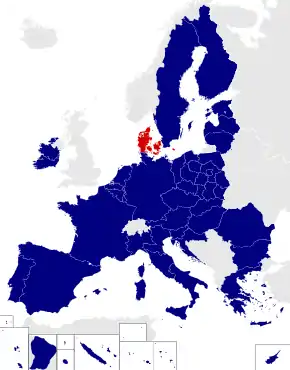 Location among the current constituencies | |
| Member state | Denmark |
| Created | 1979 |
| MEPs | 15 (1979–1989) 16 (1989–2004) 14 (2004–2009) 13 (2009–present) |
| Sources | |
Denmark uses the D'Hondt method of proportional representation. Electoral coalitions between two or more parties are allowed.
Current MEPs
- Margrete Auken, Socialist People's Party, (EG-EFA)
- Bendt Bendtsen, Conservative People's Party, (EPP Group)
- Ole Christensen, Social Democrats, (PASD)
- Anne Elisabet Jensen, Venstre, (ALDE)
- Dan Jørgensen, Social Democrats, (PASD)
- Morten Løkkegaard, Venstre, (ALDE)
- Morten Messerschmidt, Danish People's Party, (EFD)
- Jens Rohde, Venstre, (ALDE)
- Anna Rosbach Andersen, Independent, (ECR)[2]
- Christel Schaldemose, Social Democrats, (PASD)
- Søren Søndergaard, People's Movement against the EU, (GUE-NGL)
- Britta Thomsen, Social Democrats, (PASD)
- Emilie Turunen, Socialist People's Party, (EG-EFA)
1979
The 1979 European election was the first direct election to be held to the European Parliament, and hence the first time Denmark voted for their MEPs.
| Party | Votes | % | Seats |
|---|---|---|---|
| Social Democrats (A) | 382,487 | 21.80% | 3 |
| People's Movement against the EEC Union (N) | 365,760 | 20.85% | 4 |
| Venstre (V) | 252.767 | 14.41% | 3 |
| Conservative People's Party (C) | 245,309 | 13.98% | 2 |
| Centre Democrats (D) | 107,790 | 6.14% | 1 |
| Progress Party (Z) | 100,702 | 5.74% | 1 |
| Socialist People's Party (F) | 81,991 | 4.67% | 1 |
| Others | 217,405 | 12.14% | 0 |
| Eligible Voters | 3,754,423 |
| Votes cast | 1,791,268 (47.71%) |
| Invalid votes | 37,057 (2.07%) |
1984
The 1984 European election was the second election to the European Parliament.
| ← 1979 • 1984 • 1989 → | ||||||||
| National party | European party | Main candidate | Votes | % | +/– | Seats | +/– | |
|---|---|---|---|---|---|---|---|---|
| Conservative People's Party (KF) | EPP | 414,177 | 20.69 | +6.7 | 4 | +2 | ||
| People's Movement against the EEC (FOLKEB) | TEAM | 413.808 | 20.67 | -0.2 | 4 | 0 | ||
| Social Democrats (S) | PES | 387,098 | 19.34 | -2.5 | 3 | 0 | ||
| Left Liberal Party (V) | 248,397 | 12.41 | -2 | 2 | -1 | |||
| Socialist People's Party (SF) | NGLA | 183.580 | 9.17 | +4.5 | 1 | 0 | ||
| Centre Democrats (CD) | 131,984 | 6.59 | +0.5 | 1 | 0 | |||
| Progress Party (FP) | 68,747 | 3.43 | 0 | 0 | ||||
| Christian Democrats (K) | 54,624 | 2.73 | 0 | 0 | ||||
| Social Liberal Party (RV) | ELDR | 32,560 | 1.63 | 0 | 0 | |||
| Left Socialists (VS) | 25,305 | 1.26 | 0 | 0 | ||||
| Other parties | — | 0 | — | |||||
| Valid votes | 2,001,906 | 99.26 | ||||||
| Blank and invalid votes | 14,966 | 0.74 | ||||||
| Totals | 2,016,872 | 100.00 | — | 15 | 0 | |||
| Electorate (eligible voters) and voter turnout | 3,878,600 | 52.00 | 4.29 |
|||||
| References[3] | ||||||||
1989
The 1989 European election was the third election to the European Parliament and was held on 15 June for Denmark. The electoral coalitions were (A + B), (C + V), (F + N) and (D + Q) and (Z) by themselves.
| ← 1984 • 1989 • 1994 → | ||||||||
| National party | European party | Main candidate | Votes | % | +/– | Seats | +/– | |
|---|---|---|---|---|---|---|---|---|
| Social Democrats (A) | 417,076 | 23.3 | +3.8 | 4 | +1 | |||
| People's Movement against the EEC (N) | 338,953 | 18.9 | -1.9 | 4 | 0 | |||
| Venstre (V) | 297,565 | 16.6 | +4.2 | 3 | +1 | |||
| Conservative People's Party (C) | 238,760 | 13.3 | -7.5 | 2 | -2 | |||
| Socialist People's Party (F) | 162,902 | 9.1 | -0.1 | 1 | 0 | |||
| Centre Democrats (D) | 142,190 | 8.0 | +1.4 | 2 | +1 | |||
| Progress Party (Z) | 93,985 | 5.3 | +1.8 | 0 | 0 | |||
| Danish Social Liberal Party (B) | 50,196 | 2.8 | -0.3 | 0 | 0 | |||
| Christian People's Party (Q) | 47,768 | 2.7 | -0.1 | 0 | 0 | |||
| Valid votes | 1,789,395 | 98.78 | ||||||
| Blank and invalid votes | 22,163 | 1.22 | ||||||
| Totals | 1,811,558 | 100.00 | — | 16 | 1 | |||
| Electorate (eligible voters) and voter turnout | 3,923,549 | 46.17 | 5.83 |
|||||
| References | [4] | |||||||
1994
The 1994 European election was the fourth election to the European Parliament and was held on 9 June for Denmark. The electoral coalitions were (B + Q), (C + D + V) and (J + N) and the remaining parties by themselves.
| ← 1989 • 1994 • 1999 → | ||||||||
| National party | European party | Main candidate | Votes | % | +/– | Seats | +/– | |
|---|---|---|---|---|---|---|---|---|
| Liberals (V) | 394,362 | 18.96 | 2.33 | 4 | 1 | |||
| Conservative People's Party (C) | 368,890 | 17.74 | 4.40 | 3 | 1 | |||
| Social Democrats (A) | 329,202 | 15.83 | 7.48 | 3 | 1 | |||
| June Movement (J) | 316,687 | 15.23 | new | 2 | new | |||
| People's Movement against the EU (N) | 214,735 | 10.32 | 8.62 | 2 | 2 | |||
| Socialist People's Party (F) | 178,543 | 8.58 | 0.52 | 1 | 0 | |||
| Social Liberal Party (B) | 176,480 | 8.48 | 5.67 | 1 | 1 | |||
| Progress Party (Z) | 59,687 | 2.9 | 2.4 | 0 | 0 | |||
| Christian People's Party (Q) | 22,986 | 1.1 | 1.6 | 0 | 0 | |||
| Centre Democrats (D) | 18,365 | 0.9 | 7.1 | 0 | 2 | |||
| Valid votes | 2,079,937 | 98.40 | ||||||
| Blank and invalid votes | 33,843 | 1.60 | ||||||
| Totals | 2,113,780 | 100.00 | — | 16 | 0 | |||
| Electorate (eligible voters) and voter turnout | 3,994,200 | 52.92 | 6.75 |
|||||
| Source: [5] | ||||||||
1999
The 1999 European election was the fifth election to the European Parliament and was held on 10 June for Denmark. The electoral coalitions were (C + D + V) and (J + N) and the remaining parties by themselves.
| ← 1994 • 1999 • 2004 → | ||||||||
| National party | European party | Main candidate | Votes | % | +/– | Seats | +/– | |
|---|---|---|---|---|---|---|---|---|
| Liberals (V) | ALDE | 460,834 | 23.39 | 4.43 | 5 / 16 | 1 | ||
| Social Democrats (A) | PES | 324,256 | 16.46 | 0.63 | 3 / 16 | 0 | ||
| June Movement (J) | EPP | 317,508 | 16.11 | 0.88 | 3 / 16 | 1 | ||
| Social Liberal Party (B) | IND/DEM | 180,089 | 9.14 | 0.66 | 1 / 16 | 0 | ||
| Conservative People's Party (C) | EPP | 166,884 | 8.47 | 9.27 | 1 / 16 | 2 | ||
| People's Movement against the EU (N) | GUE/NGL | 143,709 | 7.29 | 3.03 | 1 / 16 | 1 | ||
| Socialist People's Party (F) | GUE/NGL | 140,053 | 7.11 | 1.47 | 1 / 16 | 0 | ||
| People's Party (O) | None | 114,865 | 5.83 | new | 1 / 16 | 1 | ||
| Centre Democrats (D) | None | 68,717 | 3.49 | 2.6 | 0 / 16 | 0 | ||
| Christian People's Party (Q) | EPP | 39,128 | 1.99 | 0.9 | 0 / 16 | 0 | ||
| Progress Party (Z) | EPP | 14,233 | 0.72 | 2.1 | 0 / 16 | 0 | ||
| Valid votes | 1,970,276 | 97.38 | ||||||
| Blank and invalid votes | 53,030 | 2.62 | ||||||
| Totals | 2,023,306 | 100.00 | — | 16 / 16 |
0 | |||
| Electorate (eligible voters) and voter turnout | 4,009,594 | 50.46 | 2.46 |
|||||
| Source: "Valget til Europaparlamentet den 10. juni 1999" (PDF). (1999-07-03). Ministry of the Interior (in Danish), pp. 2, 4, 15, 17. Retrieved on 2007-09-03. | ||||||||
2004
The 2004 European election was the sixth election to the European Parliament and was held on 13 June for Denmark. The opposition Social Democrats made major gains, mainly at the expense of Eurosceptic parties such as the June Movement.
The electoral coalitions were (A + F), (B + Q), (C + V), (J + N) with (O) by themselves. Compared to straight allocation by party, The People's Movement Against the EU gained one seat at the expense of the Conservative People's Party.
| ← 1999 • 2004 • 2009 → | ||||||||
| National party | European party | Main candidate | Votes | % | +/– | Seats | +/– | |
|---|---|---|---|---|---|---|---|---|
| Social Democrats (A) | 618,412 | 32.6 | 16.1 | 5 | 2 | |||
| Liberals (V) | 366,735 | 19.4 | 4.0 | 3 | 2 | |||
| Conservative People's Party (C) | 214,972 | 11.3 | 2.8 | 1 | 0 | |||
| June Movement (J) | 171,927 | 9.1 | 7.0 | 1 | 2 | |||
| Socialist People's Party (F) | 150,766 | 8.0 | 0.9 | 1 | 0 | |||
| People's Party (O) | 128,789 | 6.8 | 1.0 | 1 | 0 | |||
| Social Liberal Party (B) | 120,473 | 6.4 | 2.7 | 1 | 0 | |||
| People's Movement against the EU (N) | 97,986 | 5.2 | 1 | 0 | ||||
| Christian Democrats (K) | EPP | 24,286 | 1.3 | 0 | 0 | |||
| Valid votes | 1,894,346 | 98.58 | ||||||
| Blank and invalid votes | 27,195 | 1.42 | ||||||
| Totals | 1,921,541 | 100.00 | — | 14 | 2 | |||
| Electorate (eligible voters) and voter turnout | 4,012,663 | 47.89 | 2.57 |
|||||
| Reference [6] | ||||||||
2009
| Parties and coalitions | Votes | Seats | ||||||
|---|---|---|---|---|---|---|---|---|
| Symbol | Name (Danish name) | European party | No. | % | ±% | No. | ± | |
| A | Social Democrats (Socialdemokraterne) | PES | 503,439 | 21.49 | -11.1 | 4 | -1 | |
| V | Liberals (Venstre, Danmarks Liberale Parti) | ELDR | 474,041 | 20.24 | +0.8 | 3 | ±0 | |
| F | Socialist People's Party (Socialistisk Folkeparti) | EGP observer | 371,603 | 15.87 | +7.8 | 2 | +1 | |
| O | Danish People's Party (Dansk Folkeparti) | AEN | 357,942 | 15.28 | +8.5 | 2 | +1 | |
| C | Conservative People's Party (Det Konservative Folkeparti) | EPP | 297,199 | 12.69 | +1.3 | 1 | ±0 | |
| N | People's Movement against the EU (Folkebevægelsen mod EU) | none (GUE/NGL group) | 168,555 | 7.20 | +2.2 | 1 | ±0 | |
| B | Danish Social Liberal Party (Det Radikale Venstre) | 100,094 | 4.27 | -2.2 | 0 | -1 | ||
| J | June Movement (JuniBevægelsen) | 55,459 | 2.37 | -6.8 | 0 | -1 | ||
| I | Liberal Alliance (Liberal Alliance) | 13,796 | 0.59 | N/A | 0 | N/A | ||
| Valid votes | 2,342,128 | 96.96 | ||||||
| Blank and invalid votes | 73,440 | 3.04 | ||||||
| Totals | 2,415,568 | 100.00 | — | 13 | 1 | |||
| Electorate (eligible voters) and voter turnout | 4,057,100 | 59.54 | ||||||
Turnout figure includes blank and invalid votes, but these are excluded from the total.
References
- "Redistribution of seats in the European Parliament after Brexit | News | European Parliament". www.europarl.europa.eu. 31 January 2020. Retrieved 25 July 2020.
- Elected for Danish People's Party and sat in Europe of Freedom and Democracy until 9 March 2011.
- [http://www.pre.gva.es/pls/argos_elec/DMEDB_elecPaises.informeElec?aVPaisId=DK&aVLengua=c Archivo Histórico Electoral Election 1984
- Sørensen, Jens Adser (ed.) (1989). Folketingstidende. Årborg og registre. Folketingsåret 1988-89 (in Danish). Copenhagen, J. H. Schultz forlag, pp. 27-28. ISBN 87-569-6641-5.
- "Valget til Europaparlamentet den 9. juni 1994" (PDF). (1995-01-09). Ministry of the Interior (in Danish), pp. 2, 4, 5, 14, 16. Retrieved on 2007-10-07.
- "Valget til Europaparlamentet den 13. juni 2004" (PDF). (2007-08-08). Ministry of the Interior and Health (in Danish), pp. 8, 11, 21. ISBN 978-87-7601-239-7. Retrieved on 2007-10-03.
- Statistics Denmark
External links
- European Election News by European Election Law Association (Eurela)
- List of MEPs europarl.europa.eu