Leinster (European Parliament constituency)
Leinster was a constituency of the European Parliament in Ireland between 1979 and 2004. It elected 3 Members of the European Parliament (MEPs) in the 1979, 1984 and 1989 elections and 4 MEPs in the elections of 1994 and 1999 using the single transferable vote form of proportional representation (PR-STV).
| Leinster | |
|---|---|
| European Parliament constituency | |
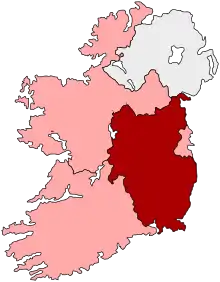 Shown within Ireland | |
| Member state | Ireland |
| Created | 1979 |
| Dissolved | 2004 |
| MEPs | 3 (1979–1994) 4 (1994–2004) |
| Sources | |
History and boundaries
The constituency was created in 1979 for the first direct elections to the European Parliament. It comprised the counties of Carlow, Kildare, Kilkenny, Laois, Longford, Louth, Meath, Offaly, Westmeath, Wexford and Wicklow from the historic province of Leinster excluding the County Dublin area.[1] It was abolished under the European Parliament Elections (Amendment) Act 2004 and succeeded by the new East constituency.[2]
MEPs
| Members of the European Parliament (MEPs) for Leinster 1979–2009 | |||||||||
|---|---|---|---|---|---|---|---|---|---|
|
Key to parties
| |||||||||
| Parl. | Election | Member (Party) | Member (Party) | Member (Party) | Member (Party) | ||||
| 1st | 1979[3] | Mark Clinton (FG) |
Patrick Lalor (FF) |
Liam Kavanagh (Lab) |
3 seats until 1994 | ||||
| 1981[4] | Séamus Pattison (Lab) | ||||||||
| 1983[4] | Justin Keating (Lab) | ||||||||
| 2nd | 1984[5] | Jim Fitzsimons (FF) | |||||||
| 3rd | 1989[6] | Patrick Cooney (FG) | |||||||
| 4th | 1994[7] | Alan Gillis (FG) |
Liam Hyland (FF) |
Nuala Ahern (GP) | |||||
| 5th | 1999[8] | Avril Doyle (FG) | |||||||
| 6th | 2004 | Constituency abolished. See East. | |||||||
Note: The columns in this table are used only for presentational purposes, and no significance should be attached to the order of columns. For details of the order in which seats were won at each election, see the detailed results of that election.
Elections
1999 election
| Party | Candidate | FPv% | Count | |||
|---|---|---|---|---|---|---|
| 1 | 2 | 3 | ||||
| Fine Gael | Avril Doyle | 19.8 | 67,881 | 69,495 | ||
| Fianna Fáil | Jim Fitzsimons | 17.2 | 58,750 | 61,439 | 66,117 | |
| Fianna Fáil | Liam Hyland | 17.1 | 58,477 | 61,931 | 65,496 | |
| Fine Gael | Alan Gillis | 14.2 | 48,729 | 50,040 | 56,881 | |
| Green | Nuala Ahern | 13.8 | 47,184 | 52,618 | 66,808 | |
| Labour | Seán Butler | 11.1 | 38,112 | 40,849 | ||
| Sinn Féin | Arthur Morgan | 5.9 | 20,015 | |||
| Natural Law | Desmond Garrett | 0.9 | 3,191 | |||
| Electorate: 706,200 Valid: 342,339 Spoilt: 14,725 (4.1%) Quota: 68,468 Turnout: 357,064 (50.6%) | ||||||
Alan Gillis lost his seat to his party running mate Avril Doyle.
1994 election
| Party | Candidate | FPv% | Count | |||||||
|---|---|---|---|---|---|---|---|---|---|---|
| 1 | 2 | 3 | 4 | 5 | 6 | 7 | ||||
| Fianna Fáil | Liam Hyland | 17.7 | 46,448 | 46,737 | 47,255 | 48,238 | 49,236 | 51,543 | 54,161 | |
| Fine Gael | Alan Gillis | 16.3 | 42,826 | 43,156 | 43,346 | 43,793 | 47,112 | 48,309 | 50,896 | |
| Fianna Fáil | Jim Fitzsimons | 15.8 | 41,375 | 41,611 | 42,516 | 43,684 | 44,802 | 45,626 | 50,263 | |
| Green | Nuala Ahern | 11.8 | 30,997 | 32,302 | 33,849 | 35,712 | 37,946 | 39,297 | 45,821 | |
| Fine Gael | Monica Barnes | 11.4 | 29,958 | 30,235 | 30,448 | 30,949 | 33,692 | 35,070 | 39,518 | |
| Labour | Michael Bell | 8.8 | 22,987 | 23,186 | 23,815 | 24,442 | 25,366 | 34,926 | ||
| Labour | Séamus Pattison | 6.7 | 17,580 | 17,869 | 18,140 | 18,478 | 18,953 | |||
| Progressive Democrats | John Dardis | 4.8 | 12,591 | 12,919 | 13,052 | 13,472 | ||||
| Independent | Jack Fitzsimons | 2.6 | 6,752 | 7,262 | 7,802 | |||||
| Sinn Féin | Lucilita Bhreatnach | 2.5 | 6,523 | 6,627 | ||||||
| Independent | Peter Sweetman | 1.2 | 3,228 | |||||||
| Natural Law | Tom Mullins | 0.5 | 1,180 | |||||||
| Electorate: 624,561 Valid: 262,445 Spoilt: 6,599 (2.5%) Quota: 52,490 Turnout: 269,044 (43.1%) | ||||||||||
Alan Gillis replaced his party colleague Patrick Cooney who had stepped down. The Green Party gained the additional seat.
1989 election
| Party | Candidate | FPv% | Count | |||||||||||
|---|---|---|---|---|---|---|---|---|---|---|---|---|---|---|
| 1 | 2 | 3 | 4 | 5 | 6 | 7 | 8 | 9 | 10 | 11 | ||||
| Fianna Fáil | Patrick Lalor | 20.0 | 75,627 | 75,715 | 75,856 | 76,198 | 76,370 | 76,914 | 78,753 | 81,555 | 85,090 | 88,868 | 90,473 | |
| Fine Gael | Patrick Cooney | 17.4 | 65,775 | 65,926 | 65,962 | 66,430 | 66,504 | 66,733 | 67,963 | 71,289 | 82,701 | 112,060 | ||
| Fianna Fáil | Jim Fitzsimons | 16.9 | 63,797 | 63,906 | 63,994 | 64,344 | 64,528 | 65,214 | 66,474 | 69,639 | 72,739 | 74,004 | 75,249 | |
| Labour | Michael Bell | 13.2 | 49,766 | 49,870 | 49,954 | 50,298 | 50,537 | 51,104 | 55,754 | 61,606 | 65,668 | 68,015 | 75,239 | |
| Fine Gael | Charles McDonald | 9.5 | 35,792 | 35,863 | 35,944 | 36,063 | 36,168 | 36,367 | 37,910 | 39,962 | 46,931 | |||
| Progressive Democrats | John Dardis | 8.4 | 31,623 | 31,730 | 31,789 | 32,159 | 32,194 | 32,393 | 33,703 | 37,490 | ||||
| Green | Seán English | 6.3 | 23,724 | 23,922 | 23,992 | 24,309 | 24,401 | 25,162 | 27,199 | |||||
| Workers' Party | Michael Enright | 2.5 | 9,451 | 9,731 | 9,797 | 9,982 | 10,093 | 10,703 | ||||||
| Workers' Party | Catherine Murphy | 1.9 | 7,089 | 7,125 | 7,321 | 7,413 | 7,684 | 8,155 | ||||||
| Sinn Féin | Kevin Dunphy | 1.2 | 4,534 | 4,620 | 5,036 | 5,329 | 7,393 | |||||||
| Independent | Kevin Boland | 0.9 | 3,362 | 3,462 | 3,496 | |||||||||
| Sinn Féin | Pearse McGeough | 0.8 | 3,001 | 3,009 | 3,863 | 3,930 | ||||||||
| Sinn Féin | Terry Moore | 0.6 | 2,424 | 2,438 | ||||||||||
| Independent | Cornelius de Groot | 0.4 | 1,626 | |||||||||||
| Electorate: 571,694 Valid: 377,591 Spoilt: 14,106 (3.6%) Quota: 94,398 Turnout: 391,697 (68.5%) | ||||||||||||||
Mark Clinton stepped down and was replaced by his party colleague Patrick Cooney.
1984 election
| Party | Candidate | FPv% | Count | ||||
|---|---|---|---|---|---|---|---|
| 1 | 2 | 3 | 4 | ||||
| Fine Gael | Mark Clinton | 23.8 | 61,669 | 63,159 | 92,091 | ||
| Fianna Fáil | Jim Fitzsimons | 22.1 | 57,321 | 60,028 | 60,994 | 63,935 | |
| Fianna Fáil | Patrick Lalor | 21.7 | 56,191 | 59,180 | 59,928 | 61,277 | |
| Fine Gael | Deirdre Bolger | 12.8 | 33,208 | 34,570 | |||
| Labour | Justin Keating | 11.9 | 30,773 | 35,308 | 37,756 | 53,552 | |
| Workers' Party | Liz McManus | 3.5 | 8,943 | ||||
| Sinn Féin | Martin Sharkey | 1.8 | 4,548 | ||||
| Sinn Féin | John Carroll | 1.7 | 4,396 | ||||
| Sinn Féin | James Dwyer | 0.9 | 2,245 | ||||
| Electorate: 545,878 Valid: 259,294 Spoilt: 9,197 (3.4%) Quota: 64,824 Turnout: 268,491 (49.2%) | |||||||
Justin Keating lost his seat to Jim Fitzsimmons of Fianna Fáil.
1979 election
| Party | Candidate | FPv% | Count | |||||
|---|---|---|---|---|---|---|---|---|
| 1 | 2 | 3 | 4 | 5 | ||||
| Fine Gael | Mark Clinton | 25.7 | 78,762 | |||||
| Fianna Fáil | Patrick Lalor | 20.2 | 62,094 | 63,538 | 65,267 | 77,790 | ||
| Labour | Liam Kavanagh[4] | 13.1 | 40,072 | 43,704 | 47,801 | 49,187 | 58,576 | |
| Fianna Fáil | Tom Nolan | 11.2 | 34,210 | 35,502 | 36,048 | 48,375 | 51,343 | |
| Fianna Fáil | Paddy Power | 10.1 | 31,023 | 32,119 | 32,668 | |||
| Fine Gael | Charles McDonald | 8.1 | 24,875 | 25,637 | 37,841 | 38,794 | ||
| Fine Gael | Monica Barnes | 7.0 | 21,384 | 22,461 | ||||
| Sinn Féin – The Workers' Party | Donnchadha MacRaghnaill | 2.7 | 8,414 | |||||
| Sinn Féin – The Workers' Party | Sean Walsh | 2.0 | 6,062 | |||||
| Electorate: 486,248 Valid: 306,896 Spoilt: 15,416 (4.8%) Quota: 76,725 Turnout: 322,312 (66.3%) | ||||||||
References
- "European Assembly Elections Act, 1977: Schedule (Constituencies)". Irish Statute Book database. Retrieved 22 November 2011.
- "European Parliament Elections (Amendment) Act 2004: Schedule (Constituencies)". Irish Statute Book database. Retrieved 22 November 2011.
- "1979 European Parliament election – Leinster constituency". ElectionsIreland.org. Retrieved 22 March 2009.
- Liam Kavanagh resigned on 7 July 1981 after becoming Minister for Labour and was substituted by Séamus Pattison (LAB / PES) on 9 July 1981. Séamus Pattison resigned on 15 December 1983 and was substituted by Justin Keating (LAB / PES) on 8 February 1984.
- "1984 European Parliament election – Leinster constituency". ElectionsIreland.org. Retrieved 22 March 2009.
- "1989 European Parliament election – Leinster constituency". ElectionsIreland.org. Retrieved 22 March 2009.
- "1994 European Parliament election – Leinster constituency". ElectionsIreland.org. Retrieved 22 March 2009.
- "1999 European Parliament election – Leinster constituency". ElectionsIreland.org. Retrieved 22 March 2009.
- http://irelandelection.com/electiondetail.php?elecid=216&constitid=476&electype=7
- https://www.europarl.europa.eu/ireland/en/your-meps/1994-european-elections-results
- https://www.europarl.europa.eu/ireland/en/your-meps/1989-european-elections-results
- http://irelandelection.com/electiondetail.php?elecid=215&constitid=476&electype=7
- https://www.europarl.europa.eu/ireland/en/your-meps/1984-european-elections-results
- http://irelandelection.com/electiondetail.php?elecid=214&constitid=476&electype=7
- https://www.europarl.europa.eu/ireland/en/your-meps/1979-european-elections-results
- http://irelandelection.com/electiondetail.php?elecid=213&constitid=476&electype=7